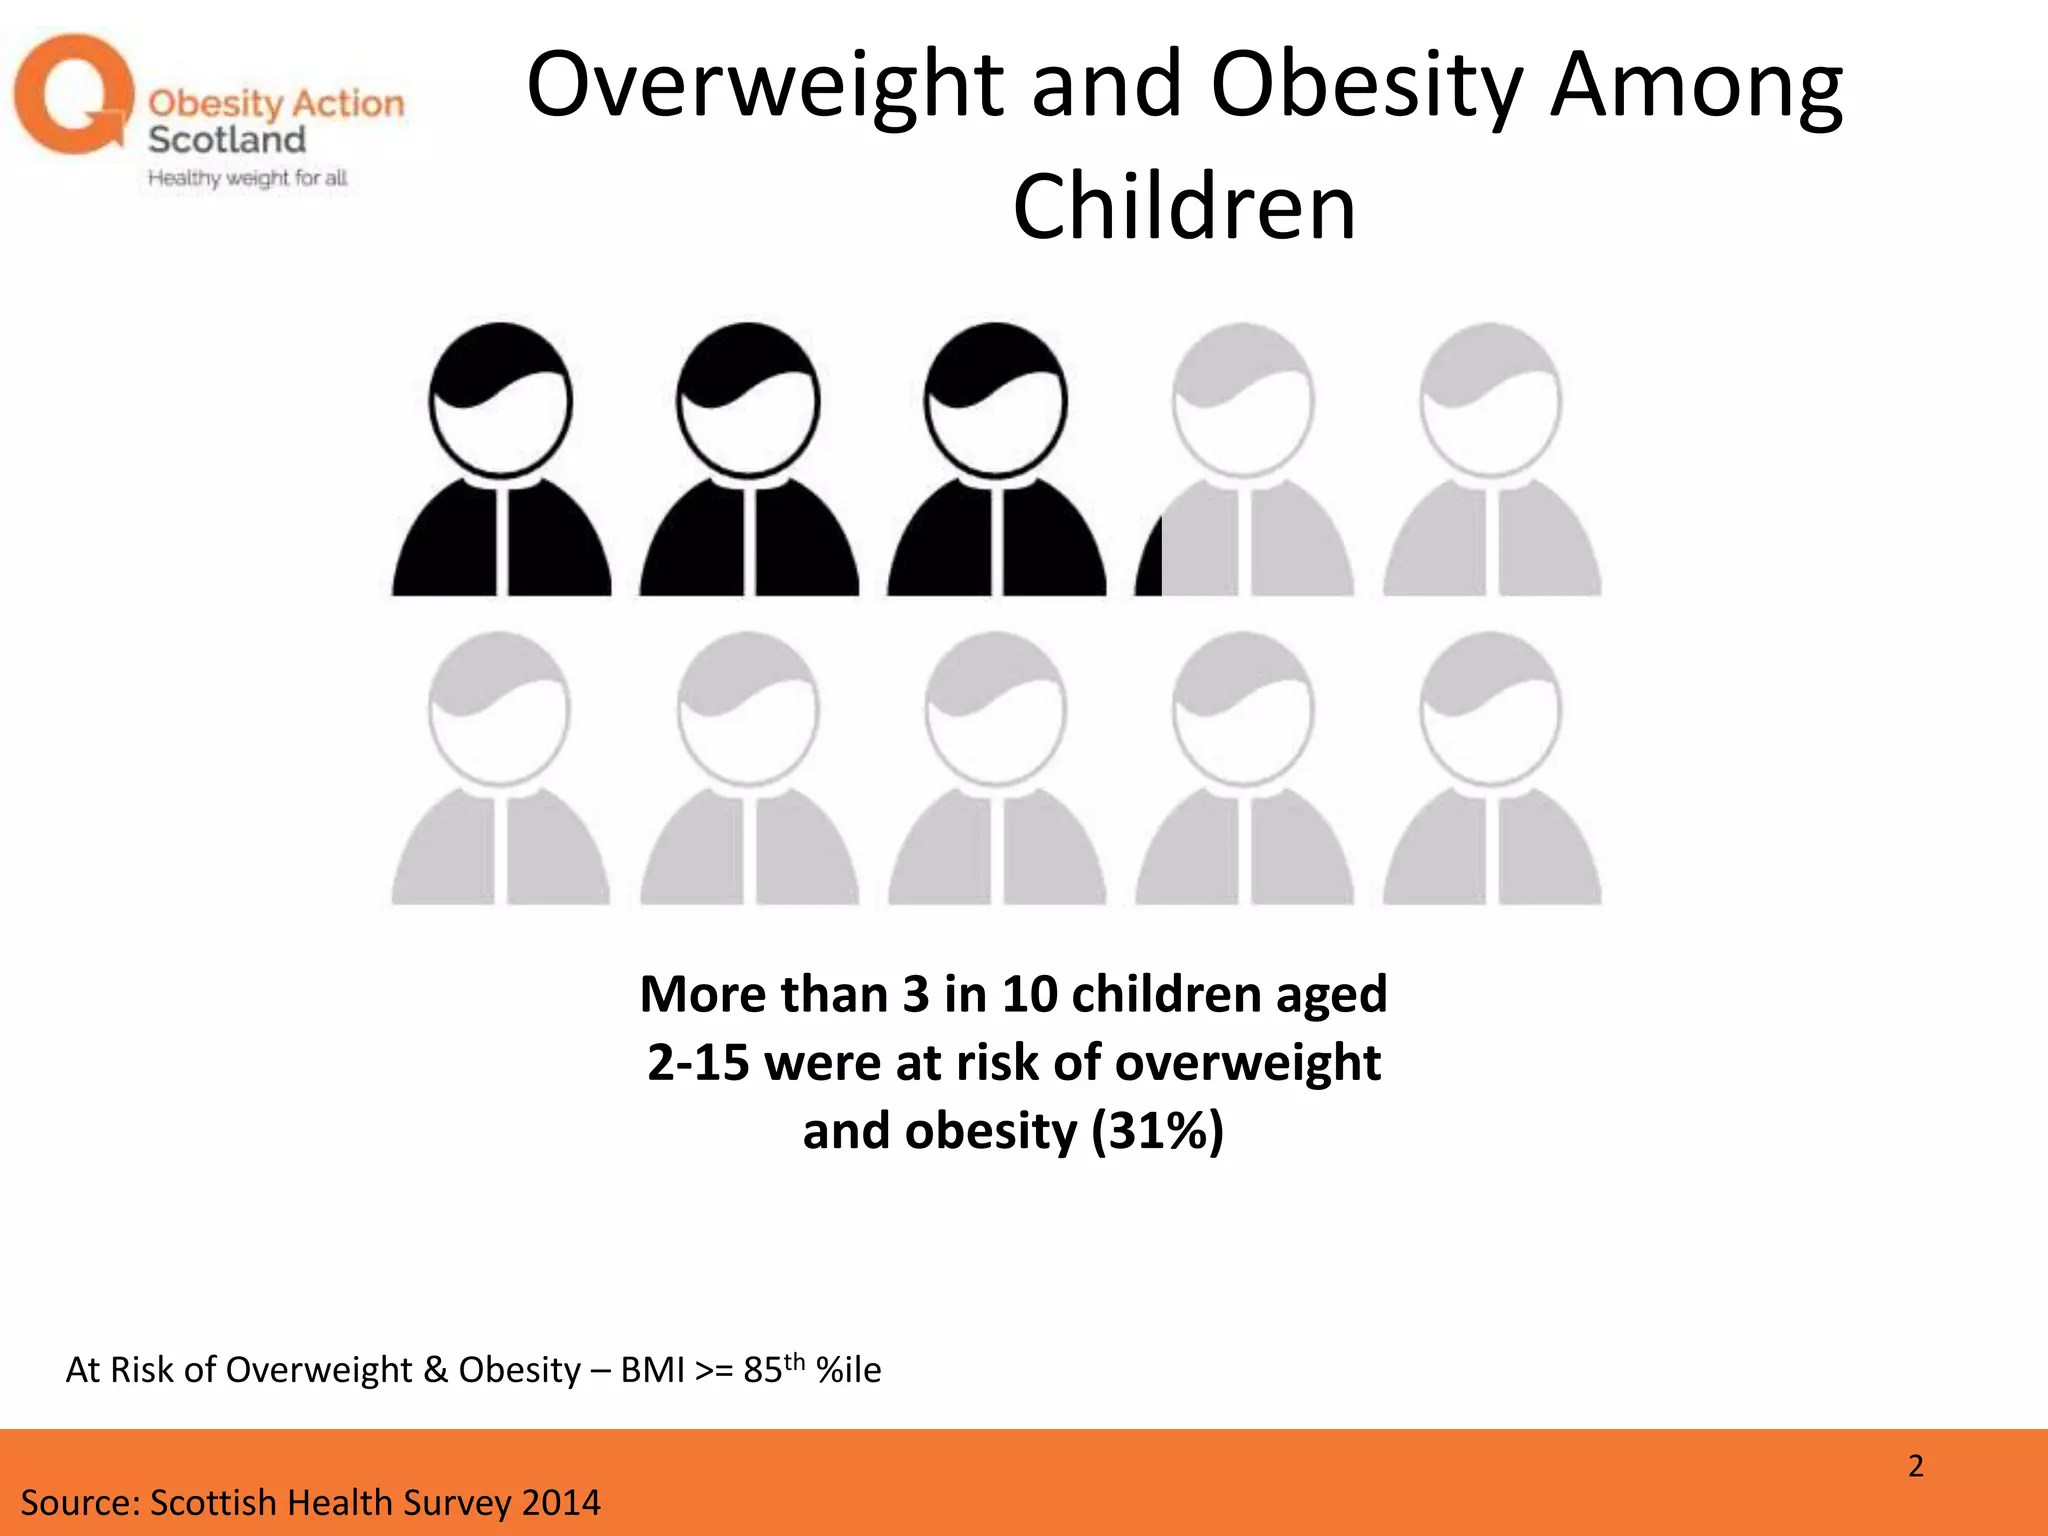
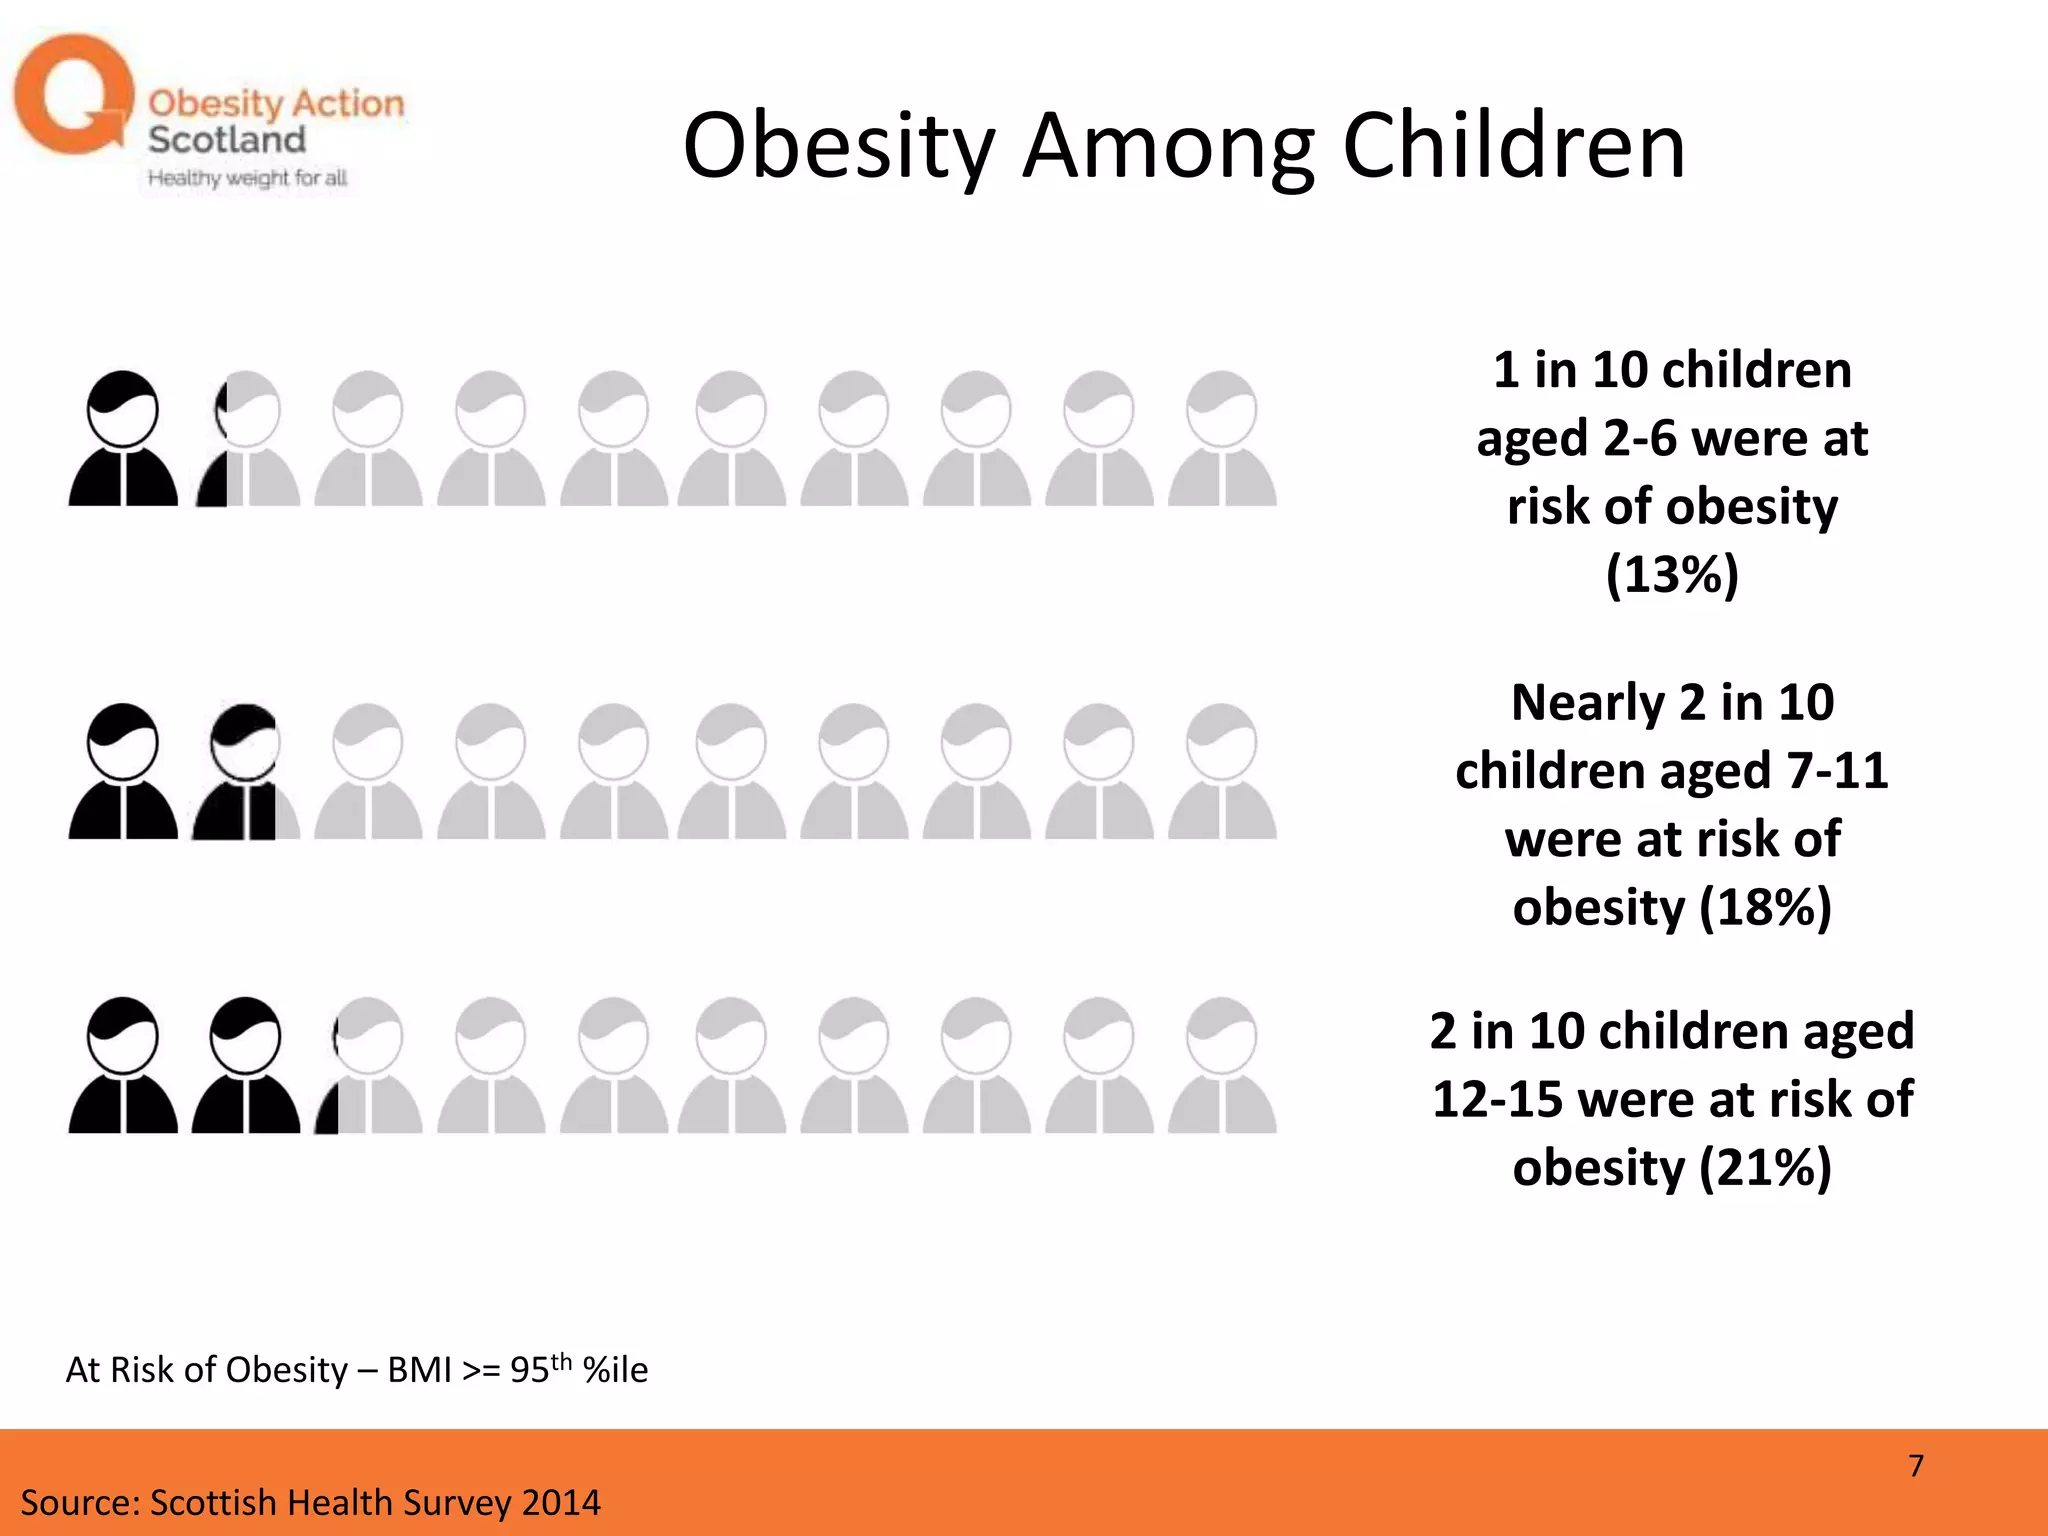
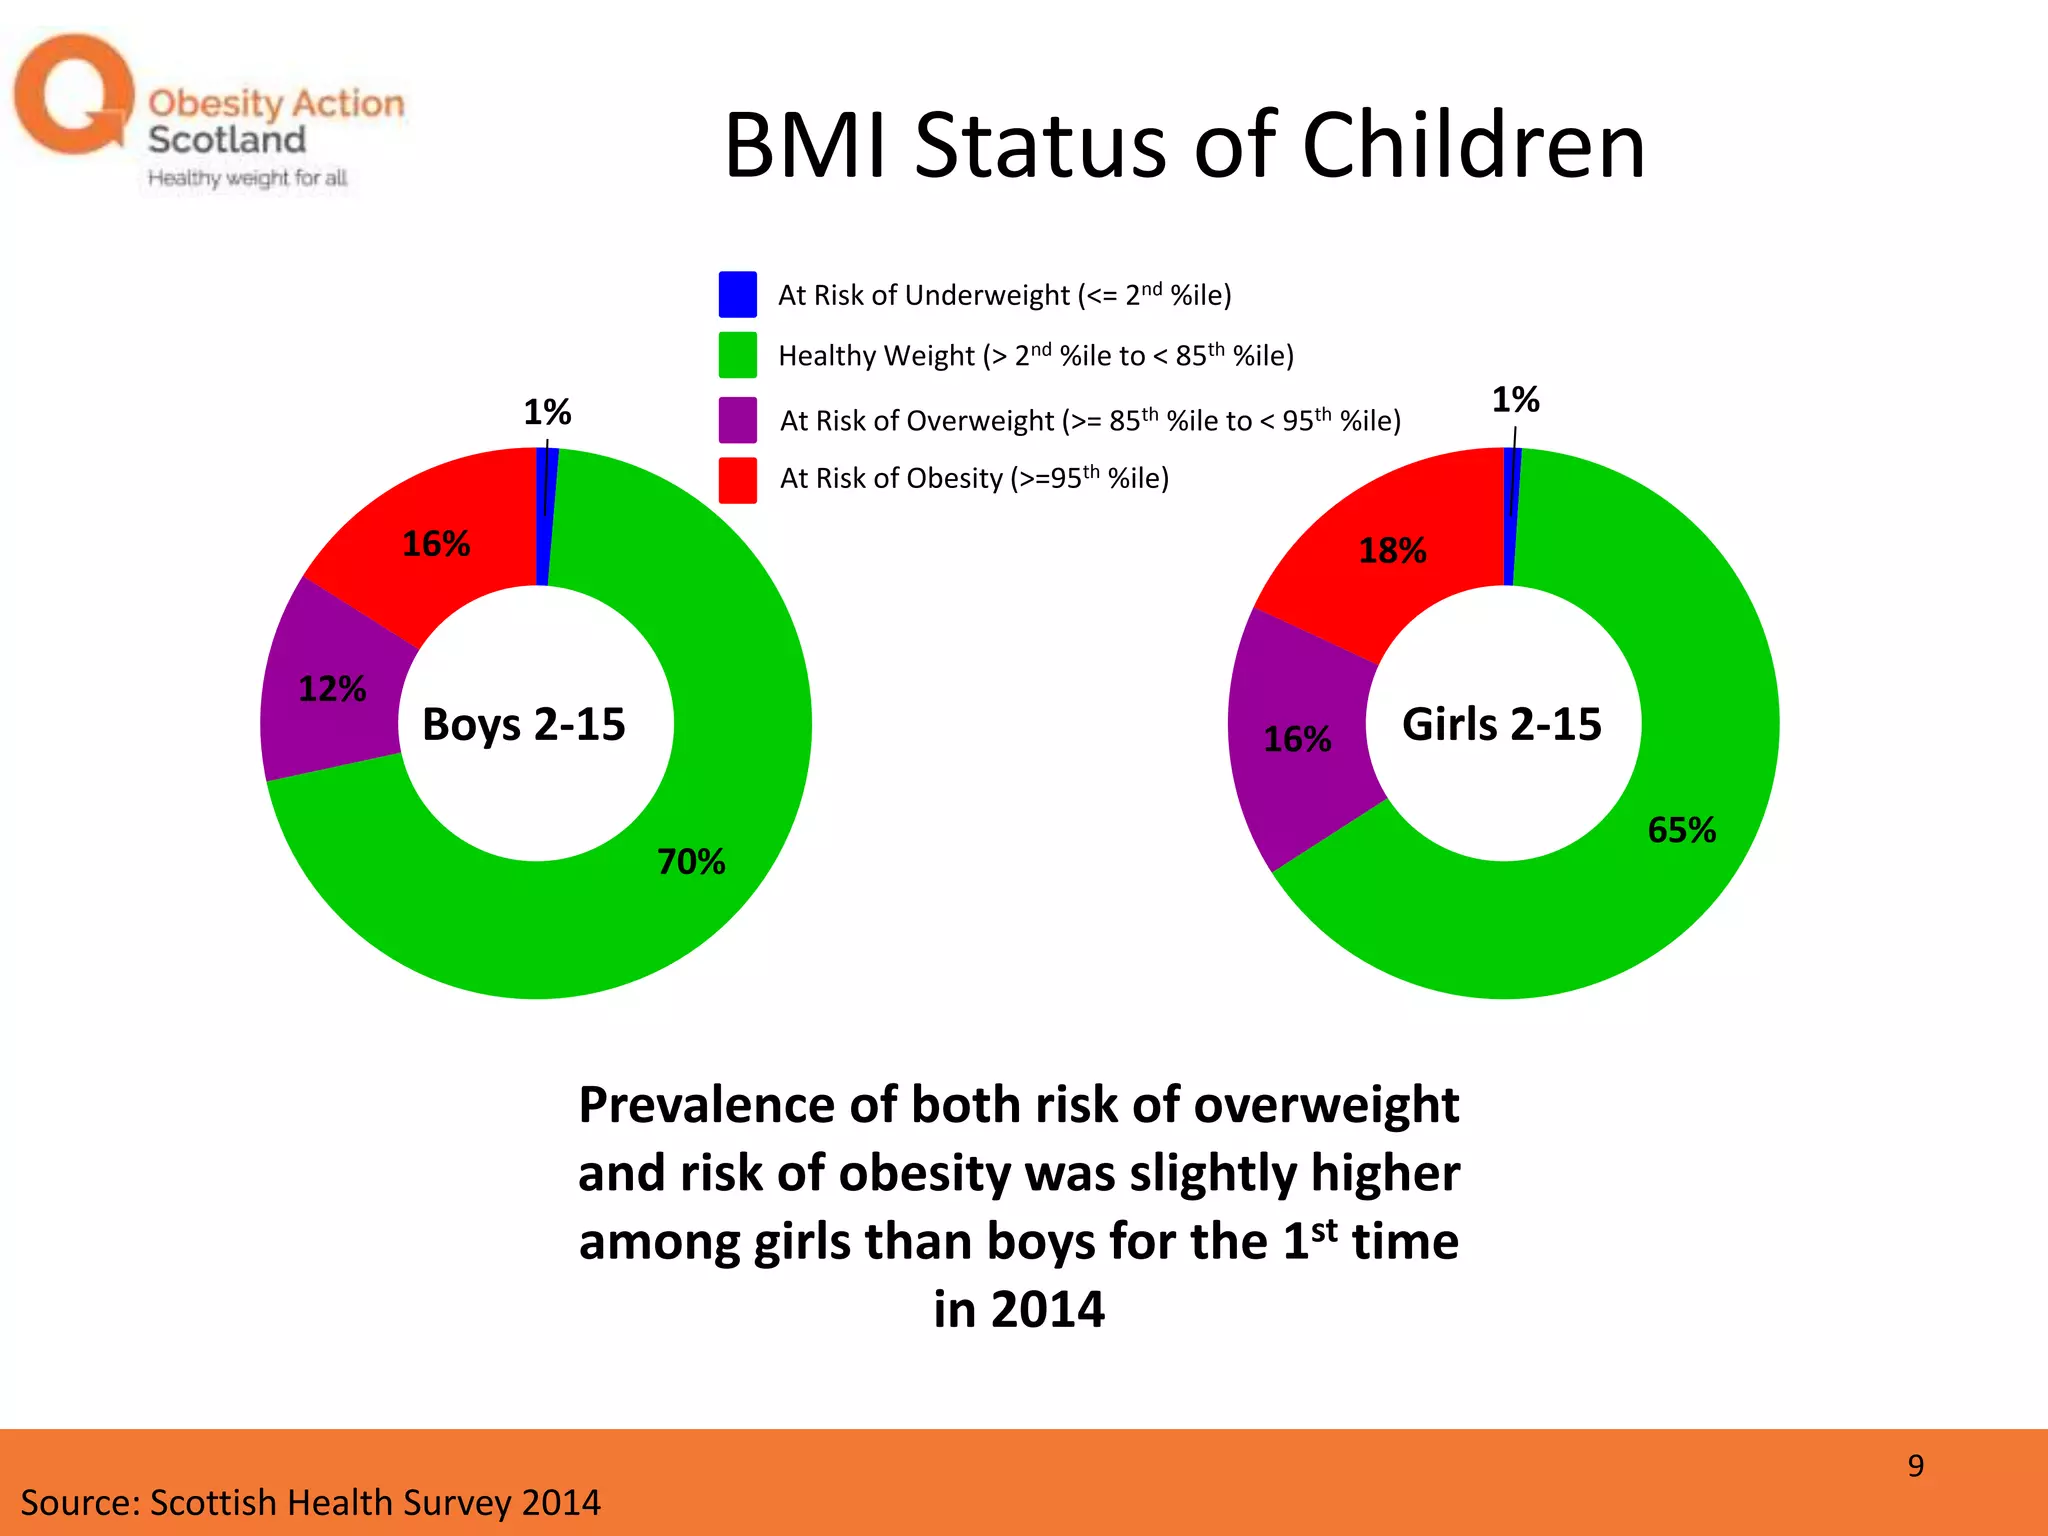
Childhood Obesity
in Scotland:
Patterns and
Trends
(2014 Data)
Overweight and Obesity Among
Children
More than 3 in 10 children aged
2-15 were at risk of overweight
and obesity (31%)
Source: Scottish Health Survey 2014
2
At Risk of Overweight & Obesity – BMI >= 85th %ile
Over ¼ of boys aged 2-15 were
at risk of overweight and
obesity (28%)
Over 1/3 of girls aged 2-15 were
at risk of overweight and
obesity (34%)
Overweight and Obesity Among
Children
Source: Scottish Health Survey 2014
3
At Risk of Overweight & Obesity – BMI >= 85th %ile
Overweight and Obesity Among
Children
Nearly 3 in 10 children aged
2-6 were at risk of
overweight and obesity
(27%)
Source: Scottish Health Survey 2014
3 in 10 children aged 7-11
were at risk of
overweight and obesity
(32%)
Nearly 4 in 10 children
aged 12-15 were at
risk of overweight and
obesity (37%)
4
At Risk of Overweight & Obesity – BMI >= 85th %ile
Nearly 2 in 10 children aged 2-15
were at risk of obesity (17%)
Obesity Among Children
Source: Scottish Health Survey 2014
5
At Risk of Obesity – BMI >= 95th %ile
Obesity Among Children
Source: Scottish Health Survey 2014
Nearly 2 in 10 boys aged 2-15
were at risk of obesity (16%)
Nearly 2 in 10 girls aged 2-15
were at risk of obesity (18%)
6
At Risk of Obesity – BMI >= 95th %ile
Obesity Among Children
Source: Scottish Health Survey 2014
Nearly 2 in 10
children aged 7-11
were at risk of
obesity (18%)
2 in 10 children aged
12-15 were at risk of
obesity (21%)
1 in 10 children
aged 2-6 were at
risk of obesity
(13%)
7
At Risk of Obesity – BMI >= 95th %ile
14% of children aged 2-15 were at risk
of overweight, with a further 17% at
risk of obesity
BMI Status of Children
Source: Scottish Health Survey 2014
1%
68%
14%
17%
All Children
8
At Risk of Underweight (<= 2nd %ile)
Healthy Weight (> 2nd %ile to < 85th %ile)
At Risk of Overweight (>= 85th %ile to < 95th %ile)
At Risk of Obesity (>=95th %ile)
Prevalence of both risk of overweight
and risk of obesity was slightly higher
among girls than boys for the 1st time
in 2014
BMI Status of Children
Source: Scottish Health Survey 2014
1%
70%
12%
16%
Boys 2-15
1%
65%
16%
18%
Girls 2-15
At Risk of Underweight (<= 2nd %ile)
Healthy Weight (> 2nd %ile to < 85th %ile)
At Risk of Overweight (>= 85th %ile to < 95th %ile)
At Risk of Obesity (>=95th %ile)
9
Prevalence of risk of
overweight and obesity
increases as children get
older
BMI Status of Children
Source: Scottish Health Survey 2014
1%
72%
14%
13%
Age 2-6
1%
68%
13%
18%
Age 7-11
2%
61%
16%
21%
Age 12-15
10
At Risk of Underweight (<= 2nd %ile)
Healthy Weight (> 2nd %ile to < 85th %ile)
At Risk of Overweight (>= 85th %ile to < 95th %ile)
At Risk of Obesity (>=95th %ile)
Trends in Prevalence of Overweight
and Obesity
Between 2008 and 2014, the overall percentage of children aged 2-15 at risk of
being overweight and obese fluctuated between 29% and 33%
Source: Scottish Health Survey 2014
0%
5%
10%
15%
20%
25%
30%
35%
40%
2003 2004 2005 2006 2007 2008 2009 2010 2011 2012 2013 2014
PercentageatRiskofOverweight&Obesity
Year
All Children 2-15
11
At Risk of Overweight & Obesity – BMI >= 85th %ile
Trends in Prevalence of Overweight
and Obesity
Until 2014, the prevalence of boys at risk of overweight and obesity was higher
than the prevalence of girls at risk
Source: Scottish Health Survey 2014
0%
5%
10%
15%
20%
25%
30%
35%
40%
2003 2004 2005 2006 2007 2008 2009 2010 2011 2012 2013 2014
PercentageatRiskofOverweight&Obesity
Year
Boys 2-15 Years
Girls 2-15 Years
12
At Risk of Overweight & Obesity – BMI >= 85th %ile
Trends in Prevalence of Obesity
The overall percentage of children aged 2-15 who are at risk of being obese
remained relatively steady between 2008 and 2014
Source: Scottish Health Survey 2014
0%
5%
10%
15%
20%
25%
30%
35%
40%
2003 2004 2005 2006 2007 2008 2009 2010 2011 2012 2013 2014
PercentageatRiskofObesity
Year
All Children 2-15
13
At Risk of Obesity – BMI >= 95th %ile
Trends in Prevalence of Obesity
Until 2014, the prevalence of boys at risk of obesity was higher than the
prevalence of girls at risk
Source: Scottish Health Survey 2014
0%
5%
10%
15%
20%
25%
30%
35%
40%
2003 2004 2005 2006 2007 2008 2009 2010 2011 2012 2013 2014
PercentageatRiskofObesity
Year
Boys 2-15
Girls 2-15
14
At Risk of Obesity – BMI >= 95th %ile
Child Obesity Prevalence by
Household Income
23% of children in the bottom quintile were at risk of obesity, compared to 12%
in the top quintile
Income Measure is Equivalised Household Income
Source: Scottish Health Survey 2014
15
0%
5%
10%
15%
20%
25%
30%
35%
Top Quintile ( > =
£49400)
4th Quintile ( > = £
31967 < £ 49400)
3rd Quintile ( > = £
22100 < £ 31967)
2nd Quintile ( > =
£14322 < £22100)
Bottom quintile ( > = £0
< £14322)
PercentageatRiskofObesity
Equivalised Income Quintile
At Risk of Obesity – BMI >= 95th %ile
Child Obesity Prevalence by
Household Income
19% of boys and 28% of girls in the bottom quintile were at risk of obesity,
compared to 11% of boys and 12% of girls in the top quintile
Income Measure is Equivalised Household Income
Source: Scottish Health Survey 2014
16
0%
5%
10%
15%
20%
25%
30%
35%
Top Quintile ( > =
£49400)
4th Quintile ( > = £
31967 < £ 49400)
3rd Quintile ( > = £
22100 < £ 31967)
2nd Quintile ( > =
£14322 < £22100)
Bottom quintile ( > =
£0 < £14322)
PercentageatRiskofObesity
Equivalised Income Quintile
Boys
Girls
At Risk of Obesity – BMI >= 95th %ile
Child Obesity Prevalence by Area
Deprivation
22% of children in the most deprived category were at risk of obesity,
compared to 13% in the least deprived
Source: Scottish Health Survey 2014
0%
5%
10%
15%
20%
25%
30%
35%
Least deprived 4 3 2 Most deprived
PercentageatRiskofObesity
SIMD Quintile
All Children
17
Area Deprivation Measure is Scottish Index of Multiple Deprivation 2012
At Risk of Obesity – BMI >= 95th %ile
Child Obesity Prevalence by Area
Deprivation
Almost 3 in 10 girls in the bottom quintile were at risk of obesity (29%),
compared to 15% in the top quintile
17% of boys in the bottom quintile were at risk of obesity, compared to 11% in
the top quintile
Area Deprivation Measure is Scottish Index of Multiple Deprivation 2012
Source: Scottish Health Survey 2014
0%
5%
10%
15%
20%
25%
30%
35%
Least deprived 4 3 2 Most deprived
PercentageatRiskofObesity
SIMD Quintile
Boys
Girls
18
At Risk of Obesity – BMI >= 95th %ile
Source:
The Scottish Government, (2015). The Scottish Health Survey 2014.
www.gov.scot/Publications/2015/09/6648
info@obesityactionscotland.org
info@obesityactionscotland.orgwww.obesityactionscotland.org
@obesityactionsc0141 221 6072
232-242 St. Vincent Street,
Glasgow,
G2 5RJ

Childhood Obesity in Scotland: Patterns and Trends

  • 1.
  • 2.
    Overweight and ObesityAmong Children More than 3 in 10 children aged 2-15 were at risk of overweight and obesity (31%) Source: Scottish Health Survey 2014 2 At Risk of Overweight & Obesity – BMI >= 85th %ile
  • 3.
    Over ¼ ofboys aged 2-15 were at risk of overweight and obesity (28%) Over 1/3 of girls aged 2-15 were at risk of overweight and obesity (34%) Overweight and Obesity Among Children Source: Scottish Health Survey 2014 3 At Risk of Overweight & Obesity – BMI >= 85th %ile
  • 4.
    Overweight and ObesityAmong Children Nearly 3 in 10 children aged 2-6 were at risk of overweight and obesity (27%) Source: Scottish Health Survey 2014 3 in 10 children aged 7-11 were at risk of overweight and obesity (32%) Nearly 4 in 10 children aged 12-15 were at risk of overweight and obesity (37%) 4 At Risk of Overweight & Obesity – BMI >= 85th %ile
  • 5.
    Nearly 2 in10 children aged 2-15 were at risk of obesity (17%) Obesity Among Children Source: Scottish Health Survey 2014 5 At Risk of Obesity – BMI >= 95th %ile
  • 6.
    Obesity Among Children Source:Scottish Health Survey 2014 Nearly 2 in 10 boys aged 2-15 were at risk of obesity (16%) Nearly 2 in 10 girls aged 2-15 were at risk of obesity (18%) 6 At Risk of Obesity – BMI >= 95th %ile
  • 7.
    Obesity Among Children Source:Scottish Health Survey 2014 Nearly 2 in 10 children aged 7-11 were at risk of obesity (18%) 2 in 10 children aged 12-15 were at risk of obesity (21%) 1 in 10 children aged 2-6 were at risk of obesity (13%) 7 At Risk of Obesity – BMI >= 95th %ile
  • 8.
    14% of childrenaged 2-15 were at risk of overweight, with a further 17% at risk of obesity BMI Status of Children Source: Scottish Health Survey 2014 1% 68% 14% 17% All Children 8 At Risk of Underweight (<= 2nd %ile) Healthy Weight (> 2nd %ile to < 85th %ile) At Risk of Overweight (>= 85th %ile to < 95th %ile) At Risk of Obesity (>=95th %ile)
  • 9.
    Prevalence of bothrisk of overweight and risk of obesity was slightly higher among girls than boys for the 1st time in 2014 BMI Status of Children Source: Scottish Health Survey 2014 1% 70% 12% 16% Boys 2-15 1% 65% 16% 18% Girls 2-15 At Risk of Underweight (<= 2nd %ile) Healthy Weight (> 2nd %ile to < 85th %ile) At Risk of Overweight (>= 85th %ile to < 95th %ile) At Risk of Obesity (>=95th %ile) 9
  • 10.
    Prevalence of riskof overweight and obesity increases as children get older BMI Status of Children Source: Scottish Health Survey 2014 1% 72% 14% 13% Age 2-6 1% 68% 13% 18% Age 7-11 2% 61% 16% 21% Age 12-15 10 At Risk of Underweight (<= 2nd %ile) Healthy Weight (> 2nd %ile to < 85th %ile) At Risk of Overweight (>= 85th %ile to < 95th %ile) At Risk of Obesity (>=95th %ile)
  • 11.
    Trends in Prevalenceof Overweight and Obesity Between 2008 and 2014, the overall percentage of children aged 2-15 at risk of being overweight and obese fluctuated between 29% and 33% Source: Scottish Health Survey 2014 0% 5% 10% 15% 20% 25% 30% 35% 40% 2003 2004 2005 2006 2007 2008 2009 2010 2011 2012 2013 2014 PercentageatRiskofOverweight&Obesity Year All Children 2-15 11 At Risk of Overweight & Obesity – BMI >= 85th %ile
  • 12.
    Trends in Prevalenceof Overweight and Obesity Until 2014, the prevalence of boys at risk of overweight and obesity was higher than the prevalence of girls at risk Source: Scottish Health Survey 2014 0% 5% 10% 15% 20% 25% 30% 35% 40% 2003 2004 2005 2006 2007 2008 2009 2010 2011 2012 2013 2014 PercentageatRiskofOverweight&Obesity Year Boys 2-15 Years Girls 2-15 Years 12 At Risk of Overweight & Obesity – BMI >= 85th %ile
  • 13.
    Trends in Prevalenceof Obesity The overall percentage of children aged 2-15 who are at risk of being obese remained relatively steady between 2008 and 2014 Source: Scottish Health Survey 2014 0% 5% 10% 15% 20% 25% 30% 35% 40% 2003 2004 2005 2006 2007 2008 2009 2010 2011 2012 2013 2014 PercentageatRiskofObesity Year All Children 2-15 13 At Risk of Obesity – BMI >= 95th %ile
  • 14.
    Trends in Prevalenceof Obesity Until 2014, the prevalence of boys at risk of obesity was higher than the prevalence of girls at risk Source: Scottish Health Survey 2014 0% 5% 10% 15% 20% 25% 30% 35% 40% 2003 2004 2005 2006 2007 2008 2009 2010 2011 2012 2013 2014 PercentageatRiskofObesity Year Boys 2-15 Girls 2-15 14 At Risk of Obesity – BMI >= 95th %ile
  • 15.
    Child Obesity Prevalenceby Household Income 23% of children in the bottom quintile were at risk of obesity, compared to 12% in the top quintile Income Measure is Equivalised Household Income Source: Scottish Health Survey 2014 15 0% 5% 10% 15% 20% 25% 30% 35% Top Quintile ( > = £49400) 4th Quintile ( > = £ 31967 < £ 49400) 3rd Quintile ( > = £ 22100 < £ 31967) 2nd Quintile ( > = £14322 < £22100) Bottom quintile ( > = £0 < £14322) PercentageatRiskofObesity Equivalised Income Quintile At Risk of Obesity – BMI >= 95th %ile
  • 16.
    Child Obesity Prevalenceby Household Income 19% of boys and 28% of girls in the bottom quintile were at risk of obesity, compared to 11% of boys and 12% of girls in the top quintile Income Measure is Equivalised Household Income Source: Scottish Health Survey 2014 16 0% 5% 10% 15% 20% 25% 30% 35% Top Quintile ( > = £49400) 4th Quintile ( > = £ 31967 < £ 49400) 3rd Quintile ( > = £ 22100 < £ 31967) 2nd Quintile ( > = £14322 < £22100) Bottom quintile ( > = £0 < £14322) PercentageatRiskofObesity Equivalised Income Quintile Boys Girls At Risk of Obesity – BMI >= 95th %ile
  • 17.
    Child Obesity Prevalenceby Area Deprivation 22% of children in the most deprived category were at risk of obesity, compared to 13% in the least deprived Source: Scottish Health Survey 2014 0% 5% 10% 15% 20% 25% 30% 35% Least deprived 4 3 2 Most deprived PercentageatRiskofObesity SIMD Quintile All Children 17 Area Deprivation Measure is Scottish Index of Multiple Deprivation 2012 At Risk of Obesity – BMI >= 95th %ile
  • 18.
    Child Obesity Prevalenceby Area Deprivation Almost 3 in 10 girls in the bottom quintile were at risk of obesity (29%), compared to 15% in the top quintile 17% of boys in the bottom quintile were at risk of obesity, compared to 11% in the top quintile Area Deprivation Measure is Scottish Index of Multiple Deprivation 2012 Source: Scottish Health Survey 2014 0% 5% 10% 15% 20% 25% 30% 35% Least deprived 4 3 2 Most deprived PercentageatRiskofObesity SIMD Quintile Boys Girls 18 At Risk of Obesity – BMI >= 95th %ile
  • 19.
    Source: The Scottish Government,(2015). The Scottish Health Survey 2014. www.gov.scot/Publications/2015/09/6648 info@obesityactionscotland.org
  • 20.