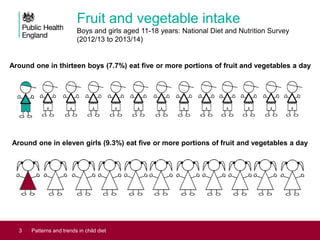
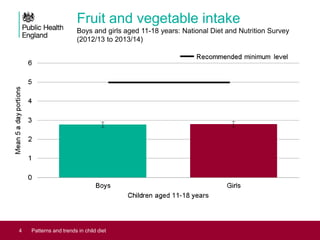
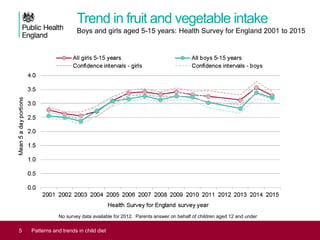
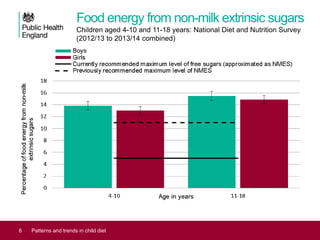
Patterns and trends in
child diet
A presentation of data on child diet
Updated September 2017
Introduction
These slides summarise the latest data from government surveys on
children’s diet and nutritional intake. They are designed as a useful
resource for policy makers, practitioners and anyone with an interest in
diet and nutrition.
A short explanation of each slide is included in the slide notes.
The charts provided illustrate population averages. However, dietary
intakes can vary considerably across the population and within socio-
demographic groups.
2 Patterns and trends in child diet
Fruit and vegetable intake
Boys and girls aged 11-18 years: National Diet and Nutrition Survey
(2012/13 to 2013/14)
3 Patterns and trends in child diet
Around one in thirteen boys (7.7%) eat five or more portions of fruit and vegetables a day
Around one in eleven girls (9.3%) eat five or more portions of fruit and vegetables a day
Fruit and vegetable intake
Boys and girls aged 11-18 years: National Diet and Nutrition Survey
(2012/13 to 2013/14)
4 Patterns and trends in child diet
Trend in fruit and vegetable intake
Boys and girls aged 5-15 years: Health Survey for England 2001 to 2015
5 Patterns and trends in child diet
No survey data available for 2012. Parents answer on behalf of children aged 12 and under
Food energy from non-milk extrinsic sugars
Children aged 4-10 and 11-18 years: National Diet and Nutrition Survey
(2012/13 to 2013/14 combined)
6 Patterns and trends in child diet
Food energy from fat
Children aged 4-10 and 11-18 years: National Diet and Nutrition Survey
(2012/13 to 2013/14)
7 Patterns and trends in child diet
Food energy from saturated fat
Children aged 4-10 and 11-18 years: National Diet and Nutrition Survey
(2012/13 to 2013/14)
8 Patterns and trends in child diet
Estimated daily salt intake
Children aged 4-6, 7-10 and 11-18 years: National Diet and Nutrition
Survey (2008/09 to 2011/12)
9 Patterns and trends in child diet
Data not available for NDNS Years 5 & 6 (2012/13 to 2013/14)
Consumption of oily fish
Children aged 4-10 and 11-18 years: National Diet and Nutrition Survey
(2012/13 to 2013/14)
10 Patterns and trends in child diet
Survey data sources
11 Patterns and trends in child diet
Health Survey for England (HSE)
content.digital.nhs.uk/healthsurveyengland
National Diet and Nutrition Survey (NDNS)
www.gov.uk/government/statistics/ndns-results-from-years-5-and-6-
combined
www.gov.uk/government/statistics/national-diet-and-nutrition-survey-
results-from-years-1-to-4-combined-of-the-rolling-programme-for-2008-
and-2009-to-2011-and-2012
12
About Public Health England
Public Health England exists to protect and improve the nation’s health and wellbeing, and reduce health inequalities. We
do this through world-class science, knowledge
and intelligence, advocacy, partnerships and the delivery of specialist public health services. We are an executive agency
of the Department of Health, and are a distinct delivery organisation with operational autonomy to advise and support
government, local authorities and the NHS in a professionally independent manner.
Public Health England
Wellington House
133-155 Waterloo Road
London SE1 8UG
Tel: 020 7654 8000
www.gov.uk/phe
Twitter: @PHE_uk
Facebook: www.facebook.com/PublicHealthEngland
© Crown copyright 2017
You may re-use this information (excluding logos) free of charge in any format or medium, under the terms of the Open
Government Licence v3.0. To view this licence, visit www.nationalarchives.gov.uk/doc/open-government-licence/version/3/
or email psi@nationalarchives.gsi.gov.uk. Where we have identified any third party copyright information you will need to
obtain permission from the copyright holders concerned.
Published September 2017
PHE publications gateway number: 2017400
Patterns and trends in child diet

Patterns and trends in child diet

  • 1.
    Patterns and trendsin child diet A presentation of data on child diet Updated September 2017
  • 2.
    Introduction These slides summarisethe latest data from government surveys on children’s diet and nutritional intake. They are designed as a useful resource for policy makers, practitioners and anyone with an interest in diet and nutrition. A short explanation of each slide is included in the slide notes. The charts provided illustrate population averages. However, dietary intakes can vary considerably across the population and within socio- demographic groups. 2 Patterns and trends in child diet
  • 3.
    Fruit and vegetableintake Boys and girls aged 11-18 years: National Diet and Nutrition Survey (2012/13 to 2013/14) 3 Patterns and trends in child diet Around one in thirteen boys (7.7%) eat five or more portions of fruit and vegetables a day Around one in eleven girls (9.3%) eat five or more portions of fruit and vegetables a day
  • 4.
    Fruit and vegetableintake Boys and girls aged 11-18 years: National Diet and Nutrition Survey (2012/13 to 2013/14) 4 Patterns and trends in child diet
  • 5.
    Trend in fruitand vegetable intake Boys and girls aged 5-15 years: Health Survey for England 2001 to 2015 5 Patterns and trends in child diet No survey data available for 2012. Parents answer on behalf of children aged 12 and under
  • 6.
    Food energy fromnon-milk extrinsic sugars Children aged 4-10 and 11-18 years: National Diet and Nutrition Survey (2012/13 to 2013/14 combined) 6 Patterns and trends in child diet
  • 7.
    Food energy fromfat Children aged 4-10 and 11-18 years: National Diet and Nutrition Survey (2012/13 to 2013/14) 7 Patterns and trends in child diet
  • 8.
    Food energy fromsaturated fat Children aged 4-10 and 11-18 years: National Diet and Nutrition Survey (2012/13 to 2013/14) 8 Patterns and trends in child diet
  • 9.
    Estimated daily saltintake Children aged 4-6, 7-10 and 11-18 years: National Diet and Nutrition Survey (2008/09 to 2011/12) 9 Patterns and trends in child diet Data not available for NDNS Years 5 & 6 (2012/13 to 2013/14)
  • 10.
    Consumption of oilyfish Children aged 4-10 and 11-18 years: National Diet and Nutrition Survey (2012/13 to 2013/14) 10 Patterns and trends in child diet
  • 11.
    Survey data sources 11Patterns and trends in child diet Health Survey for England (HSE) content.digital.nhs.uk/healthsurveyengland National Diet and Nutrition Survey (NDNS) www.gov.uk/government/statistics/ndns-results-from-years-5-and-6- combined www.gov.uk/government/statistics/national-diet-and-nutrition-survey- results-from-years-1-to-4-combined-of-the-rolling-programme-for-2008- and-2009-to-2011-and-2012
  • 12.
    12 About Public HealthEngland Public Health England exists to protect and improve the nation’s health and wellbeing, and reduce health inequalities. We do this through world-class science, knowledge and intelligence, advocacy, partnerships and the delivery of specialist public health services. We are an executive agency of the Department of Health, and are a distinct delivery organisation with operational autonomy to advise and support government, local authorities and the NHS in a professionally independent manner. Public Health England Wellington House 133-155 Waterloo Road London SE1 8UG Tel: 020 7654 8000 www.gov.uk/phe Twitter: @PHE_uk Facebook: www.facebook.com/PublicHealthEngland © Crown copyright 2017 You may re-use this information (excluding logos) free of charge in any format or medium, under the terms of the Open Government Licence v3.0. To view this licence, visit www.nationalarchives.gov.uk/doc/open-government-licence/version/3/ or email psi@nationalarchives.gsi.gov.uk. Where we have identified any third party copyright information you will need to obtain permission from the copyright holders concerned. Published September 2017 PHE publications gateway number: 2017400 Patterns and trends in child diet

Editor's Notes

  • #2 These PowerPoint slides present key data and information on child diet in clear, easy to understand charts and graphics. They have been produced by the Risk Factors Intelligence Team and can be used freely with acknowledgement to ‘Public Health England’.
  • #4 It is recommended that children eat at least five portions of a variety of fruit and vegetables per day. For children aged 11 years and over one portion is considered to be 80g (see www.nhs.uk/Livewell/5ADAY/Pages/Portionsizes.aspx for more information). There is insufficient evidence to determine portion sizes for younger children. Note: because of a change in definition these figures should not be compared with previously published slides relating to earlier periods of the NDNS
  • #5 Both boys and girls aged 11–18 years consumed an average of 2.8 portions of fruit and vegetables in 2012/13-2013/14, significantly less than the minimum recommended level. Note: because of a change in definition these figures should not be compared with previously published slides relating to earlier periods of the NDNS
  • #6 Between 2001 and 2015 the average number of portions of fruit and vegetables consumed by children aged 5-15 was significantly below five but has increased since the early 2000s. There were no notable differences between boys and girls over this time period.
  • #7 In July 2015 the UK government adopted new advice which recommends that the average intake of “free sugars” should not exceed 5% of total dietary energy. (Source: Scientific Advisory Committee on Nutrition. Carbohydrates and Health. London: TSO: 2015). Free sugars are those added to food or those naturally present in honey, syrups and unsweetened fruit juices, but exclude lactose in milk and milk products. In the latest NDNS survey results the closest available data to free sugars are non-milk extrinsic sugars (NMES). In future NDNS reports recorded NMEs intakes will be replaced with recorded intake of free sugars. Average intake of NMES for boys and girls of all ages currently exceeds 12% and is considerably above the new 5% recommendation.
  • #8 For children aged five years and over, it is recommended that no more than 35% of food energy should be from total fat. Sources: Committee on Medical Aspects of Food Policy. Dietary Reference Values for Food Energy and Nutrients for the United Kingdom. London TSO: 1991 Committee on Medical Aspects of Food Policy. Nutritional Aspects of Cardiovascular Disease. London HMSO: 1994 On average child consumption of percentage food energy from fat is just below the recommended maximum level for boys and girls of all ages.
  • #9 It is recommended that no more than 11% of total food energy should come from saturated fat for children aged five years and over. Sources: Committee on Medical Aspects of Food Policy. Dietary Reference Values for Food Energy and Nutrients for the United Kingdom. London TSO: 1991 Committee on Medical Aspects of Food Policy. Nutritional Aspects of Cardiovascular Disease. London HMSO: 1994 The average intake of saturated fat for both boys and girls of all ages currently exceeds the recommended maximum level.
  • #10 The recommended maximum salt intake for children aged 4-6 years is 3 grams per day (g/day), children aged 7-10 years: 5g/day and children aged 11-18 years: 6g/day. Source: Scientific Advisory Committee on Nutrition (2003). Salt and Health. The Stationery Office The latest available data suggests that average salt levels exceed the recommended maximum in all age groups. 7-10 year olds are the only group where average intake was near to the recommended maximum. This data is based on a survey that measured urinary sodium rather than reported intake. This is no longer collected as part of the rolling programme for children but will be collected on an ad hoc basis as part of future survey years.
  • #11 As part of The Eatwell Guide there are specific portion sizes for certain foods including fish for adults. However, there are no exact food portion sizes for children and young people. It is advised that children aged 5 years and over follow the government’s national food guidelines that are illustrated through The Eatwell Guide. In following this guide a pragmatic approach to portion sizes is advised, as the amount of food a child needs varies with age, body size and levels of physical activity. Consumption of oily fish falls well below the recommended minimums for both boys and girls of all ages. Source: Scientific Advisory Committee on Nutrition 2004 ‘Advice on fish consumption – benefits and risks’