This document discusses resource markets and how demand and supply determine resource prices and allocation. It makes the following key points:
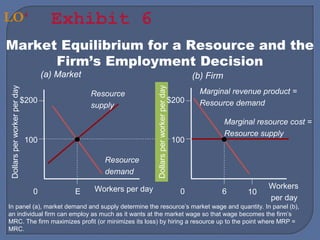
1) Firms demand resources as long as the marginal revenue of an additional unit exceeds the marginal cost, and households supply resources to the highest paying use. This interaction between firm demand and household supply determines the market price and quantity of resources.
2) The demand for a resource is a derived demand, arising from the demand for the final good that the resource helps produce. The market demand is the sum of demands across all uses.
3) Resources tend to flow to their highest valued uses, with adjustments across uses until the price is equal. However, some price differences persist due to lack


![Lesson 9--production[1]](https://cdn.slidesharecdn.com/ss_thumbnails/lesson-9-production1-130409195935-phpapp02-thumbnail.jpg?width=640&height=640&fit=bounds)


