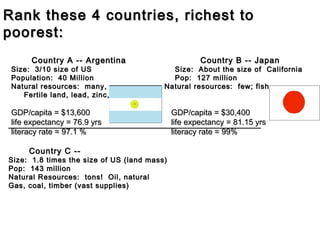
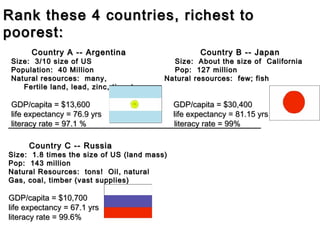
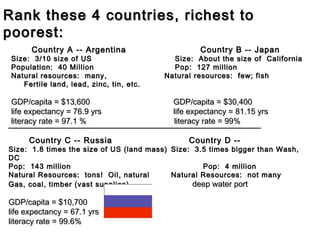
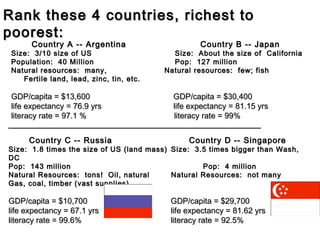
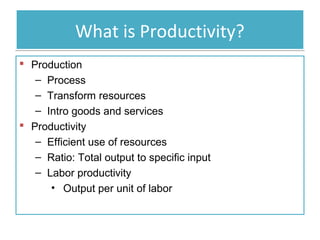
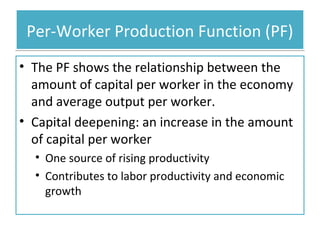
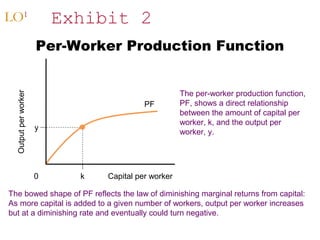
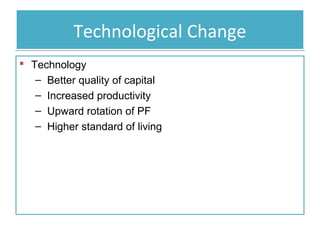
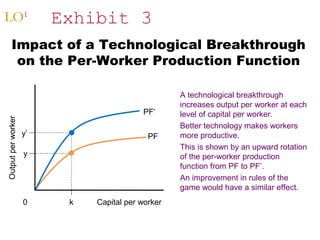
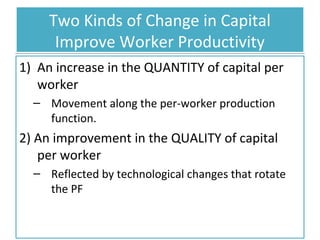
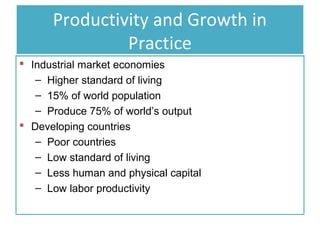
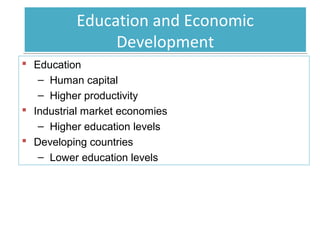
Chapter 8
Productivity and Growth
Growth and the PPF
• What is the PPF again?
– Why is it importance?
Rank these 4 countries, richest to
poorest:
Country A --

Size: 3/10 size of US
Population: 40 Million
Natural resources: many,
Fertile land, lead, zinc, tin, etc.

_________________________________________________________
Rank these 4 countries, richest to
poorest:
Country A --

Size: 3/10 size of US
Population: 40 Million
Natural resources: many,
Fertile land, lead, zinc, tin, etc.

Country B --

Size: About the size of California
Pop: 127 million
Natural resources: few; fish

_________________________________________________________
Country C --

Size: 1.8 times the size of US (land mass)
Pop: 143 million
Natural Resources: tons! Oil, natural
Gas, coal, timber (vast supplies)
Rank these 4 countries, richest to
poorest:
Country A --

Size: 3/10 size of US
Population: 40 Million
Natural resources: many,
Fertile land, lead, zinc, tin, etc.

Country B --

Size: About the size of California
Pop: 127 million +
Natural resources: few; fish

_________________________________________________________
Country C --

Country D --

Size: 1.8 times the size of US (land mass) Size: 3.5 times bigger than Wash,
DC
Pop: 143 million
Pop: 4 million
Natural Resources: tons! Oil, natural
Natural Resources: not many, fish,
Gas, coal, timber (vast supplies)
deep water port

Results:
Rank these 4 countries, richest to
poorest:
Country A --

Size: 3/10 size of US
Population: 40 Million
Natural resources: many,
Fertile land, lead, zinc, tin, etc.
Rank these 4 countries, richest to
poorest:
Country A -- Argentina

Size: 3/10 size of US
Population: 40 Million
Natural resources: many,
Fertile land, lead, zinc, tin, etc.

GDP/capita = $13,600
life expectancy = 76.9 yrs
literacy rate = 97.1 %
Rank these 4 countries, richest to
poorest:
Country A -- Argentina

Size: 3/10 size of US
Population: 40 Million
Natural resources: many,
Fertile land, lead, zinc, tin, etc.

GDP/capita = $13,600
life expectancy = 76.9 yrs
literacy rate = 97.1 %

Country B --

Size: About the size of California
Pop: 127 million
Natural resources: few; fish
Rank these 4 countries, richest to
poorest:
Country A -- Argentina

Size: 3/10 size of US
Population: 40 Million
Natural resources: many,
Fertile land, lead, zinc, tin, etc.

GDP/capita = $13,600
life expectancy = 76.9 yrs
literacy rate = 97.1 %

Country B -- Japan

Size: About the size of California
Pop: 127 million
Natural resources: few; fish

GDP/capita = $30,400
life expectancy = 81.15 yrs
literacy rate = 99%
Rank these 4 countries, richest to
poorest:
Country A -- Argentina

Size: 3/10 size of US
Population: 40 Million
Natural resources: many,
Fertile land, lead, zinc, tin, etc.

Country B -- Japan

Size: About the size of California
Pop: 127 million
Natural resources: few; fish

GDP/capita = $13,600
GDP/capita = $30,400
life expectancy = 76.9 yrs
life expectancy = 81.15 yrs
_________________________________________________________
literacy rate = 97.1 %
literacy rate = 99%
Country C --

Size: 1.8 times the size of US (land mass)
Pop: 143 million
Natural Resources: tons! Oil, natural
Gas, coal, timber (vast supplies)
Rank these 4 countries, richest to
poorest:
Country A -- Argentina

Size: 3/10 size of US
Population: 40 Million
Natural resources: many,
Fertile land, lead, zinc, tin, etc.

Country B -- Japan

Size: About the size of California
Pop: 127 million
Natural resources: few; fish

GDP/capita = $13,600
GDP/capita = $30,400
life expectancy = 76.9 yrs
life expectancy = 81.15 yrs
literacy rate = 97.1 %
literacy rate = 99%
_________________________________________________________
Country C -- Russia

Size: 1.8 times the size of US (land mass)
Pop: 143 million
Natural Resources: tons! Oil, natural
Gas, coal, timber (vast supplies)

GDP/capita = $10,700
life expectancy = 67.1 yrs
literacy rate = 99.6%
Rank these 4 countries, richest to
poorest:
Country A -- Argentina

Size: 3/10 size of US
Population: 40 Million
Natural resources: many,
Fertile land, lead, zinc, tin, etc.

Country B -- Japan

Size: About the size of California
Pop: 127 million
Natural resources: few; fish

GDP/capita = $13,600
GDP/capita = $30,400
life expectancy = 76.9 yrs
life expectancy = 81.15 yrs
literacy rate = 97.1 %
literacy rate = 99%
_________________________________________________________
Country C -- Russia

Country D --

Size: 1.8 times the size of US (land mass) Size: 3.5 times bigger than Wash,
DC
Pop: 143 million
Pop: 4 million
Natural Resources: tons! Oil, natural
Natural Resources: not many
Gas, coal, timber (vast supplies)
deep water port

GDP/capita = $10,700
life expectancy = 67.1 yrs
literacy rate = 99.6%
Rank these 4 countries, richest to
poorest:
Country A -- Argentina

Size: 3/10 size of US
Population: 40 Million
Natural resources: many,
Fertile land, lead, zinc, tin, etc.

Country B -- Japan

Size: About the size of California
Pop: 127 million
Natural resources: few; fish

GDP/capita = $13,600
GDP/capita = $30,400
life expectancy = 76.9 yrs
life expectancy = 81.15 yrs
literacy rate = 97.1 %
literacy rate = 99%
_________________________________________________________
Country C -- Russia

Country D -- Singapore

Size: 1.8 times the size of US (land mass) Size: 3.5 times bigger than Wash,
DC
Pop: 143 million
Pop: 4 million
Natural Resources: tons! Oil, natural
Natural Resources: not many
Gas, coal, timber (vast supplies)

GDP/capita = $10,700
life expectancy = 67.1 yrs
literacy rate = 99.6%

GDP/capita = $29,700
life expectancy = 81.62 yrs
literacy rate = 92.5%
Bonus Nation
• Size: Twice the size of CA
• Population: very large, 130 million +
• Natural Resources: vast: oil, tin, iron ore, coal,
limestone, lead, zinc, natural gas
Bonus Nation
• Size: Twice the size of CA
• Population: very large, 130 million +
• Natural Resources: vast: oil, tin, iron ore, coal, limestone,
lead, zinc, natural gas
Nigeria:

• Per capital GDP: $1,400 2005
• Life Expectancy: 47.08 yrs
• Infant Mortality: 97.14 / 1000
What is Productivity?
 Production
– Process
– Transform resources
– Intro goods and services
 Productivity
– Efficient use of resources
– Ratio: Total output to specific input
– Labor productivity
• Output per unit of labor
Labor Productivity
• Why is this important?
• When does it increase?
• With human and physical capital
Per-Worker Production Function (PF)
• The PF shows the relationship between the
amount of capital per worker in the economy
and average output per worker.
• Capital deepening: an increase in the amount
of capital per worker
• One source of rising productivity
• Contributes to labor productivity and economic
growth
Exhibit 2

LO1

Output per worker

Per-Worker Production Function

PF
y

0

k

The per-worker production function,
PF, shows a direct relationship
between the amount of capital per
worker, k, and the output per
worker, y.

Capital per worker

The bowed shape of PF reflects the law of diminishing marginal returns from capital:
As more capital is added to a given number of workers, output per worker increases
but at a diminishing rate and eventually could turn negative.
Technological Change
 Technology
– Better quality of capital
– Increased productivity
– Upward rotation of PF
– Higher standard of living
LO1

Exhibit 3

Output per worker

Impact of a Technological Breakthrough
on the Per-Worker Production Function

PF’
y’

PF

y

0

k

Capital per worker

A technological breakthrough
increases output per worker at each
level of capital per worker.
Better technology makes workers
more productive.
This is shown by an upward rotation
of the per-worker production
function from PF to PF’.
An improvement in rules of the
game would have a similar effect.
Two Kinds of Change in Capital
Improve Worker Productivity
1) An increase in the QUANTITY of capital per
worker
– Movement along the per-worker production
function.

2) An improvement in the QUALITY of capital
per worker
– Reflected by technological changes that rotate
the PF
Rules of the Game
• The formal and informal institutions that
promote economic activities: laws, customs,
manners, etc.
• Stable political environment
• Well-define property rights
Freedom Index

http://www.fraserinstitute.org/research-news/displa
How do countries rate?
Does it make a difference in their Economic
Growth?
http://www.cato.org/pubs/efw/map/index.php
Productivity and Growth in
Practice
 Industrial market economies
– Higher standard of living
– 15% of world population
– Produce 75% of world’s output
 Developing countries
– Poor countries
– Low standard of living
– Less human and physical capital
– Low labor productivity
Education and Economic
Development
 Education
– Human capital
– Higher productivity
 Industrial market economies
– Higher education levels
 Developing countries
– Lower education levels
LO2

Exhibit 4

Percent of Adult Population with at Least a
College Education: 2003 and 2006
U.S. Labor Productivity
 Annual productivity growth
• 2.1% per year, since 1870 (by 1,680%)
• Over long periods
– Small differences in productivity
» Huge differences in standard of living

 1948-1973: Golden days; 2.9% per year
 1974-1982 Slowdown to 1%
– Oil pieces
– Legislation
 1983: rebound
– Information revolution
Exhibit 5

LO2

Long-Term Trend in U.S. Labor Productivity Growth: Annual
Average by Decade
LO2

Exhibit 6

U.S. Labor
Productivity
Growth
Slowed
During
1974-1982
and Then
Rebounded
The growth in labor productivity declined from 2.9% per year between 1948 and 1973 to only
1.0% between 1974 and 1982. A jump in the price of oil contributed to three recessions during
that stretch, and new environmental and workplace regulations, though necessary and beneficial,
slowed down productivity growth temporarily. The information revolution powered by the
computer chip and the Internet has boosted productivity in recent years.
How did computers boost
productivity?
1) Efficiency gains in the production of
computers and semiconductors
2) Greater computer use by industry
Output per Capita
 Standard of living
– Output per capita
– Real GDP per capita
 U.S.
– General upward trend
– During recessions
• Decrease in productivity
International Comparisons

https://www.cia.gov/library/publications/the-worldCompare Angola with the United States. What
is Angola’s GDP per capita, what about the
U.S.? Now what is their infant morality rates?
(meaning how many babies live to see their
first birthday).
Is their a quality of life difference?
Quality-of-Life Measures of
Development
• The GDP measures market transaction, it does
not measure differences in living standards.
– Demography
•
•
•
•

Life expectancy at birth
Infant mortality rate
Illiteracy rate
Per capita energy consumption

– Economic Freedom
• Freedom Index
Technological change
• Technological change
• Job dislocations can be created- displaced workers
• More affordable products, boosting both
production and employment

• “Does technological change lead to
unemployment?”
• NO statistical evidence of this.
Research & Development
 Basic research
 General search for knowledge
 First step for technological advancement
 Yields a higher return
to society
 Applied research
 Answer particular questions
 Develop specific products
Exhibit 10

LO

3

R&D Spending as a Percentage of GDP for Major
Economies during the 1980s, 1990s, and 2006
Industrial Policy
• Industrial policy
• The idea that government, using taxes, subsidies,
regulations, and coordination of private sector
could help nurture industries.

• Concerns
• Government efficiency
• Giveaway programs
Do Economies Converge?
• Convergence theory
• Developing countries- they can grow faster than
advanced economies
• Why?
• Adopt existing technologies
• Invest in human resources

• But, is it happening???

Chapter8-Macro

  • 1.
  • 2.
    Growth and thePPF • What is the PPF again? – Why is it importance?
  • 3.
    Rank these 4countries, richest to poorest: Country A -- Size: 3/10 size of US Population: 40 Million Natural resources: many, Fertile land, lead, zinc, tin, etc. _________________________________________________________
  • 4.
    Rank these 4countries, richest to poorest: Country A -- Size: 3/10 size of US Population: 40 Million Natural resources: many, Fertile land, lead, zinc, tin, etc. Country B -- Size: About the size of California Pop: 127 million Natural resources: few; fish _________________________________________________________
  • 5.
    Rank these 4countries, richest to poorest: Country A -- Size: 3/10 size of US Population: 40 Million Natural resources: many, Fertile land, lead, zinc, tin, etc. Country B -- Size: About the size of California Pop: 127 million Natural resources: few; fish _________________________________________________________ Country C -- Size: 1.8 times the size of US (land mass) Pop: 143 million Natural Resources: tons! Oil, natural Gas, coal, timber (vast supplies)
  • 6.
    Rank these 4countries, richest to poorest: Country A -- Size: 3/10 size of US Population: 40 Million Natural resources: many, Fertile land, lead, zinc, tin, etc. Country B -- Size: About the size of California Pop: 127 million + Natural resources: few; fish _________________________________________________________ Country C -- Country D -- Size: 1.8 times the size of US (land mass) Size: 3.5 times bigger than Wash, DC Pop: 143 million Pop: 4 million Natural Resources: tons! Oil, natural Natural Resources: not many, fish, Gas, coal, timber (vast supplies) deep water port Results:
  • 7.
    Rank these 4countries, richest to poorest: Country A -- Size: 3/10 size of US Population: 40 Million Natural resources: many, Fertile land, lead, zinc, tin, etc.
  • 8.
    Rank these 4countries, richest to poorest: Country A -- Argentina Size: 3/10 size of US Population: 40 Million Natural resources: many, Fertile land, lead, zinc, tin, etc. GDP/capita = $13,600 life expectancy = 76.9 yrs literacy rate = 97.1 %
  • 9.
    Rank these 4countries, richest to poorest: Country A -- Argentina Size: 3/10 size of US Population: 40 Million Natural resources: many, Fertile land, lead, zinc, tin, etc. GDP/capita = $13,600 life expectancy = 76.9 yrs literacy rate = 97.1 % Country B -- Size: About the size of California Pop: 127 million Natural resources: few; fish
  • 10.
    Rank these 4countries, richest to poorest: Country A -- Argentina Size: 3/10 size of US Population: 40 Million Natural resources: many, Fertile land, lead, zinc, tin, etc. GDP/capita = $13,600 life expectancy = 76.9 yrs literacy rate = 97.1 % Country B -- Japan Size: About the size of California Pop: 127 million Natural resources: few; fish GDP/capita = $30,400 life expectancy = 81.15 yrs literacy rate = 99%
  • 11.
    Rank these 4countries, richest to poorest: Country A -- Argentina Size: 3/10 size of US Population: 40 Million Natural resources: many, Fertile land, lead, zinc, tin, etc. Country B -- Japan Size: About the size of California Pop: 127 million Natural resources: few; fish GDP/capita = $13,600 GDP/capita = $30,400 life expectancy = 76.9 yrs life expectancy = 81.15 yrs _________________________________________________________ literacy rate = 97.1 % literacy rate = 99% Country C -- Size: 1.8 times the size of US (land mass) Pop: 143 million Natural Resources: tons! Oil, natural Gas, coal, timber (vast supplies)
  • 12.
    Rank these 4countries, richest to poorest: Country A -- Argentina Size: 3/10 size of US Population: 40 Million Natural resources: many, Fertile land, lead, zinc, tin, etc. Country B -- Japan Size: About the size of California Pop: 127 million Natural resources: few; fish GDP/capita = $13,600 GDP/capita = $30,400 life expectancy = 76.9 yrs life expectancy = 81.15 yrs literacy rate = 97.1 % literacy rate = 99% _________________________________________________________ Country C -- Russia Size: 1.8 times the size of US (land mass) Pop: 143 million Natural Resources: tons! Oil, natural Gas, coal, timber (vast supplies) GDP/capita = $10,700 life expectancy = 67.1 yrs literacy rate = 99.6%
  • 13.
    Rank these 4countries, richest to poorest: Country A -- Argentina Size: 3/10 size of US Population: 40 Million Natural resources: many, Fertile land, lead, zinc, tin, etc. Country B -- Japan Size: About the size of California Pop: 127 million Natural resources: few; fish GDP/capita = $13,600 GDP/capita = $30,400 life expectancy = 76.9 yrs life expectancy = 81.15 yrs literacy rate = 97.1 % literacy rate = 99% _________________________________________________________ Country C -- Russia Country D -- Size: 1.8 times the size of US (land mass) Size: 3.5 times bigger than Wash, DC Pop: 143 million Pop: 4 million Natural Resources: tons! Oil, natural Natural Resources: not many Gas, coal, timber (vast supplies) deep water port GDP/capita = $10,700 life expectancy = 67.1 yrs literacy rate = 99.6%
  • 14.
    Rank these 4countries, richest to poorest: Country A -- Argentina Size: 3/10 size of US Population: 40 Million Natural resources: many, Fertile land, lead, zinc, tin, etc. Country B -- Japan Size: About the size of California Pop: 127 million Natural resources: few; fish GDP/capita = $13,600 GDP/capita = $30,400 life expectancy = 76.9 yrs life expectancy = 81.15 yrs literacy rate = 97.1 % literacy rate = 99% _________________________________________________________ Country C -- Russia Country D -- Singapore Size: 1.8 times the size of US (land mass) Size: 3.5 times bigger than Wash, DC Pop: 143 million Pop: 4 million Natural Resources: tons! Oil, natural Natural Resources: not many Gas, coal, timber (vast supplies) GDP/capita = $10,700 life expectancy = 67.1 yrs literacy rate = 99.6% GDP/capita = $29,700 life expectancy = 81.62 yrs literacy rate = 92.5%
  • 15.
    Bonus Nation • Size:Twice the size of CA • Population: very large, 130 million + • Natural Resources: vast: oil, tin, iron ore, coal, limestone, lead, zinc, natural gas
  • 16.
    Bonus Nation • Size:Twice the size of CA • Population: very large, 130 million + • Natural Resources: vast: oil, tin, iron ore, coal, limestone, lead, zinc, natural gas Nigeria: • Per capital GDP: $1,400 2005 • Life Expectancy: 47.08 yrs • Infant Mortality: 97.14 / 1000
  • 18.
    What is Productivity? Production – Process – Transform resources – Intro goods and services  Productivity – Efficient use of resources – Ratio: Total output to specific input – Labor productivity • Output per unit of labor
  • 19.
    Labor Productivity • Whyis this important? • When does it increase? • With human and physical capital
  • 20.
    Per-Worker Production Function(PF) • The PF shows the relationship between the amount of capital per worker in the economy and average output per worker. • Capital deepening: an increase in the amount of capital per worker • One source of rising productivity • Contributes to labor productivity and economic growth
  • 21.
    Exhibit 2 LO1 Output perworker Per-Worker Production Function PF y 0 k The per-worker production function, PF, shows a direct relationship between the amount of capital per worker, k, and the output per worker, y. Capital per worker The bowed shape of PF reflects the law of diminishing marginal returns from capital: As more capital is added to a given number of workers, output per worker increases but at a diminishing rate and eventually could turn negative.
  • 22.
    Technological Change  Technology –Better quality of capital – Increased productivity – Upward rotation of PF – Higher standard of living
  • 23.
    LO1 Exhibit 3 Output perworker Impact of a Technological Breakthrough on the Per-Worker Production Function PF’ y’ PF y 0 k Capital per worker A technological breakthrough increases output per worker at each level of capital per worker. Better technology makes workers more productive. This is shown by an upward rotation of the per-worker production function from PF to PF’. An improvement in rules of the game would have a similar effect.
  • 24.
    Two Kinds ofChange in Capital Improve Worker Productivity 1) An increase in the QUANTITY of capital per worker – Movement along the per-worker production function. 2) An improvement in the QUALITY of capital per worker – Reflected by technological changes that rotate the PF
  • 25.
    Rules of theGame • The formal and informal institutions that promote economic activities: laws, customs, manners, etc. • Stable political environment • Well-define property rights
  • 26.
    Freedom Index http://www.fraserinstitute.org/research-news/displa How docountries rate? Does it make a difference in their Economic Growth? http://www.cato.org/pubs/efw/map/index.php
  • 27.
    Productivity and Growthin Practice  Industrial market economies – Higher standard of living – 15% of world population – Produce 75% of world’s output  Developing countries – Poor countries – Low standard of living – Less human and physical capital – Low labor productivity
  • 28.
    Education and Economic Development Education – Human capital – Higher productivity  Industrial market economies – Higher education levels  Developing countries – Lower education levels
  • 29.
    LO2 Exhibit 4 Percent ofAdult Population with at Least a College Education: 2003 and 2006
  • 30.
    U.S. Labor Productivity Annual productivity growth • 2.1% per year, since 1870 (by 1,680%) • Over long periods – Small differences in productivity » Huge differences in standard of living  1948-1973: Golden days; 2.9% per year  1974-1982 Slowdown to 1% – Oil pieces – Legislation  1983: rebound – Information revolution
  • 31.
    Exhibit 5 LO2 Long-Term Trendin U.S. Labor Productivity Growth: Annual Average by Decade
  • 32.
    LO2 Exhibit 6 U.S. Labor Productivity Growth Slowed During 1974-1982 andThen Rebounded The growth in labor productivity declined from 2.9% per year between 1948 and 1973 to only 1.0% between 1974 and 1982. A jump in the price of oil contributed to three recessions during that stretch, and new environmental and workplace regulations, though necessary and beneficial, slowed down productivity growth temporarily. The information revolution powered by the computer chip and the Internet has boosted productivity in recent years.
  • 33.
    How did computersboost productivity? 1) Efficiency gains in the production of computers and semiconductors 2) Greater computer use by industry
  • 34.
    Output per Capita Standard of living – Output per capita – Real GDP per capita  U.S. – General upward trend – During recessions • Decrease in productivity
  • 35.
    International Comparisons https://www.cia.gov/library/publications/the-worldCompare Angolawith the United States. What is Angola’s GDP per capita, what about the U.S.? Now what is their infant morality rates? (meaning how many babies live to see their first birthday). Is their a quality of life difference?
  • 36.
    Quality-of-Life Measures of Development •The GDP measures market transaction, it does not measure differences in living standards. – Demography • • • • Life expectancy at birth Infant mortality rate Illiteracy rate Per capita energy consumption – Economic Freedom • Freedom Index
  • 37.
    Technological change • Technologicalchange • Job dislocations can be created- displaced workers • More affordable products, boosting both production and employment • “Does technological change lead to unemployment?” • NO statistical evidence of this.
  • 38.
    Research & Development Basic research  General search for knowledge  First step for technological advancement  Yields a higher return to society  Applied research  Answer particular questions  Develop specific products
  • 39.
    Exhibit 10 LO 3 R&D Spendingas a Percentage of GDP for Major Economies during the 1980s, 1990s, and 2006
  • 40.
    Industrial Policy • Industrialpolicy • The idea that government, using taxes, subsidies, regulations, and coordination of private sector could help nurture industries. • Concerns • Government efficiency • Giveaway programs
  • 41.
    Do Economies Converge? •Convergence theory • Developing countries- they can grow faster than advanced economies • Why? • Adopt existing technologies • Invest in human resources • But, is it happening???