SlideShare a Scribd company logo
Muhammad Aqib Ali
Accounting Principles
Accounting Demystified
 Recording;
 Classifying;
 Summarizing;
 Analyzing;
 Interpreting; and finally
 Reporting.
Financial Statements
Analysis
Outline
 Purpose of Financial Analysis.
 Types of Ratio Analysis.
 Financial Statements.
 Users of Financial Statements.
 Ratio Analysis:
 Liquidity Ratios.
 Activity Ratios.
 Profitability Ratios.
 Capital Structure / Leverage Ratios.
 Market Value Ratios.
 Limitations of Ratio Analysis.
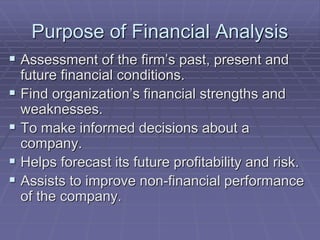
Purpose of Financial Analysis
 Assessment of the firm’s past, present and
future financial conditions.
 Find organization’s financial strengths and
weaknesses.
 To make informed decisions about a
company.
 Helps forecast its future profitability and risk.
 Assists to improve non-financial performance
of the company.
Using Financial Ratios
 Major tool for financial analysis.
 Standardize numbers and facilitate
comparisons.
 Analyze the firm’s financial position &
financial performance.
 Ratios are used to highlight weaknesses
and strengths.
 Better & easy to understand information
for the users.
Financial Statements
 Income Statement (Profit & Loss Account )
 Balance Sheet
 Cash Flow Statement
 Statement of Changes in Equity
 Notes to the Accounts
 Auditor’s Report / Director’s Report
Income Statement
Sales
Cost of Goods Sold
Gross Profit
Operating Expenses (Selling & Administration)
Operating Income
Add: Other Incomes
Profit Before Interest & Tax
Financial Charges
Profit Before Tax
Provision for Taxation
Profit After Tax
Profit B/F
Profit Available for Appropriations
Transfer to General Reserves
Dividends
Profit C/F (Transferred to Balance Sheet)
Rs.
******
(******)
******
(******)
******
******
******
(******)
******
(******)
******
******
******
(******)
(******)
******
Balance Sheet
Equity & Liabilities Rs. Assets & Properties Rs.
Share Capital &
Reserves:
Non-Current
Liabilities:
Current Liabilities:
******
******
******
Non-Current
Assets:
Long Term
Investments:
Current Assets:
******
******
******
Users of Financial Statements
 Internal Users
 External Users
Internal Users
 Management
 Employees
 Internal Auditors
External Users
 Investors
 Shareholders
 Customers
 Tax Authorities
 Banks & Other Financial Institutions
 Creditors
 Suppliers
 External Auditors
 Government Agencies
Types of Ratio Analysis
 Horizontal Analysis
 Vertical Analysis
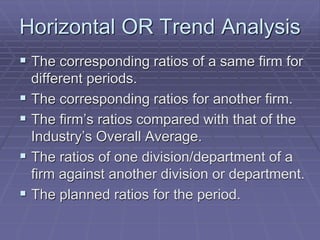
Horizontal OR Trend Analysis
 The corresponding ratios of a same firm for
different periods.
 The corresponding ratios for another firm.
 The firm’s ratios compared with that of the
Industry’s Overall Average.
 The ratios of one division/department of a
firm against another division or department.
 The planned ratios for the period.
Vertical Analysis
 Shows relationship of each item to a base
amount on financial statements.
 Income statement – each item expressed
as percentage of net sales.
 Balance sheet – each item expressed as
percentage of total assets.
Ratio Analysis
 Financial Ratios can be classified into 5
main categories:
 Liquidity OR Short-Term Solvency Ratios
 Asset Management OR Activity Ratios
 Profitability Ratios
 Capital Structure OR Leverage Ratios
 Market Test OR Market Value Ratios
What are the five major categories of ratios,
and what questions do they answer?
 Liquidity: Can we make required payments?
 Asset management: right amount of assets vs.
sales?
 Debt management: Right mix of debt and
equity?
 Profitability: Do sales prices exceed unit costs,
and are sales high enough as reflected in PM,
ROE, and ROA?
 Market value: Do investors like what they see as
reflected in P/E and M/B ratios?
Liquidity OR Short-Term Solvency
Ratios
 Net Working Capital =
Current Assets - Current Liabilities
 Current Ratio = Current Assets
Current Liabilities
 Acid Test/Liquid/Quick Ratio =
(Current Assets – Prepaid Expenses – Stock [Closing] – Loose Tools)
Current Liabilities
Activity OR Asset Management
Ratios
 Stock Turnover Ratio: CGS
Avg. Stock
 Debtors Turnover Ratio: Total Credit Sales
Average Debtors
 Average Collection Period:
Average Debtors X 360
Total Credit Sales
Activity OR Asset Management
Ratios
 Creditors Turnover : Total Credit Purchases
Average Creditors
 Average Payment Period:
Average Creditors X 360
Total Credit Purchases
 Total Assets Turnover Ratio:
CGS OR Sales
Total Assets
Profitability Ratios
 Sales: Rate of return on net sales (Profit
Margin)
 Investment (Assets): Rate of return on
total assets – how successful the business
is in using assets to earn a profit
Profitability Ratios (Sales)
 GP Ratio: Gross Profit X 100
Net Sales
 Net Profit Ratio: Profit After Tax X 100
Net Sales
 Operating Profit Ratio:
Operating Profit X 100
Net Sales
Profitability Ratios (Sales)
 Cost of Goods Sold Ratio:
CGS x 100
Net Sales
 Operating Ratio:
CGS + Operating Expenses X 100
Net Sales
Profitability Ratios
{Investment (Assets)}
 Return on Investment (ROI):
Profit After Tax X 100
Total Assets
 Return on Equity Funds (ROE):
Profit After Tax – Preference Dividend X 100
Ordinary Shareholders Equity
Profitability Ratios
{Investment (Assets)}
DuPont Analysis
 Three ways to ascertain Return on Equity:
 (A) Return on Equity Funds (ROE):
Profit After Tax – Preference Dividend X 100
Ordinary Shareholders Equity
 Ordinary Shareholders Funds/Equity: Ordinary Share
Capital + Reserves + Surplus
Profitability Ratios
{Investment (Assets)}
DuPont Analysis
 (B) Return on Equity = N.P Margin x Total
Assets Turnover x Financial Leverage:
Net Income x Revenues x Avg. Total Assets
Revenues Avg. T. Assets Avg. Sh. Equity
 ROE = (Profit margin) x (Asset turnover)
x (Equity multiplier)
Profitability Ratios
{Investment (Assets)}
DuPont Analysis
 ROE = (Profit margin) x (Asset turnover)
x (Equity multiplier)
 (Net profit/Sales) x Sales/Assets) x (Assets/Equity)
= (Net Profit/Equity)
 Operating efficiency (measured by profit margin)
 Asset use efficiency (measured by asset turnover)
 Financial leverage (measured by equity multiplier)
Profitability Ratios
{Investment (Assets)}
 Return on Capital Employed (ROCE):
Profit After Tax + Interest X 100
Total Capital Employed
 Total Capital Employed: Ordinary Share Capital + Preference
Share Capital + Reserves (Capital & Revenue) + Surplus + Long
Term Liabilities
 Return on Total Assets (ROA):
Profit After Tax + Interest X 100
Total Assets
Capital Structure OR Leverage OR
Long – Term Solvency Ratios
 Debt – Asset Relationship (Balance
Sheet Based )
 Coverage Ratios ( P & L A/C Based )
Debt – Asset Ratios
 Debt – Equity Ratio: Long – Term Liabilities X 100
Equity Share Capital
 Equity Share Capital => Ordinary Share Capital + Preference
Share Capital + Reserves + Surplus
 Debt – Total Capital: Long – Term Liabilities X 100
Total Capital
 Total Capital =>Equity Share Capital + Long Term Liabilities
Debt – Asset Ratios
 Debt Ratio OR Debt to Total Assets:
Total Debts X 100
Total Assets
 Total Debts => Long Term Liabilities + Short Term Liabilities
 Capital Gearing Ratio:
Fixed Cost Capital X 100
Shareholders Equity + Long Term Liabilities
Fixed Cost Capital =>Preference Share Capital + Debentures +
Other Borrowed Funds.
 If Capital Gearing Ratio is:
 Greater Than 50% - High Geared.
 Equal to 50% - Neutral Geared.
 Lower Than 50% - Low Geared.
Coverage Ratios
 Interest Coverage Ratio:
Profit Before Tax & Interest
Interest
 Dividend Coverage Ratio:
Profit After Tax
Preference Dividend
Market Value/Test Ratios
 Earnings per share = Net Profit after tax
Number of issued ordinary shares
 Dividend per share = Dividends
Number of issued ordinary shares
 Market to Book Value (M/B) Ratio = Market price per share
Book value per share
 Price Earnings (P/E) Ratio = Market price per share
Earnings per share
Limitations of Ratio Analysis
 Basic financial data must be reliable or
the results may be misleading.
 Ratio Analysis only considers financial
data financial data share the same
problems of financial data (such as
timeliness).
 Different firms use different accounting
policies e.g. Depreciation method.
Limitations of Ratio Analysis
 Comparing ratios over time is complicated by
the fact that economic conditions may change
also such as inflation, interest rate, prices etc.
 Comparing ratios between two firms is
complicated by the fact that the firms may have
different economic environments or production
technologies even though they produce the
same product.
 Ratio analysis is only numerical and calculated
values which may be based on accounting
estimates.
Thanks !

More Related Content

Similar to Financial Statement Analysis

Financial Report Literacy Fall 2011
Financial Report Literacy Fall 2011Financial Report Literacy Fall 2011
Financial Report Literacy Fall 2011Miriam Smith
 
Financial Management in Construction 5.pptx
Financial Management in Construction 5.pptxFinancial Management in Construction 5.pptx
Financial Management in Construction 5.pptx
Abdulfeta7
 
Fundamental analysis
Fundamental analysisFundamental analysis
Fundamental analysis
Dhaval Radia
 
Financial Reports and Ratios
Financial Reports and RatiosFinancial Reports and Ratios
Financial Reports and RatiosMiriam Smith
 
Benchmarking your business
Benchmarking your business Benchmarking your business
Benchmarking your business
Ed Lette
 
COMPANY ANALYSIS-HINDUSTAN UNILEVER LTD
COMPANY ANALYSIS-HINDUSTAN UNILEVER LTDCOMPANY ANALYSIS-HINDUSTAN UNILEVER LTD
COMPANY ANALYSIS-HINDUSTAN UNILEVER LTD
SaiLakshmi115
 
3. Financial Statement Analysis Interpretation- AC570 AMcM.pptx
3. Financial Statement Analysis  Interpretation- AC570 AMcM.pptx3. Financial Statement Analysis  Interpretation- AC570 AMcM.pptx
3. Financial Statement Analysis Interpretation- AC570 AMcM.pptx
sawantac2
 
Financial statement analysis
Financial statement analysisFinancial statement analysis
Financial statement analysis
Jawad Ahmed
 
Financial Analysis Tools - Mark Kolta
Financial Analysis Tools - Mark KoltaFinancial Analysis Tools - Mark Kolta
Financial Analysis Tools - Mark Kolta
Mark Kolta
 
Ratio Analysis Ppt
Ratio Analysis PptRatio Analysis Ppt
Ratio Analysis PptMobasher Ali
 
Ratio analysis
Ratio analysisRatio analysis
Ratio analysis
eduCBA
 
Ratio analysis
Ratio analysisRatio analysis
Ratio analysis
VadivelM9
 
Ratio Analysis
Ratio AnalysisRatio Analysis
Ratio Analysis
VadivelM9
 
Financial ratios
Financial ratiosFinancial ratios
Financial ratios
David Ainscough
 
Unit 3 Analysis of Financial Statements
Unit 3 Analysis of Financial Statements Unit 3 Analysis of Financial Statements
Unit 3 Analysis of Financial Statements
Ramesh Kumar Natesan
 
Business analysis ppt
Business analysis ppt Business analysis ppt
Business analysis ppt
Babasab Patil
 
Analysis of financial statements
Analysis of financial statementsAnalysis of financial statements
Analysis of financial statements
Haris Masood
 
Introduction to accounting chapter 5
Introduction to accounting chapter 5Introduction to accounting chapter 5
Introduction to accounting chapter 5
SAITO College Sdn Bhd
 

Similar to Financial Statement Analysis (20)

Financial Report Literacy Fall 2011
Financial Report Literacy Fall 2011Financial Report Literacy Fall 2011
Financial Report Literacy Fall 2011
 
The finance perspective dupont
The finance perspective dupontThe finance perspective dupont
The finance perspective dupont
 
Financial Management in Construction 5.pptx
Financial Management in Construction 5.pptxFinancial Management in Construction 5.pptx
Financial Management in Construction 5.pptx
 
Fundamental analysis
Fundamental analysisFundamental analysis
Fundamental analysis
 
Financial Reports and Ratios
Financial Reports and RatiosFinancial Reports and Ratios
Financial Reports and Ratios
 
Benchmarking your business
Benchmarking your business Benchmarking your business
Benchmarking your business
 
COMPANY ANALYSIS-HINDUSTAN UNILEVER LTD
COMPANY ANALYSIS-HINDUSTAN UNILEVER LTDCOMPANY ANALYSIS-HINDUSTAN UNILEVER LTD
COMPANY ANALYSIS-HINDUSTAN UNILEVER LTD
 
3. Financial Statement Analysis Interpretation- AC570 AMcM.pptx
3. Financial Statement Analysis  Interpretation- AC570 AMcM.pptx3. Financial Statement Analysis  Interpretation- AC570 AMcM.pptx
3. Financial Statement Analysis Interpretation- AC570 AMcM.pptx
 
gty
gtygty
gty
 
Financial statement analysis
Financial statement analysisFinancial statement analysis
Financial statement analysis
 
Financial Analysis Tools - Mark Kolta
Financial Analysis Tools - Mark KoltaFinancial Analysis Tools - Mark Kolta
Financial Analysis Tools - Mark Kolta
 
Ratio Analysis Ppt
Ratio Analysis PptRatio Analysis Ppt
Ratio Analysis Ppt
 
Ratio analysis
Ratio analysisRatio analysis
Ratio analysis
 
Ratio analysis
Ratio analysisRatio analysis
Ratio analysis
 
Ratio Analysis
Ratio AnalysisRatio Analysis
Ratio Analysis
 
Financial ratios
Financial ratiosFinancial ratios
Financial ratios
 
Unit 3 Analysis of Financial Statements
Unit 3 Analysis of Financial Statements Unit 3 Analysis of Financial Statements
Unit 3 Analysis of Financial Statements
 
Business analysis ppt
Business analysis ppt Business analysis ppt
Business analysis ppt
 
Analysis of financial statements
Analysis of financial statementsAnalysis of financial statements
Analysis of financial statements
 
Introduction to accounting chapter 5
Introduction to accounting chapter 5Introduction to accounting chapter 5
Introduction to accounting chapter 5
 

Recently uploaded

What is the TDS Return Filing Due Date for FY 2024-25.pdf
What is the TDS Return Filing Due Date for FY 2024-25.pdfWhat is the TDS Return Filing Due Date for FY 2024-25.pdf
What is the TDS Return Filing Due Date for FY 2024-25.pdf
seoforlegalpillers
 
ENTREPRENEURSHIP TRAINING.ppt for graduating class (1).ppt
ENTREPRENEURSHIP TRAINING.ppt for graduating class (1).pptENTREPRENEURSHIP TRAINING.ppt for graduating class (1).ppt
ENTREPRENEURSHIP TRAINING.ppt for graduating class (1).ppt
zechu97
 
ikea_woodgreen_petscharity_cat-alogue_digital.pdf
ikea_woodgreen_petscharity_cat-alogue_digital.pdfikea_woodgreen_petscharity_cat-alogue_digital.pdf
ikea_woodgreen_petscharity_cat-alogue_digital.pdf
agatadrynko
 
The effects of customers service quality and online reviews on customer loyal...
The effects of customers service quality and online reviews on customer loyal...The effects of customers service quality and online reviews on customer loyal...
The effects of customers service quality and online reviews on customer loyal...
balatucanapplelovely
 
April 2024 Nostalgia Products Newsletter
April 2024 Nostalgia Products NewsletterApril 2024 Nostalgia Products Newsletter
April 2024 Nostalgia Products Newsletter
NathanBaughman3
 
Digital Transformation and IT Strategy Toolkit and Templates
Digital Transformation and IT Strategy Toolkit and TemplatesDigital Transformation and IT Strategy Toolkit and Templates
Digital Transformation and IT Strategy Toolkit and Templates
Aurelien Domont, MBA
 
Search Disrupted Google’s Leaked Documents Rock the SEO World.pdf
Search Disrupted Google’s Leaked Documents Rock the SEO World.pdfSearch Disrupted Google’s Leaked Documents Rock the SEO World.pdf
Search Disrupted Google’s Leaked Documents Rock the SEO World.pdf
Arihant Webtech Pvt. Ltd
 
CADAVER AS OUR FIRST TEACHER anatomt in your.pptx
CADAVER AS OUR FIRST TEACHER anatomt in your.pptxCADAVER AS OUR FIRST TEACHER anatomt in your.pptx
CADAVER AS OUR FIRST TEACHER anatomt in your.pptx
fakeloginn69
 
Exploring Patterns of Connection with Social Dreaming
Exploring Patterns of Connection with Social DreamingExploring Patterns of Connection with Social Dreaming
Exploring Patterns of Connection with Social Dreaming
Nicola Wreford-Howard
 
Affordable Stationery Printing Services in Jaipur | Navpack n Print
Affordable Stationery Printing Services in Jaipur | Navpack n PrintAffordable Stationery Printing Services in Jaipur | Navpack n Print
Affordable Stationery Printing Services in Jaipur | Navpack n Print
Navpack & Print
 
Buy Verified PayPal Account | Buy Google 5 Star Reviews
Buy Verified PayPal Account | Buy Google 5 Star ReviewsBuy Verified PayPal Account | Buy Google 5 Star Reviews
Buy Verified PayPal Account | Buy Google 5 Star Reviews
usawebmarket
 
Sustainability: Balancing the Environment, Equity & Economy
Sustainability: Balancing the Environment, Equity & EconomySustainability: Balancing the Environment, Equity & Economy
Sustainability: Balancing the Environment, Equity & Economy
Operational Excellence Consulting
 
VAT Registration Outlined In UAE: Benefits and Requirements
VAT Registration Outlined In UAE: Benefits and RequirementsVAT Registration Outlined In UAE: Benefits and Requirements
VAT Registration Outlined In UAE: Benefits and Requirements
uae taxgpt
 
RMD24 | Retail media: hoe zet je dit in als je geen AH of Unilever bent? Heid...
RMD24 | Retail media: hoe zet je dit in als je geen AH of Unilever bent? Heid...RMD24 | Retail media: hoe zet je dit in als je geen AH of Unilever bent? Heid...
RMD24 | Retail media: hoe zet je dit in als je geen AH of Unilever bent? Heid...
BBPMedia1
 
Skye Residences | Extended Stay Residences Near Toronto Airport
Skye Residences | Extended Stay Residences Near Toronto AirportSkye Residences | Extended Stay Residences Near Toronto Airport
Skye Residences | Extended Stay Residences Near Toronto Airport
marketingjdass
 
Attending a job Interview for B1 and B2 Englsih learners
Attending a job Interview for B1 and B2 Englsih learnersAttending a job Interview for B1 and B2 Englsih learners
Attending a job Interview for B1 and B2 Englsih learners
Erika906060
 
RMD24 | Debunking the non-endemic revenue myth Marvin Vacquier Droop | First ...
RMD24 | Debunking the non-endemic revenue myth Marvin Vacquier Droop | First ...RMD24 | Debunking the non-endemic revenue myth Marvin Vacquier Droop | First ...
RMD24 | Debunking the non-endemic revenue myth Marvin Vacquier Droop | First ...
BBPMedia1
 
FINAL PRESENTATION.pptx12143241324134134
FINAL PRESENTATION.pptx12143241324134134FINAL PRESENTATION.pptx12143241324134134
FINAL PRESENTATION.pptx12143241324134134
LR1709MUSIC
 
5 Things You Need To Know Before Hiring a Videographer
5 Things You Need To Know Before Hiring a Videographer5 Things You Need To Know Before Hiring a Videographer
5 Things You Need To Know Before Hiring a Videographer
ofm712785
 
Tata Group Dials Taiwan for Its Chipmaking Ambition in Gujarat’s Dholera
Tata Group Dials Taiwan for Its Chipmaking Ambition in Gujarat’s DholeraTata Group Dials Taiwan for Its Chipmaking Ambition in Gujarat’s Dholera
Tata Group Dials Taiwan for Its Chipmaking Ambition in Gujarat’s Dholera
Avirahi City Dholera
 

Recently uploaded (20)

What is the TDS Return Filing Due Date for FY 2024-25.pdf
What is the TDS Return Filing Due Date for FY 2024-25.pdfWhat is the TDS Return Filing Due Date for FY 2024-25.pdf
What is the TDS Return Filing Due Date for FY 2024-25.pdf
 
ENTREPRENEURSHIP TRAINING.ppt for graduating class (1).ppt
ENTREPRENEURSHIP TRAINING.ppt for graduating class (1).pptENTREPRENEURSHIP TRAINING.ppt for graduating class (1).ppt
ENTREPRENEURSHIP TRAINING.ppt for graduating class (1).ppt
 
ikea_woodgreen_petscharity_cat-alogue_digital.pdf
ikea_woodgreen_petscharity_cat-alogue_digital.pdfikea_woodgreen_petscharity_cat-alogue_digital.pdf
ikea_woodgreen_petscharity_cat-alogue_digital.pdf
 
The effects of customers service quality and online reviews on customer loyal...
The effects of customers service quality and online reviews on customer loyal...The effects of customers service quality and online reviews on customer loyal...
The effects of customers service quality and online reviews on customer loyal...
 
April 2024 Nostalgia Products Newsletter
April 2024 Nostalgia Products NewsletterApril 2024 Nostalgia Products Newsletter
April 2024 Nostalgia Products Newsletter
 
Digital Transformation and IT Strategy Toolkit and Templates
Digital Transformation and IT Strategy Toolkit and TemplatesDigital Transformation and IT Strategy Toolkit and Templates
Digital Transformation and IT Strategy Toolkit and Templates
 
Search Disrupted Google’s Leaked Documents Rock the SEO World.pdf
Search Disrupted Google’s Leaked Documents Rock the SEO World.pdfSearch Disrupted Google’s Leaked Documents Rock the SEO World.pdf
Search Disrupted Google’s Leaked Documents Rock the SEO World.pdf
 
CADAVER AS OUR FIRST TEACHER anatomt in your.pptx
CADAVER AS OUR FIRST TEACHER anatomt in your.pptxCADAVER AS OUR FIRST TEACHER anatomt in your.pptx
CADAVER AS OUR FIRST TEACHER anatomt in your.pptx
 
Exploring Patterns of Connection with Social Dreaming
Exploring Patterns of Connection with Social DreamingExploring Patterns of Connection with Social Dreaming
Exploring Patterns of Connection with Social Dreaming
 
Affordable Stationery Printing Services in Jaipur | Navpack n Print
Affordable Stationery Printing Services in Jaipur | Navpack n PrintAffordable Stationery Printing Services in Jaipur | Navpack n Print
Affordable Stationery Printing Services in Jaipur | Navpack n Print
 
Buy Verified PayPal Account | Buy Google 5 Star Reviews
Buy Verified PayPal Account | Buy Google 5 Star ReviewsBuy Verified PayPal Account | Buy Google 5 Star Reviews
Buy Verified PayPal Account | Buy Google 5 Star Reviews
 
Sustainability: Balancing the Environment, Equity & Economy
Sustainability: Balancing the Environment, Equity & EconomySustainability: Balancing the Environment, Equity & Economy
Sustainability: Balancing the Environment, Equity & Economy
 
VAT Registration Outlined In UAE: Benefits and Requirements
VAT Registration Outlined In UAE: Benefits and RequirementsVAT Registration Outlined In UAE: Benefits and Requirements
VAT Registration Outlined In UAE: Benefits and Requirements
 
RMD24 | Retail media: hoe zet je dit in als je geen AH of Unilever bent? Heid...
RMD24 | Retail media: hoe zet je dit in als je geen AH of Unilever bent? Heid...RMD24 | Retail media: hoe zet je dit in als je geen AH of Unilever bent? Heid...
RMD24 | Retail media: hoe zet je dit in als je geen AH of Unilever bent? Heid...
 
Skye Residences | Extended Stay Residences Near Toronto Airport
Skye Residences | Extended Stay Residences Near Toronto AirportSkye Residences | Extended Stay Residences Near Toronto Airport
Skye Residences | Extended Stay Residences Near Toronto Airport
 
Attending a job Interview for B1 and B2 Englsih learners
Attending a job Interview for B1 and B2 Englsih learnersAttending a job Interview for B1 and B2 Englsih learners
Attending a job Interview for B1 and B2 Englsih learners
 
RMD24 | Debunking the non-endemic revenue myth Marvin Vacquier Droop | First ...
RMD24 | Debunking the non-endemic revenue myth Marvin Vacquier Droop | First ...RMD24 | Debunking the non-endemic revenue myth Marvin Vacquier Droop | First ...
RMD24 | Debunking the non-endemic revenue myth Marvin Vacquier Droop | First ...
 
FINAL PRESENTATION.pptx12143241324134134
FINAL PRESENTATION.pptx12143241324134134FINAL PRESENTATION.pptx12143241324134134
FINAL PRESENTATION.pptx12143241324134134
 
5 Things You Need To Know Before Hiring a Videographer
5 Things You Need To Know Before Hiring a Videographer5 Things You Need To Know Before Hiring a Videographer
5 Things You Need To Know Before Hiring a Videographer
 
Tata Group Dials Taiwan for Its Chipmaking Ambition in Gujarat’s Dholera
Tata Group Dials Taiwan for Its Chipmaking Ambition in Gujarat’s DholeraTata Group Dials Taiwan for Its Chipmaking Ambition in Gujarat’s Dholera
Tata Group Dials Taiwan for Its Chipmaking Ambition in Gujarat’s Dholera
 

Financial Statement Analysis

  • 2. Accounting Demystified  Recording;  Classifying;  Summarizing;  Analyzing;  Interpreting; and finally  Reporting.
  • 4. Outline  Purpose of Financial Analysis.  Types of Ratio Analysis.  Financial Statements.  Users of Financial Statements.  Ratio Analysis:  Liquidity Ratios.  Activity Ratios.  Profitability Ratios.  Capital Structure / Leverage Ratios.  Market Value Ratios.  Limitations of Ratio Analysis.
  • 5. Purpose of Financial Analysis  Assessment of the firm’s past, present and future financial conditions.  Find organization’s financial strengths and weaknesses.  To make informed decisions about a company.  Helps forecast its future profitability and risk.  Assists to improve non-financial performance of the company.
  • 6. Using Financial Ratios  Major tool for financial analysis.  Standardize numbers and facilitate comparisons.  Analyze the firm’s financial position & financial performance.  Ratios are used to highlight weaknesses and strengths.  Better & easy to understand information for the users.
  • 7. Financial Statements  Income Statement (Profit & Loss Account )  Balance Sheet  Cash Flow Statement  Statement of Changes in Equity  Notes to the Accounts  Auditor’s Report / Director’s Report
  • 8. Income Statement Sales Cost of Goods Sold Gross Profit Operating Expenses (Selling & Administration) Operating Income Add: Other Incomes Profit Before Interest & Tax Financial Charges Profit Before Tax Provision for Taxation Profit After Tax Profit B/F Profit Available for Appropriations Transfer to General Reserves Dividends Profit C/F (Transferred to Balance Sheet) Rs. ****** (******) ****** (******) ****** ****** ****** (******) ****** (******) ****** ****** ****** (******) (******) ******
  • 9. Balance Sheet Equity & Liabilities Rs. Assets & Properties Rs. Share Capital & Reserves: Non-Current Liabilities: Current Liabilities: ****** ****** ****** Non-Current Assets: Long Term Investments: Current Assets: ****** ****** ******
  • 10. Users of Financial Statements  Internal Users  External Users
  • 11. Internal Users  Management  Employees  Internal Auditors
  • 12. External Users  Investors  Shareholders  Customers  Tax Authorities  Banks & Other Financial Institutions  Creditors  Suppliers  External Auditors  Government Agencies
  • 13. Types of Ratio Analysis  Horizontal Analysis  Vertical Analysis
  • 14. Horizontal OR Trend Analysis  The corresponding ratios of a same firm for different periods.  The corresponding ratios for another firm.  The firm’s ratios compared with that of the Industry’s Overall Average.  The ratios of one division/department of a firm against another division or department.  The planned ratios for the period.
  • 15. Vertical Analysis  Shows relationship of each item to a base amount on financial statements.  Income statement – each item expressed as percentage of net sales.  Balance sheet – each item expressed as percentage of total assets.
  • 16. Ratio Analysis  Financial Ratios can be classified into 5 main categories:  Liquidity OR Short-Term Solvency Ratios  Asset Management OR Activity Ratios  Profitability Ratios  Capital Structure OR Leverage Ratios  Market Test OR Market Value Ratios
  • 17. What are the five major categories of ratios, and what questions do they answer?  Liquidity: Can we make required payments?  Asset management: right amount of assets vs. sales?  Debt management: Right mix of debt and equity?  Profitability: Do sales prices exceed unit costs, and are sales high enough as reflected in PM, ROE, and ROA?  Market value: Do investors like what they see as reflected in P/E and M/B ratios?
  • 18. Liquidity OR Short-Term Solvency Ratios  Net Working Capital = Current Assets - Current Liabilities  Current Ratio = Current Assets Current Liabilities  Acid Test/Liquid/Quick Ratio = (Current Assets – Prepaid Expenses – Stock [Closing] – Loose Tools) Current Liabilities
  • 19. Activity OR Asset Management Ratios  Stock Turnover Ratio: CGS Avg. Stock  Debtors Turnover Ratio: Total Credit Sales Average Debtors  Average Collection Period: Average Debtors X 360 Total Credit Sales
  • 20. Activity OR Asset Management Ratios  Creditors Turnover : Total Credit Purchases Average Creditors  Average Payment Period: Average Creditors X 360 Total Credit Purchases  Total Assets Turnover Ratio: CGS OR Sales Total Assets
  • 21. Profitability Ratios  Sales: Rate of return on net sales (Profit Margin)  Investment (Assets): Rate of return on total assets – how successful the business is in using assets to earn a profit
  • 22. Profitability Ratios (Sales)  GP Ratio: Gross Profit X 100 Net Sales  Net Profit Ratio: Profit After Tax X 100 Net Sales  Operating Profit Ratio: Operating Profit X 100 Net Sales
  • 23. Profitability Ratios (Sales)  Cost of Goods Sold Ratio: CGS x 100 Net Sales  Operating Ratio: CGS + Operating Expenses X 100 Net Sales
  • 24. Profitability Ratios {Investment (Assets)}  Return on Investment (ROI): Profit After Tax X 100 Total Assets  Return on Equity Funds (ROE): Profit After Tax – Preference Dividend X 100 Ordinary Shareholders Equity
  • 25. Profitability Ratios {Investment (Assets)} DuPont Analysis  Three ways to ascertain Return on Equity:  (A) Return on Equity Funds (ROE): Profit After Tax – Preference Dividend X 100 Ordinary Shareholders Equity  Ordinary Shareholders Funds/Equity: Ordinary Share Capital + Reserves + Surplus
  • 26. Profitability Ratios {Investment (Assets)} DuPont Analysis  (B) Return on Equity = N.P Margin x Total Assets Turnover x Financial Leverage: Net Income x Revenues x Avg. Total Assets Revenues Avg. T. Assets Avg. Sh. Equity  ROE = (Profit margin) x (Asset turnover) x (Equity multiplier)
  • 27. Profitability Ratios {Investment (Assets)} DuPont Analysis  ROE = (Profit margin) x (Asset turnover) x (Equity multiplier)  (Net profit/Sales) x Sales/Assets) x (Assets/Equity) = (Net Profit/Equity)  Operating efficiency (measured by profit margin)  Asset use efficiency (measured by asset turnover)  Financial leverage (measured by equity multiplier)
  • 28. Profitability Ratios {Investment (Assets)}  Return on Capital Employed (ROCE): Profit After Tax + Interest X 100 Total Capital Employed  Total Capital Employed: Ordinary Share Capital + Preference Share Capital + Reserves (Capital & Revenue) + Surplus + Long Term Liabilities  Return on Total Assets (ROA): Profit After Tax + Interest X 100 Total Assets
  • 29. Capital Structure OR Leverage OR Long – Term Solvency Ratios  Debt – Asset Relationship (Balance Sheet Based )  Coverage Ratios ( P & L A/C Based )
  • 30. Debt – Asset Ratios  Debt – Equity Ratio: Long – Term Liabilities X 100 Equity Share Capital  Equity Share Capital => Ordinary Share Capital + Preference Share Capital + Reserves + Surplus  Debt – Total Capital: Long – Term Liabilities X 100 Total Capital  Total Capital =>Equity Share Capital + Long Term Liabilities
  • 31. Debt – Asset Ratios  Debt Ratio OR Debt to Total Assets: Total Debts X 100 Total Assets  Total Debts => Long Term Liabilities + Short Term Liabilities  Capital Gearing Ratio: Fixed Cost Capital X 100 Shareholders Equity + Long Term Liabilities Fixed Cost Capital =>Preference Share Capital + Debentures + Other Borrowed Funds.  If Capital Gearing Ratio is:  Greater Than 50% - High Geared.  Equal to 50% - Neutral Geared.  Lower Than 50% - Low Geared.
  • 32. Coverage Ratios  Interest Coverage Ratio: Profit Before Tax & Interest Interest  Dividend Coverage Ratio: Profit After Tax Preference Dividend
  • 33. Market Value/Test Ratios  Earnings per share = Net Profit after tax Number of issued ordinary shares  Dividend per share = Dividends Number of issued ordinary shares  Market to Book Value (M/B) Ratio = Market price per share Book value per share  Price Earnings (P/E) Ratio = Market price per share Earnings per share
  • 34. Limitations of Ratio Analysis  Basic financial data must be reliable or the results may be misleading.  Ratio Analysis only considers financial data financial data share the same problems of financial data (such as timeliness).  Different firms use different accounting policies e.g. Depreciation method.
  • 35. Limitations of Ratio Analysis  Comparing ratios over time is complicated by the fact that economic conditions may change also such as inflation, interest rate, prices etc.  Comparing ratios between two firms is complicated by the fact that the firms may have different economic environments or production technologies even though they produce the same product.  Ratio analysis is only numerical and calculated values which may be based on accounting estimates.