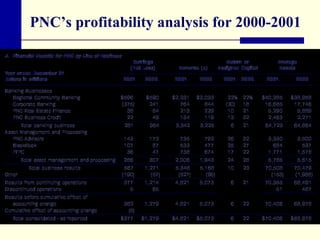
ALTERNATIVE MODELS OF BANK PERFORMANCE Chapter 4 Bank Management ,   5th edition. Timothy W. Koch and S. Scott MacDonald Copyright © 2003 by South-Western, a division of Thomson Learning
Traditional bank performance analysis carries three basic flaws It ignores the wide diversity in strategies pursued by different institutions  A bank’s total assets no longer serve as a meaningful yardstick when banks engage in off-balance sheet activities  The  analysis provides no direct information concerning how or  which of the bank’s activities  contribute to the creation of  shareholder value
Wide diversity in strategies pursued by different institutions  When UBPRs were introduced, most banks did similar things, which were reflected in their balance sheet  They accepted deposits and made loans, and many interest rates were regulated  The primary differentiation of performance was balance sheet composition  Today, banks may pursue sharply different strategies
Bank’s total assets no longer serve as a meaningful yardstick when banks engage in off-balance sheet activities  Consider the situation where two banks report the same asset size, but one also has an extensive mortgage-servicing operation that generates servicing income  If the bank with mortgage-servicing makes a profit on this activity, it will report a higher ROA, ceteris paribus, due to the higher noninterest income for mortgage-servicing fees
The analysis provides no direct information concerning how or which of the bank’s activities contribute to the creation of shareholder value  It similarly ignores other performance benchmarks that customer-focused managers must consider to identify the best strategies going forward
Although ROA might be a biased indicator of performance, return on equity (ROE) doesn’t suffer from the same weaknesses.  When considering the entire bank, stockholders’ equity must support all activities, whether on- or off-balance sheet.  Thus, a comparison of net income to equity captures the returns to owners’ contributions.
The appropriate peer group …as long as banks have a similar strategic focus and offer similar products and services, asset size and UBPR ratios can provide meaningful comparisons. To identify the appropriate peer institutions, management should consider the following: What is the bank’s strategic focus? What are the traditional balance sheet and off-balance sheet characteristics of firms with this focus? How do the bank’s activities affect its operating revenue?
A common starting point is to determine whether the bank’s strategy is more loan-driven or deposit-driven. A loan-driven bank’s profitability  is generally a function of  net interest income (the margin)  with loan volume a major factor. A deposit-driven bank’s profitability is generally a function of noninterest income with franchise value and deposit volume a major factor.
A loan driven bank finds that: asset size is determined by loan demand profitability is determined by loan economics; i.e., loan yields versus cost of fund loan margin is high as well as noninterest expense the culture is typically “our bank underwrites loans better than other banks” value is typically some multiple of core earnings
A deposit driven bank typically finds that: asset size is determine by the growth in core deposits value is determined by the bank’s franchise value -- measured by the market share of low-cost core deposits lower interest income, interest margins and noninterest expenses lower loan losses
Evaluating performance using GAAP-based data and UBPR ratios …a bank should compare its ratios with those from a select sample of peer institutions that are similarly loan-driven or deposit-driven. Peers should operate the same approximate number of offices in the same metropolitan or non-metropolitan markets and have the same product and service mix.  Asset-based ratios are thus directly comparable.  Analysts can easily construct peer bank averages by direct comparison to other similar bank’s  UBPR’s  or by using the FDIC’s Statistics on Depository Institutions (SDI) system at: http://www3.fdic.gov/sdi/
One way to construct ratios that avoid the problems of off-balance sheet activities is to calculate ratios tied to a bank’s total operating revenue (net interest income plus noninterest income) - - (David Cates (1996)) Fundamentally this means calculate performance measures using total operating revenue as the denominator rather than assets.  Here, total operating revenue equals the sum of net interest income and noninterest income.
The  efficiency ratio …measured as noninterest expense divided by total operating revenue, is a popular measure used by stock analysis based on operating revenue rather than assets. Analysts strongly encourage banks, regardless of size, to meet fairly specific targets in this ratio.  Because operating revenue includes both interest income and noninterest (fee-based) income, it captures all activities. Efficiency Ratio = noninterest expense / net operating revenue where  net operating revenue  = the sum of net interest income + noninterest income.
Bank stock analysts follow a standard procedure when evaluating firm performance Initially use GAAP-based financial information to calculate performance measures  adjust the data to omit the impact of nonrecurring items, such as one-time asset sales and restructuring charges  compare these historical ratios with a carefully selected group of peer institutions, matching each bank’s primary strategic focus  Based on his or her own analysis and conversations with specialists within the bank, the analyst then assesses the quality of earnings based on: their sustainability the bank’s market power in specific product or service areas the bank’s franchise value  The next step is to forecast earnings, cash flow, and market value of equity over a three- to five-year time horizon  Finally, the analyst makes a stock recommendation:  accumulate (buy) neutral (hold) below-market performance (sell)
It is extremely rare, however, to see an outright sell recommendation because analysts want to remain in the good graces of the banks that they follow Thus, they do not formally recommend selling the stock, but rather label it as likely to exhibit below-market performance.  A hold recommendation thus actually means “sell the stock” for most analysts. The recent failure of Enron is potentially an example of the conflict of interest “buy-side” and “sell-side” analysts have.
Investors in bank stocks are primarily concerned with whether the bank’s management is creating value for stockholders.  When analysts compare performance over some historical period, they are less concerned with ROE, ROA, and efficiency ratios –  rather the overall total return from investing in the bank’s stock .  Total return equals dividends received plus stock price appreciation/depreciation relative to the initial investment.
Return to stockholders  = (  price + dividends) / price t-1 Earnings per share Price to earnings (P/E)  = stock price / EPS Price to book value = stock price / book value per share Market value (MV) of equit y = MV of assets - MV of liabilities or = # share of common stock x stock price Key stock market-based performance measures include
Example:   buy 100 shares of PNC Financial at the beginning of 2001 for $73.06. The bank paid $1.92 per share in dividends that generated reinvestment income of $.09. At the end of 2001, the price of stock was $56.20. Return to stockholders in 2001 was -20.3%. 0.203 = [$56.20 - $73.06 + $2.01]  ÷  $73.06
Balanced scorecard …performance measures that look  beyond just financial measures The balanced scorecard is an attempt to balance management decisions based on financial measures with decisions based on a firm’s relationships with its customers and the effectiveness of support processes in designing and delivering products and services The result is that line of business managers use indicators such as: market share,  customer retention and attrition,  customer profitability, and  service quality to evaluate performance Internally, they also track productivity and employee satisfaction Such nonfinancial indicators provide information regarding whether a bank is truly  customer-focused  and whether its systems are appropriate
Operationalize the balanced scorecard  …divide the bank into a Customer Bank and a House Bank Income derived from balance sheet and income statement items that are derived from bank customers determines The Customer Bank Items that arise when the bank is its own customer determines  The House Bank
Two banks in one house Traditional or Customer Bank, activities include: most loans, core deposits, payment services, credit enhancements, asset management, and financial advisory.  Investment or House Bank, activities include: the investment portfolio, noncore, purchased liabilities, loan participations, asset sales, servicing, and bank-sponsored mutual funds.  Items are assigned based on whether the underlying activities pertain to bank customers (Customer Bank) or the bank itself (Investment Bank). Evaluate the returns on each Bank relative to the risks and relevant benchmarks.
Line of business profitability analysis … By allocate operating expenses to activities that support bank customers and bank management, banks can obtain at least a  rough estimate of segment net income.  Leads to the reporting and use of both financial and nonfinancial performance data, based on specific customers. Many banks attempt to measure profitability by: type of loan customer (small business, middle market, consumer installment, etc.) type of depositor; by characteristics of the relationship (account longevity, cross-sell patterns, profitability, etc.) and delivery system (branch, ATM, tele-phone, home banking, etc.).
RAROC/RORAC analysis …RAROC refers to risk-adjusted return on capital, while RORAC refers to return on risk-adjusted capital. In order to analyze profitability and risk precisely, each line of business must have its own balance sheet and income statement.  These statements are difficult to construct because many nontraditional activities, such as trust and mortgage-servicing, do not explicitly require any direct equity support.  Even traditional activities, such as commercial lending and consumer banking, complicate the issue because these business units do not have equal amounts of assets and liabilities generated by customers.  The critical issue is to determine how much equity capital to assign each unit.
Assigning equity capital to each unit Alternative capital allocation methods include: using regulatory risk-based capital standards assignment based on the size of assets benchmarking each unit to “pure-play” peers that are stand-alone, publicly held firms; and  measures of each line of  business’s riskiness.
RAROC/RORAC …often used interchangeably, but are formally defined as follows: Risk adjust return on capital (RAROC) RAROC = Risk-adjusted income / Allocated capital Using this method, income is adjust for risk. Typically, income is adjusted for expected losses. Return on risk adjusted capital (RORAC) RORAC = Net income / Allocated risk capital Using this method, capital is adjusted for risk. Typically, capital is adjusted for a maximum potential loss based on the probability of future returns or volatility of earnings.
Example:  PNC reported results for seven distinct lines of business Banking Businesses Regional Community Banking  Corporate Banking  PNC Real Estate Finance  PNC Business Credit  Asset Management and Processing PNC Advisors  BlackRock  PFPC.  The data were obtained from PNC’s management accounting system based on internal assumptions about revenue and expense allocations and assignment of equity to each line of business.
PNC’s profitability analysis for 2000-2001
Two lines of business for PNC are detailed Corporate Banking  …represents products and services provided nationally in the areas of credit, equipment leasing, treasury management, and capital markets products to large and mid-sized corporations and government entities. Community Banking …encompasses the bank’s traditional deposit, branch-based brokerage, electronic banking and credit products to retail customers along with products to small businesses such that it is primarily a deposit-generating unit.
PNC’s Profitability Analysis for 2000-2001 (cont.)
Transfer pricing …the interest rate at which a firm could buy or sell funds in the external capital markets. When management creates balance sheets for each line of business, it must allocate capital as well as assets or liabilities to make the balance sheet balance. It must then assign a cost or yield to each of these components to produce income statement for each line of business.
Transfer pricing systems Banks use internal funds transfer pricing systems to assign asset yields and cost of funds to different lines of business and products.  Most systems use a matched maturity framework that assigns rates by identifying the effective maturity of the underlying assets or liabilities and assigning a rate obtained from a money or capital market instrument of the same maturity.
Example :  I nternal funds transfer pricing 2-year loan financed by a 3-month deposit
Risk-adjusted income and economic income Two adjustments are frequently made to income in line of business profitability analysis: The return is adjusted for risk by subtracting expected losses The return nets out required returns expected by stockholders. This minimum required return, or cost of equity, represents a hurdle rate, or stockholders’ minimum required rate of return.  The specific concern is whether RAROC is greater than the firm’s cost of equity.
Allocated risk capital …The objective of RAROC analysis is to assist in risk management and the evaluation of line of business performance. As part of this, it is necessary to assign capital to each line of business. Banks allocate risk capital by: Regulatory risk-based capital standards Asset size Benchmarking versus “pure-play” stand-alone businesses Perceived riskiness of the business unit Unfortunately, most lines of business do not have market value balance sheets.  Hence, many banks focus on the volatility in economic earnings ( earnings-at-risk ) or estimate a value-at-risk figure.
Earnings-at-risk …the volatility of earnings from a line of business. Securities underwriting and letters of credit (guarantees) against customer exposures at a large bank do not require much capital to support day-to-day operations.  But before a bank can actively engage in this business, it must have a strong credit and bond rating, which requires a substantial amount of risk capital.  One way to measure the required risk capital is to relate it to the volatility of earnings from this line of business; i.e., earnings-at-risk.
Earnings-at-risk applied to loans Using historical data for each of the past 30 months, estimate revenues obtained directly from these loans. Using historical data for each of the past 30 months, estimate direct expenses from offering these services and expected losses.  Using the 60 observations for revenues minus expenses and losses, estimate one standard deviation of earnings.  This is earnings-at-risk. Estimate risk capital as one (or two) standard deviation of earnings, divided by the risk-free interest rate.
Allocating risk capital based on earnings volatility:  Securities underwriting and letters of credit division Monthly Revenue Less Expenses (in millions of $) Most Recent 30 Months Observations: 4, 3, 4.5, 5, 5.2, 4.6, 3.9, 4.3, 5, 4.7, 5.1, 5.4, 5, 4.5, 4.4,  4.8, 5, 5.5, 5.3, 5.1, 5, 5.4, 5.7, 6.3, 6, 5.8, 5.5, 5.9, 5.5, 6.4 Mean: $5.06 million Standard Deviation: $0.735 million Allocated Risk Capital Assuming a risk-free rate of 5.5% (annual): (0.055 / 12) x Risk Capital = $ 0.735 million     Risk Capital = $160.364 million RORAC for the Most Recent Month Revenue minus expense of $6.4 million RORAC = 6.4 / 160.364 = 0.0399 monthly,    or 47.89% annually Economic Income Assuming a hurdle rate of 12% annually, economic income net of the capital charge: $6.4 - (.12/12) $160.364 = $4.796 million
Management of market risk …market risk is the risk of loss to earnings and capital related to changes in the market values of bank assets, liabilities, and off-balance sheet positions. In January 1998, bank regulators imposed capital requirements against the  market risk  associated with large banks’ trading positions.  The requirements apply to any U.S. bank or bank holding company that has a trading account in excess of $1 billion or accounts for 10 percent or more of bank assets. Typically, market risk arises from taking positions and dealing in foreign exchange, equity, interest rate, and commodity markets, and the items affected are the securities trading account, derivatives positions, and foreign exchange positions.  The new capital requirements address market risk associated with a bank’s trading activities.
Value-at-risk estimate for foreign exchange Identify the maximum expected loss given the bank’s recent history of daily returns on the trading portfolio.  Empirical distribution approach to value-at-risk involves: 1. Identify the lowest 1    % of daily price    moves.  2. Assuming that the    value of the 1%    lowest price move is    7.54 percent, 99    percent of the daily    returns exceed this    figure.
Value-at-risk estimates for market risk associated with the trading portfolios at Credit Suisse First Boston (CSFB) in 1999 and 2000.
Some analysts criticize traditional earnings measures such as ROE, ROA, and EPS because they provide no information about how a bank’s management is adding to shareholder value. If the objective of the firm is to maximize stockholders’ wealth, such measures do not indicate whether stockholder wealth has increased over time, let alone whether it has been maximized.  Stern, Stewart & Company has introduced the concepts of market value added (MVA) and its associated economic value added (EVA) in an attempt to directly link performance to shareholder wealth creation.
Economic value added (EVA) …an approach to measuring performance that compares a bank’s (or line of business) net operating profit after-tax (NOPAT) with a capital charge.  Economic Value Added (EVA) is the capital charge which represents the required return to stockholders assuming a specific allocated risk capital amount.
Market and economic value added MVA represents the increment to market value and is determined by the present value of current and expected economic profit: Stern Stewart and Company measures economic profit with EVA, which is equal to a firm's operating profit minus the charge for the cost of capital: where  the capital charge equals the product of the firm’s value of capital and the associated cost of capital. MVA = Mkt Value of  Capital  -  Hist. Amt of Invested Capital EVA  =  Net Operating Profit After Tax (NOPAT) - Capital Charge
Difficulties in measuring EVA for the entire bank It is often difficult to obtain an accurate measure of a firm's cost of capital.  The amount of bank capital includes not just stockholders' equity, but also includes loan loss reserves, deferred (net) tax credits, non-recurring items such as restructuring charges and unamortized securities gains.  NOPAT should reflect operating profit associated with the current economics of the firm. Thus, traditional GAAP-based accounting data, which distort true profits, must be modified to obtain estimates of economic profit.
EVA  c alculation For Ameribank
EVA calculation for  a meribank after sale of   $1 billion in credit card loans
Balanced scorecard One of the recent dramatic shifts in strategic thinking by management has recently produced a new approach to performance measurement at many firms, both financial and nonfinancial.  The primary catalyst is an appreciation that financial measures alone do not provide sufficient information regarding a firm’s overall performance.  In addition to profit and risk measures, managers need benchmarks and targets for efforts and activities related to: customer satisfaction,  employee satisfaction,  organizational innovation, and  the development of business processes.  This is particularly true if a bank is customer-focused.  Should management target and measure performance along the lines of: market share,  service quality,  customer profitability,  sales performance, and  customer satisfaction?
Balanced scorecard framework with four blocks Financial Performance:  How Do Stockholders View Our Risk and Return Profile? Customer Performance:  How Do Customers See Us? Internal Process Management:  At What Must We Excel? Innovation and Learning:  How Can We Continue to Improve and Create Value?
Scorecard measures
ALTERNATIVE MODELS OF BANK PERFORMANCE Chapter 4 Bank Management ,   5th edition. Timothy W. Koch and S. Scott MacDonald Copyright © 2003 by South-Western, a division of Thomson Learning

Ch04

  • 1.
    ALTERNATIVE MODELS OFBANK PERFORMANCE Chapter 4 Bank Management , 5th edition. Timothy W. Koch and S. Scott MacDonald Copyright © 2003 by South-Western, a division of Thomson Learning
  • 2.
    Traditional bank performanceanalysis carries three basic flaws It ignores the wide diversity in strategies pursued by different institutions A bank’s total assets no longer serve as a meaningful yardstick when banks engage in off-balance sheet activities The analysis provides no direct information concerning how or which of the bank’s activities contribute to the creation of shareholder value
  • 3.
    Wide diversity instrategies pursued by different institutions When UBPRs were introduced, most banks did similar things, which were reflected in their balance sheet They accepted deposits and made loans, and many interest rates were regulated The primary differentiation of performance was balance sheet composition Today, banks may pursue sharply different strategies
  • 4.
    Bank’s total assetsno longer serve as a meaningful yardstick when banks engage in off-balance sheet activities Consider the situation where two banks report the same asset size, but one also has an extensive mortgage-servicing operation that generates servicing income If the bank with mortgage-servicing makes a profit on this activity, it will report a higher ROA, ceteris paribus, due to the higher noninterest income for mortgage-servicing fees
  • 5.
    The analysis providesno direct information concerning how or which of the bank’s activities contribute to the creation of shareholder value It similarly ignores other performance benchmarks that customer-focused managers must consider to identify the best strategies going forward
  • 6.
    Although ROA mightbe a biased indicator of performance, return on equity (ROE) doesn’t suffer from the same weaknesses. When considering the entire bank, stockholders’ equity must support all activities, whether on- or off-balance sheet. Thus, a comparison of net income to equity captures the returns to owners’ contributions.
  • 7.
    The appropriate peergroup …as long as banks have a similar strategic focus and offer similar products and services, asset size and UBPR ratios can provide meaningful comparisons. To identify the appropriate peer institutions, management should consider the following: What is the bank’s strategic focus? What are the traditional balance sheet and off-balance sheet characteristics of firms with this focus? How do the bank’s activities affect its operating revenue?
  • 8.
    A common startingpoint is to determine whether the bank’s strategy is more loan-driven or deposit-driven. A loan-driven bank’s profitability is generally a function of net interest income (the margin) with loan volume a major factor. A deposit-driven bank’s profitability is generally a function of noninterest income with franchise value and deposit volume a major factor.
  • 9.
    A loan drivenbank finds that: asset size is determined by loan demand profitability is determined by loan economics; i.e., loan yields versus cost of fund loan margin is high as well as noninterest expense the culture is typically “our bank underwrites loans better than other banks” value is typically some multiple of core earnings
  • 10.
    A deposit drivenbank typically finds that: asset size is determine by the growth in core deposits value is determined by the bank’s franchise value -- measured by the market share of low-cost core deposits lower interest income, interest margins and noninterest expenses lower loan losses
  • 11.
    Evaluating performance usingGAAP-based data and UBPR ratios …a bank should compare its ratios with those from a select sample of peer institutions that are similarly loan-driven or deposit-driven. Peers should operate the same approximate number of offices in the same metropolitan or non-metropolitan markets and have the same product and service mix. Asset-based ratios are thus directly comparable. Analysts can easily construct peer bank averages by direct comparison to other similar bank’s UBPR’s or by using the FDIC’s Statistics on Depository Institutions (SDI) system at: http://www3.fdic.gov/sdi/
  • 12.
    One way toconstruct ratios that avoid the problems of off-balance sheet activities is to calculate ratios tied to a bank’s total operating revenue (net interest income plus noninterest income) - - (David Cates (1996)) Fundamentally this means calculate performance measures using total operating revenue as the denominator rather than assets. Here, total operating revenue equals the sum of net interest income and noninterest income.
  • 13.
    The efficiencyratio …measured as noninterest expense divided by total operating revenue, is a popular measure used by stock analysis based on operating revenue rather than assets. Analysts strongly encourage banks, regardless of size, to meet fairly specific targets in this ratio. Because operating revenue includes both interest income and noninterest (fee-based) income, it captures all activities. Efficiency Ratio = noninterest expense / net operating revenue where net operating revenue = the sum of net interest income + noninterest income.
  • 14.
    Bank stock analystsfollow a standard procedure when evaluating firm performance Initially use GAAP-based financial information to calculate performance measures adjust the data to omit the impact of nonrecurring items, such as one-time asset sales and restructuring charges compare these historical ratios with a carefully selected group of peer institutions, matching each bank’s primary strategic focus Based on his or her own analysis and conversations with specialists within the bank, the analyst then assesses the quality of earnings based on: their sustainability the bank’s market power in specific product or service areas the bank’s franchise value The next step is to forecast earnings, cash flow, and market value of equity over a three- to five-year time horizon Finally, the analyst makes a stock recommendation: accumulate (buy) neutral (hold) below-market performance (sell)
  • 15.
    It is extremelyrare, however, to see an outright sell recommendation because analysts want to remain in the good graces of the banks that they follow Thus, they do not formally recommend selling the stock, but rather label it as likely to exhibit below-market performance. A hold recommendation thus actually means “sell the stock” for most analysts. The recent failure of Enron is potentially an example of the conflict of interest “buy-side” and “sell-side” analysts have.
  • 16.
    Investors in bankstocks are primarily concerned with whether the bank’s management is creating value for stockholders. When analysts compare performance over some historical period, they are less concerned with ROE, ROA, and efficiency ratios – rather the overall total return from investing in the bank’s stock . Total return equals dividends received plus stock price appreciation/depreciation relative to the initial investment.
  • 17.
    Return to stockholders = (  price + dividends) / price t-1 Earnings per share Price to earnings (P/E) = stock price / EPS Price to book value = stock price / book value per share Market value (MV) of equit y = MV of assets - MV of liabilities or = # share of common stock x stock price Key stock market-based performance measures include
  • 18.
    Example: buy 100 shares of PNC Financial at the beginning of 2001 for $73.06. The bank paid $1.92 per share in dividends that generated reinvestment income of $.09. At the end of 2001, the price of stock was $56.20. Return to stockholders in 2001 was -20.3%. 0.203 = [$56.20 - $73.06 + $2.01] ÷ $73.06
  • 19.
    Balanced scorecard …performancemeasures that look beyond just financial measures The balanced scorecard is an attempt to balance management decisions based on financial measures with decisions based on a firm’s relationships with its customers and the effectiveness of support processes in designing and delivering products and services The result is that line of business managers use indicators such as: market share, customer retention and attrition, customer profitability, and service quality to evaluate performance Internally, they also track productivity and employee satisfaction Such nonfinancial indicators provide information regarding whether a bank is truly customer-focused and whether its systems are appropriate
  • 20.
    Operationalize the balancedscorecard …divide the bank into a Customer Bank and a House Bank Income derived from balance sheet and income statement items that are derived from bank customers determines The Customer Bank Items that arise when the bank is its own customer determines The House Bank
  • 21.
    Two banks inone house Traditional or Customer Bank, activities include: most loans, core deposits, payment services, credit enhancements, asset management, and financial advisory. Investment or House Bank, activities include: the investment portfolio, noncore, purchased liabilities, loan participations, asset sales, servicing, and bank-sponsored mutual funds. Items are assigned based on whether the underlying activities pertain to bank customers (Customer Bank) or the bank itself (Investment Bank). Evaluate the returns on each Bank relative to the risks and relevant benchmarks.
  • 22.
    Line of businessprofitability analysis … By allocate operating expenses to activities that support bank customers and bank management, banks can obtain at least a rough estimate of segment net income. Leads to the reporting and use of both financial and nonfinancial performance data, based on specific customers. Many banks attempt to measure profitability by: type of loan customer (small business, middle market, consumer installment, etc.) type of depositor; by characteristics of the relationship (account longevity, cross-sell patterns, profitability, etc.) and delivery system (branch, ATM, tele-phone, home banking, etc.).
  • 23.
    RAROC/RORAC analysis …RAROCrefers to risk-adjusted return on capital, while RORAC refers to return on risk-adjusted capital. In order to analyze profitability and risk precisely, each line of business must have its own balance sheet and income statement. These statements are difficult to construct because many nontraditional activities, such as trust and mortgage-servicing, do not explicitly require any direct equity support. Even traditional activities, such as commercial lending and consumer banking, complicate the issue because these business units do not have equal amounts of assets and liabilities generated by customers. The critical issue is to determine how much equity capital to assign each unit.
  • 24.
    Assigning equity capitalto each unit Alternative capital allocation methods include: using regulatory risk-based capital standards assignment based on the size of assets benchmarking each unit to “pure-play” peers that are stand-alone, publicly held firms; and measures of each line of business’s riskiness.
  • 25.
    RAROC/RORAC …often usedinterchangeably, but are formally defined as follows: Risk adjust return on capital (RAROC) RAROC = Risk-adjusted income / Allocated capital Using this method, income is adjust for risk. Typically, income is adjusted for expected losses. Return on risk adjusted capital (RORAC) RORAC = Net income / Allocated risk capital Using this method, capital is adjusted for risk. Typically, capital is adjusted for a maximum potential loss based on the probability of future returns or volatility of earnings.
  • 26.
    Example: PNCreported results for seven distinct lines of business Banking Businesses Regional Community Banking Corporate Banking PNC Real Estate Finance PNC Business Credit Asset Management and Processing PNC Advisors BlackRock PFPC. The data were obtained from PNC’s management accounting system based on internal assumptions about revenue and expense allocations and assignment of equity to each line of business.
  • 27.
  • 28.
    Two lines ofbusiness for PNC are detailed Corporate Banking …represents products and services provided nationally in the areas of credit, equipment leasing, treasury management, and capital markets products to large and mid-sized corporations and government entities. Community Banking …encompasses the bank’s traditional deposit, branch-based brokerage, electronic banking and credit products to retail customers along with products to small businesses such that it is primarily a deposit-generating unit.
  • 29.
    PNC’s Profitability Analysisfor 2000-2001 (cont.)
  • 30.
    Transfer pricing …theinterest rate at which a firm could buy or sell funds in the external capital markets. When management creates balance sheets for each line of business, it must allocate capital as well as assets or liabilities to make the balance sheet balance. It must then assign a cost or yield to each of these components to produce income statement for each line of business.
  • 31.
    Transfer pricing systemsBanks use internal funds transfer pricing systems to assign asset yields and cost of funds to different lines of business and products. Most systems use a matched maturity framework that assigns rates by identifying the effective maturity of the underlying assets or liabilities and assigning a rate obtained from a money or capital market instrument of the same maturity.
  • 32.
    Example : I nternal funds transfer pricing 2-year loan financed by a 3-month deposit
  • 33.
    Risk-adjusted income andeconomic income Two adjustments are frequently made to income in line of business profitability analysis: The return is adjusted for risk by subtracting expected losses The return nets out required returns expected by stockholders. This minimum required return, or cost of equity, represents a hurdle rate, or stockholders’ minimum required rate of return. The specific concern is whether RAROC is greater than the firm’s cost of equity.
  • 34.
    Allocated risk capital…The objective of RAROC analysis is to assist in risk management and the evaluation of line of business performance. As part of this, it is necessary to assign capital to each line of business. Banks allocate risk capital by: Regulatory risk-based capital standards Asset size Benchmarking versus “pure-play” stand-alone businesses Perceived riskiness of the business unit Unfortunately, most lines of business do not have market value balance sheets. Hence, many banks focus on the volatility in economic earnings ( earnings-at-risk ) or estimate a value-at-risk figure.
  • 35.
    Earnings-at-risk …the volatilityof earnings from a line of business. Securities underwriting and letters of credit (guarantees) against customer exposures at a large bank do not require much capital to support day-to-day operations. But before a bank can actively engage in this business, it must have a strong credit and bond rating, which requires a substantial amount of risk capital. One way to measure the required risk capital is to relate it to the volatility of earnings from this line of business; i.e., earnings-at-risk.
  • 36.
    Earnings-at-risk applied toloans Using historical data for each of the past 30 months, estimate revenues obtained directly from these loans. Using historical data for each of the past 30 months, estimate direct expenses from offering these services and expected losses. Using the 60 observations for revenues minus expenses and losses, estimate one standard deviation of earnings. This is earnings-at-risk. Estimate risk capital as one (or two) standard deviation of earnings, divided by the risk-free interest rate.
  • 37.
    Allocating risk capitalbased on earnings volatility: Securities underwriting and letters of credit division Monthly Revenue Less Expenses (in millions of $) Most Recent 30 Months Observations: 4, 3, 4.5, 5, 5.2, 4.6, 3.9, 4.3, 5, 4.7, 5.1, 5.4, 5, 4.5, 4.4, 4.8, 5, 5.5, 5.3, 5.1, 5, 5.4, 5.7, 6.3, 6, 5.8, 5.5, 5.9, 5.5, 6.4 Mean: $5.06 million Standard Deviation: $0.735 million Allocated Risk Capital Assuming a risk-free rate of 5.5% (annual): (0.055 / 12) x Risk Capital = $ 0.735 million Risk Capital = $160.364 million RORAC for the Most Recent Month Revenue minus expense of $6.4 million RORAC = 6.4 / 160.364 = 0.0399 monthly, or 47.89% annually Economic Income Assuming a hurdle rate of 12% annually, economic income net of the capital charge: $6.4 - (.12/12) $160.364 = $4.796 million
  • 38.
    Management of marketrisk …market risk is the risk of loss to earnings and capital related to changes in the market values of bank assets, liabilities, and off-balance sheet positions. In January 1998, bank regulators imposed capital requirements against the market risk associated with large banks’ trading positions. The requirements apply to any U.S. bank or bank holding company that has a trading account in excess of $1 billion or accounts for 10 percent or more of bank assets. Typically, market risk arises from taking positions and dealing in foreign exchange, equity, interest rate, and commodity markets, and the items affected are the securities trading account, derivatives positions, and foreign exchange positions. The new capital requirements address market risk associated with a bank’s trading activities.
  • 39.
    Value-at-risk estimate forforeign exchange Identify the maximum expected loss given the bank’s recent history of daily returns on the trading portfolio. Empirical distribution approach to value-at-risk involves: 1. Identify the lowest 1 % of daily price moves. 2. Assuming that the value of the 1% lowest price move is 7.54 percent, 99 percent of the daily returns exceed this figure.
  • 40.
    Value-at-risk estimates formarket risk associated with the trading portfolios at Credit Suisse First Boston (CSFB) in 1999 and 2000.
  • 41.
    Some analysts criticizetraditional earnings measures such as ROE, ROA, and EPS because they provide no information about how a bank’s management is adding to shareholder value. If the objective of the firm is to maximize stockholders’ wealth, such measures do not indicate whether stockholder wealth has increased over time, let alone whether it has been maximized. Stern, Stewart & Company has introduced the concepts of market value added (MVA) and its associated economic value added (EVA) in an attempt to directly link performance to shareholder wealth creation.
  • 42.
    Economic value added(EVA) …an approach to measuring performance that compares a bank’s (or line of business) net operating profit after-tax (NOPAT) with a capital charge. Economic Value Added (EVA) is the capital charge which represents the required return to stockholders assuming a specific allocated risk capital amount.
  • 43.
    Market and economicvalue added MVA represents the increment to market value and is determined by the present value of current and expected economic profit: Stern Stewart and Company measures economic profit with EVA, which is equal to a firm's operating profit minus the charge for the cost of capital: where the capital charge equals the product of the firm’s value of capital and the associated cost of capital. MVA = Mkt Value of Capital - Hist. Amt of Invested Capital EVA = Net Operating Profit After Tax (NOPAT) - Capital Charge
  • 44.
    Difficulties in measuringEVA for the entire bank It is often difficult to obtain an accurate measure of a firm's cost of capital. The amount of bank capital includes not just stockholders' equity, but also includes loan loss reserves, deferred (net) tax credits, non-recurring items such as restructuring charges and unamortized securities gains. NOPAT should reflect operating profit associated with the current economics of the firm. Thus, traditional GAAP-based accounting data, which distort true profits, must be modified to obtain estimates of economic profit.
  • 45.
    EVA calculation For Ameribank
  • 46.
    EVA calculation for a meribank after sale of $1 billion in credit card loans
  • 47.
    Balanced scorecard Oneof the recent dramatic shifts in strategic thinking by management has recently produced a new approach to performance measurement at many firms, both financial and nonfinancial. The primary catalyst is an appreciation that financial measures alone do not provide sufficient information regarding a firm’s overall performance. In addition to profit and risk measures, managers need benchmarks and targets for efforts and activities related to: customer satisfaction, employee satisfaction, organizational innovation, and the development of business processes. This is particularly true if a bank is customer-focused. Should management target and measure performance along the lines of: market share, service quality, customer profitability, sales performance, and customer satisfaction?
  • 48.
    Balanced scorecard frameworkwith four blocks Financial Performance: How Do Stockholders View Our Risk and Return Profile? Customer Performance: How Do Customers See Us? Internal Process Management: At What Must We Excel? Innovation and Learning: How Can We Continue to Improve and Create Value?
  • 49.
  • 50.
    ALTERNATIVE MODELS OFBANK PERFORMANCE Chapter 4 Bank Management , 5th edition. Timothy W. Koch and S. Scott MacDonald Copyright © 2003 by South-Western, a division of Thomson Learning