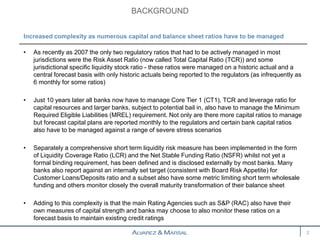
2. I. Background
II. Managing to One Binding Constraint
III. Key Building Blocks for Success
IV. Schematic
V. Design Considerations
VI. What Does Good Look Like?
VII. Q&A
CONTENTS
1
3. • As recently as 2007 the only two regulatory ratios that had to be actively managed in most
jurisdictions were the Risk Asset Ratio (now called Total Capital Ratio (TCR)) and some
jurisdictional specific liquidity stock ratio - these ratios were managed on a historic actual and a
central forecast basis with only historic actuals being reported to the regulators (as infrequently as
6 monthly for some ratios)
• Just 10 years later all banks now have to manage Core Tier 1 (CT1), TCR and leverage ratio for
capital resources and larger banks, subject to potential bail in, also have to manage the Minimum
Required Eligible Liabilities (MREL) requirement. Not only are there more capital ratios to manage
but forecast capital plans are reported monthly to the regulators and certain bank capital ratios
also have to be managed against a range of severe stress scenarios
• Separately a comprehensive short term liquidity risk measure has been implemented in the form
of Liquidity Coverage Ratio (LCR) and the Net Stable Funding Ratio (NSFR) whilst not yet a
formal binding requirement, has been defined and is disclosed externally by most banks. Many
banks also report against an internally set target (consistent with Board Risk Appetite) for
Customer Loans/Deposits ratio and a subset also have some metric limiting short term wholesale
funding and others monitor closely the overall maturity transformation of their balance sheet
• Adding to this complexity is that the main Rating Agencies such as S&P (RAC) also have their
own measures of capital strength and banks may choose to also monitor these ratios on a
forecast basis to maintain existing credit ratings
BACKGROUND
2
Increased complexity as numerous capital and balance sheet ratios have to be managed
4. • With a plethora of new ratios to manage, for many firms it was obvious which one of the new
ratios that was the binding constraint for their firm specific business model. Thus the initial focus
would be on managing the balance sheet primarily through that prism
• For example, some firms with balance sheets of high quality, low risk weighted assets were
mainly constrained by the new Leverage Ratio requirement. Thus projects were established to
reduce leverage through; legal changes to contracts, pricing away fine margin business such as
repo, closing certain activities/products. It is precisely these changes to bank behaviour that have
led to some of the opportunities for new funds and FinTechs to enter these markets
• For many other firms the most important ratio to manage was the CT1 ratio - on both a BAU and
stress test basis. In fact it was often the stress test version that was the binding constraint on
capital resources. The initial focus was on identifying loan portfolios that were ‘capital heavy’ in
stress scenarios with a view to disposal
• For many firms enormous progress has been made on managing that initial constraint e.g.
Nationwide BS leverage ratio has increased from 2.6% on a fully loaded basis as at 4/4/2013 to
4.2% on a CRR leverage ratio basis as at 4/4/2017. The consequence of the initial binding
constraint falling away is that such firms now enter a more complex world of how to optimise
portfolio and funding choices in a world of more than one risk/reward measure with numerous
boundary limitations to respect?
MANAGING TO ONE BINDING CONSTRAINT
3
Initial focus for many firms has been on managing one ‘all important’ binding constraint
5. • The development of a Strategic Balance Sheet Optimisation (BSO) capability requires the pulling
together of some of the capabilities of what in some banking groups are still in up to 5 different
teams namely; Capital Planning, Balance Sheet Management, IRRBB, Credit Portfolio Modelling
and Stress Testing. Will also require close working with Group Financial Planning, Group Risk
and Group Strategy
• The core modelling skills may primarily come from the existing IRRBB and Credit Portfolio
Modelling teams
• Obtaining a very senior Executive Sponsor such as the CFO is key to getting internal buy-in and
overcoming internal political boundaries
• The key to a successful strategic balance sheet optimisation model is the ability to turn around
what if questions from senior stakeholders in a timely manner. Thus it is imperative that expert
judgement is used in the design phase to keep the data set down to a manageable size
• Spend the necessary time on getting the key business requirements written down and then
approved by the key stakeholders
• Run a transparent and comprehensive modelling tool selection process – don’t let one internal
vested interest dominate the process
KEY BUILDING BLOCKS FOR SUCCESS
4
A KSF in the build phase is getting the right senior Executive Sponsor
6. SCHEMATIC
5
Schematic showing the key Input Sources for Strategic BSO
Strategic BSO
Markets &
Economy
Group
Financial
Planning
Stress
Testing
Unit
Regulators Board
Key
Stakeholders
e.g. GALCo
Data
Warehouse
Outputs
Source
Data
Internal
Limits
External
Constraints
Business
Forecasts
Stress
Assumptions
What if
questions?
Macro-
economic data
7. • There are strong arguments for keeping the model simple at least initially and not trying to
allocate balance sheet costs (via FTP) and other operating costs to the product level
• The model can be used to make incremental portfolio decisions using incremental income and
cost numbers e.g. grow the mortgage book by say additional 10% will generate additional
interest income, additional interest expense and some additional operating costs – in fact
Strategic BSO could postulate a number of different funding options to illustrate both the
incremental risk/reward and the impact on key balance sheet ratios to give say GALCo the final
choice as to funding strategy
• To ensure credibility it is key that balance sheet growth assumptions are aligned to the core
finance budgeting and reforecast process. It is also important that effort is expended in
understanding any differences that arise in forecast interest paid and interest received between
the SBSO model and the Divisional Finance teams
• Whilst Group consolidated modelling will be important so will material banking subsidiaries (some
subject to materially different constraints)
• Simplified versions of the model can be run for specific purposes e.g. it may be preferable to
calculate net interest income sensitivity against internal limits using a constant balance sheet
assumption
DESIGN CONSIDERATIONS
6
Invest the necessary time in agreeing the key design features up-front
8. The signs of a mature fully functioning Strategic Balance Sheet Optimisation capability include:
(i) fully integrated to the Group Finance budgeting and planning process
(ii) used regularly by key internal stakeholders e.g. GALCo to answer what if questions/ad hoc
requests
(iii) the capability becomes proactive supporting proposals to GALCo for say changes to asset
portfolios and/or changes to liability mix with not only the P&L consequence but also the
balance sheet and capital consequences in both BAU and stress scenarios
(iv) active liability management not just asset portfolio choices
(v) ability to re-allocate capital in a timely manner (this almost certainly needs a change in internal
performance measures to encourage this behaviour by BUs)
(vi) ability to make product choices based on a full understanding of the risk/reward analysis, this
will require FTP and cost allocation – made more difficult where cross subsidy is going on e.g.
Revolving Credit Facilities being used to gain profitable derivatives activity
(vii) ability to model the key banking legal entities within the Group to reduce trapped liquidity/capital
(viii) development of stochastic modelling to complement the deterministic modelling
(ix) the nature of GALCo changes as it becomes more pro-active in the strategic management of
the balance sheet
(x) don’t forget the importance of interest rate risk in designing optimal strategies
WHAT DOES GOOD LOOK LIKE?
7
As the SBSO capability matures the following features/functionality should arise
9. • How many of the banks here today either have or are establishing a Strategic Balance Sheet
Optimisation team?
• For those that have is GALCo the main customer?
• For those that haven’t why do you think so few banks have yet established such capabilities
when they make good logical economic sense?
• How can we best overcome the barriers?
• Any questions for me and or comments?
Q&A
8
Chance for you to work!