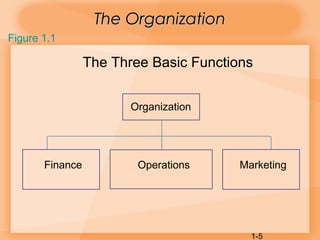
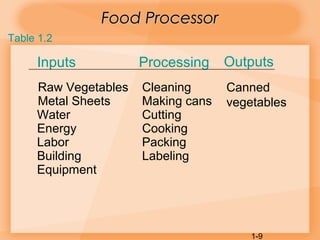
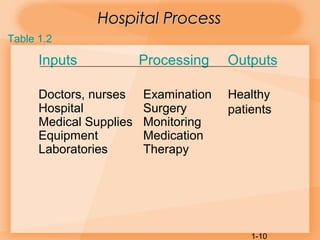
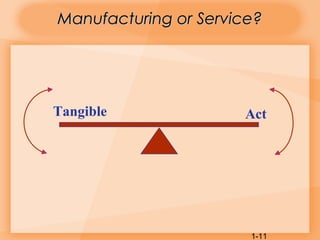
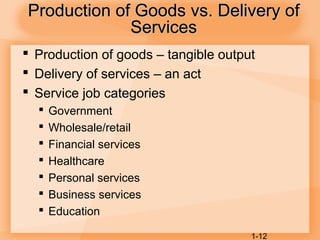
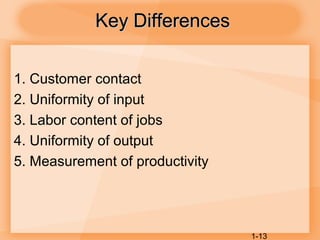
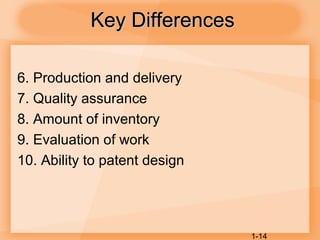
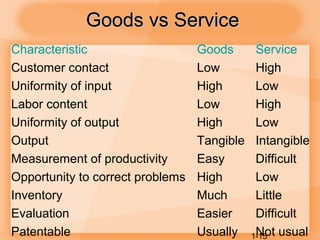
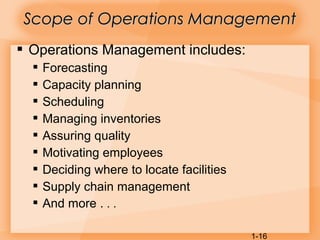
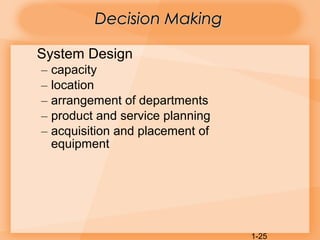
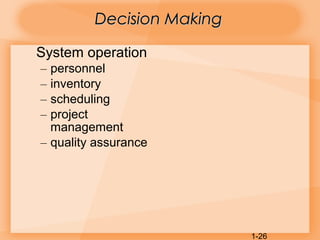
McGraw-Hill/Irwin Copyright © 2007 by The McGraw-Hill Companies, Inc. All rights reserved.
11
Introduction to
Operations
Management
1-2
Learning ObjectivesLearning Objectives
 Define the term operations management
 Identify the three major functional areas of
organizations and describe how they
interrelate
 Compare and contrast service and
manufacturing operations
 Describe the operations function and the
nature of the operations manager’s job
1-3
Learning ObjectivesLearning Objectives
 Differentiate between design and operation
of production systems
 Describe the key aspects of operations
management decision making
 Briefly describe the historicalevolution of
operations management
 Identify current trends that impact operations
management
1-4
Operations ManagementOperations Management
 Operations Management is:
The management of systems or processes
that create goods and/or provide services
 Operations Management affects:
 Companies’ ability to compete
 Nation’s ability to compete internationally
1-5
The OrganizationThe Organization
The Three Basic Functions
Organization
Finance Operations Marketing
Figure 1.1
1-6
Value-Added ProcessValue-Added Process
The operations function involves the conversion of
inputs into outputs
Inputs
Land
Labor
Capital
Transformation/
Conversion
process
Outputs
Goods
Services
Control
Feedback
FeedbackFeedback
Value added
Figure 1.2
1-7
Value-Added & ProductValue-Added & Product
PackagesPackages
 Value-added is the difference between the
cost of inputs and the value or price of
outputs.
 Product packages are a combination of
goods and services.
 Product packages can make a company
more competitive.
1-8
Automobile assembly, steel making
Home remodeling, retail sales
Automobile Repair, fast food
Goods-service ContinuumGoods-service Continuum
Figure 1.3
Computer repair, restaurant meal
Song writing, software development
Goods Service
Surgery, teaching
1-9
Food ProcessorFood Processor
Inputs Processing Outputs
Raw Vegetables Cleaning Canned
vegetablesMetal Sheets Making cans
Water Cutting
Energy Cooking
Labor Packing
Building Labeling
Equipment
Table 1.2
1-10
Hospital ProcessHospital Process
Inputs Processing Outputs
Doctors, nurses Examination Healthy
patientsHospital Surgery
Medical Supplies Monitoring
Equipment Medication
Laboratories Therapy
Table 1.2
1-11
Manufacturing or Service?Manufacturing or Service?
Tangible Act
1-12
Production of Goods vs. Delivery ofProduction of Goods vs. Delivery of
ServicesServices
 Production of goods – tangible output
 Delivery of services – an act
 Service job categories
 Government
 Wholesale/retail
 Financial services
 Healthcare
 Personal services
 Business services
 Education
1-13
Key DifferencesKey Differences
1. Customer contact
2. Uniformity of input
3. Labor content of jobs
4. Uniformity of output
5. Measurement of productivity
1-14
Key DifferencesKey Differences
6. Production and delivery
7. Quality assurance
8. Amount of inventory
9. Evaluation of work
10. Ability to patent design
1-15
Goods vs ServiceGoods vs Service
Characteristic Goods Service
Customer contact Low High
Uniformity of input High Low
Labor content Low High
Uniformity of output High Low
Output Tangible Intangible
Measurement of productivity Easy Difficult
Opportunity to correct problems High Low
Inventory Much Little
Evaluation Easier Difficult
Patentable Usually Not usual
1-16
 Operations Management includes:
 Forecasting
 Capacity planning
 Scheduling
 Managing inventories
 Assuring quality
 Motivating employees
 Deciding where to locate facilities
 Supply chain management
 And more . . .
Scope of Operations ManagementScope of Operations Management
1-17
Types of OperationsTypes of Operations
Table 1.4
Operations Examples
Goods Producing Farming, mining, construction,
manufacturing, power generation
Storage/Transportation Warehousing, trucking, mail
service, moving, taxis, buses,
hotels, airlines
Exchange Retailing, wholesaling, banking,
renting, leasing, library, loans
Entertainment Films, radio and television,
concerts, recording
Communication Newspapers, radio and television
newscasts, telephone, satellites
1-18
Year Mfg. Service
45 79 21
50 72 28
55 72 28
60 68 32
65 64 36
70 64 36
75 58 42
80 44 46
85 43 57
90 35 65
95 25 75
00 30 70
02 25 75
U.S. Manufacturing vs. Service Employment
0
10
20
30
40
50
60
70
80
90
45 50 55 60 65 70 75 80 85 90 95 00 02 05
Year
Percent
Mfg.
Service
Figure 1.4
1-19
Decline in Manufacturing JobsDecline in Manufacturing Jobs
 Productivity
 Increasing productivity allows companies to
maintain or increase their output using fewer
workers
 Outsourcing
 Some manufacturing work has been outsourced
to more productive companies
1-20
Why Manufacturing MattersWhy Manufacturing Matters
 Over 18 million workers in manufacturing
jobs
 Accounts for over 70% of value of U.S.
exports
 Average full-time compensation about 20%
higher than average of all workers
 Manufacturing workers more likely to have
benefits
 Productivity growth in manufacturing in the
last 5 years is more than double U.S.
economy
1-21
Why Manufacturing MattersWhy Manufacturing Matters
 More than half of the total R&D performed is
in the manufacturing industries
 Manufacturing workers in California earn an
average of about $25,000 more a year than
service workers
 When a California manufacturing job is lost,
an average of 2.5 service jobs are lost
1-22
Challenges of ManagingChallenges of Managing
ServicesServices
 Service jobs are often less structured than
manufacturing jobs
 Customer contact is higher
 Worker skill levels are lower
 Services hire many low-skill, entry-level workers
 Employee turnover is higher
 Input variability is higher
 Service performance can be affected by worker’s
personal factors
1-23
Operations ManagementOperations Management
Decision MakingDecision Making
 Models
 Quantitative approaches
 Analysis of trade-offs
 Systems approach
 Establishing priorities
 Ethics
1-24
Key Decisions of OperationsKey Decisions of Operations
ManagersManagers
 What
What resources/what amounts
 When
Needed/scheduled/ordered
 Where
Work to be done
 How
Designed
 Who
To do the work
1-25
Decision MakingDecision Making
System Design
– capacity
– location
– arrangement of departments
– product and service planning
– acquisition and placement of
equipment
1-26
Decision MakingDecision Making
System operation
– personnel
– inventory
– scheduling
– project
management
– quality assurance

Ch01 p1 ppt

  • 1.
    McGraw-Hill/Irwin Copyright ©2007 by The McGraw-Hill Companies, Inc. All rights reserved. 11 Introduction to Operations Management
  • 2.
    1-2 Learning ObjectivesLearning Objectives Define the term operations management  Identify the three major functional areas of organizations and describe how they interrelate  Compare and contrast service and manufacturing operations  Describe the operations function and the nature of the operations manager’s job
  • 3.
    1-3 Learning ObjectivesLearning Objectives Differentiate between design and operation of production systems  Describe the key aspects of operations management decision making  Briefly describe the historicalevolution of operations management  Identify current trends that impact operations management
  • 4.
    1-4 Operations ManagementOperations Management Operations Management is: The management of systems or processes that create goods and/or provide services  Operations Management affects:  Companies’ ability to compete  Nation’s ability to compete internationally
  • 5.
    1-5 The OrganizationThe Organization TheThree Basic Functions Organization Finance Operations Marketing Figure 1.1
  • 6.
    1-6 Value-Added ProcessValue-Added Process Theoperations function involves the conversion of inputs into outputs Inputs Land Labor Capital Transformation/ Conversion process Outputs Goods Services Control Feedback FeedbackFeedback Value added Figure 1.2
  • 7.
    1-7 Value-Added & ProductValue-Added& Product PackagesPackages  Value-added is the difference between the cost of inputs and the value or price of outputs.  Product packages are a combination of goods and services.  Product packages can make a company more competitive.
  • 8.
    1-8 Automobile assembly, steelmaking Home remodeling, retail sales Automobile Repair, fast food Goods-service ContinuumGoods-service Continuum Figure 1.3 Computer repair, restaurant meal Song writing, software development Goods Service Surgery, teaching
  • 9.
    1-9 Food ProcessorFood Processor InputsProcessing Outputs Raw Vegetables Cleaning Canned vegetablesMetal Sheets Making cans Water Cutting Energy Cooking Labor Packing Building Labeling Equipment Table 1.2
  • 10.
    1-10 Hospital ProcessHospital Process InputsProcessing Outputs Doctors, nurses Examination Healthy patientsHospital Surgery Medical Supplies Monitoring Equipment Medication Laboratories Therapy Table 1.2
  • 11.
  • 12.
    1-12 Production of Goodsvs. Delivery ofProduction of Goods vs. Delivery of ServicesServices  Production of goods – tangible output  Delivery of services – an act  Service job categories  Government  Wholesale/retail  Financial services  Healthcare  Personal services  Business services  Education
  • 13.
    1-13 Key DifferencesKey Differences 1.Customer contact 2. Uniformity of input 3. Labor content of jobs 4. Uniformity of output 5. Measurement of productivity
  • 14.
    1-14 Key DifferencesKey Differences 6.Production and delivery 7. Quality assurance 8. Amount of inventory 9. Evaluation of work 10. Ability to patent design
  • 15.
    1-15 Goods vs ServiceGoodsvs Service Characteristic Goods Service Customer contact Low High Uniformity of input High Low Labor content Low High Uniformity of output High Low Output Tangible Intangible Measurement of productivity Easy Difficult Opportunity to correct problems High Low Inventory Much Little Evaluation Easier Difficult Patentable Usually Not usual
  • 16.
    1-16  Operations Managementincludes:  Forecasting  Capacity planning  Scheduling  Managing inventories  Assuring quality  Motivating employees  Deciding where to locate facilities  Supply chain management  And more . . . Scope of Operations ManagementScope of Operations Management
  • 17.
    1-17 Types of OperationsTypesof Operations Table 1.4 Operations Examples Goods Producing Farming, mining, construction, manufacturing, power generation Storage/Transportation Warehousing, trucking, mail service, moving, taxis, buses, hotels, airlines Exchange Retailing, wholesaling, banking, renting, leasing, library, loans Entertainment Films, radio and television, concerts, recording Communication Newspapers, radio and television newscasts, telephone, satellites
  • 18.
    1-18 Year Mfg. Service 4579 21 50 72 28 55 72 28 60 68 32 65 64 36 70 64 36 75 58 42 80 44 46 85 43 57 90 35 65 95 25 75 00 30 70 02 25 75 U.S. Manufacturing vs. Service Employment 0 10 20 30 40 50 60 70 80 90 45 50 55 60 65 70 75 80 85 90 95 00 02 05 Year Percent Mfg. Service Figure 1.4
  • 19.
    1-19 Decline in ManufacturingJobsDecline in Manufacturing Jobs  Productivity  Increasing productivity allows companies to maintain or increase their output using fewer workers  Outsourcing  Some manufacturing work has been outsourced to more productive companies
  • 20.
    1-20 Why Manufacturing MattersWhyManufacturing Matters  Over 18 million workers in manufacturing jobs  Accounts for over 70% of value of U.S. exports  Average full-time compensation about 20% higher than average of all workers  Manufacturing workers more likely to have benefits  Productivity growth in manufacturing in the last 5 years is more than double U.S. economy
  • 21.
    1-21 Why Manufacturing MattersWhyManufacturing Matters  More than half of the total R&D performed is in the manufacturing industries  Manufacturing workers in California earn an average of about $25,000 more a year than service workers  When a California manufacturing job is lost, an average of 2.5 service jobs are lost
  • 22.
    1-22 Challenges of ManagingChallengesof Managing ServicesServices  Service jobs are often less structured than manufacturing jobs  Customer contact is higher  Worker skill levels are lower  Services hire many low-skill, entry-level workers  Employee turnover is higher  Input variability is higher  Service performance can be affected by worker’s personal factors
  • 23.
    1-23 Operations ManagementOperations Management DecisionMakingDecision Making  Models  Quantitative approaches  Analysis of trade-offs  Systems approach  Establishing priorities  Ethics
  • 24.
    1-24 Key Decisions ofOperationsKey Decisions of Operations ManagersManagers  What What resources/what amounts  When Needed/scheduled/ordered  Where Work to be done  How Designed  Who To do the work
  • 25.
    1-25 Decision MakingDecision Making SystemDesign – capacity – location – arrangement of departments – product and service planning – acquisition and placement of equipment
  • 26.
    1-26 Decision MakingDecision Making Systemoperation – personnel – inventory – scheduling – project management – quality assurance