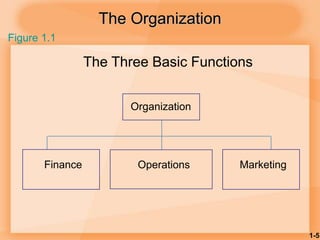
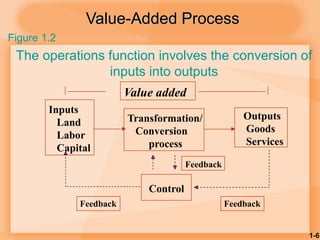
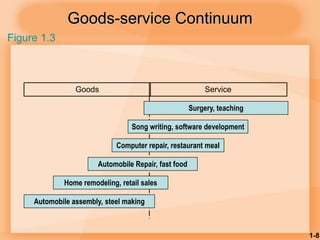
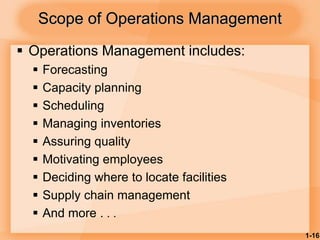
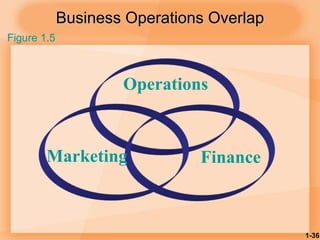
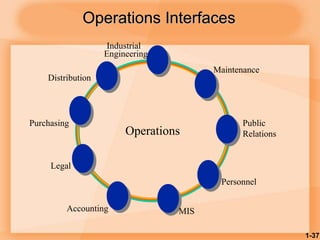
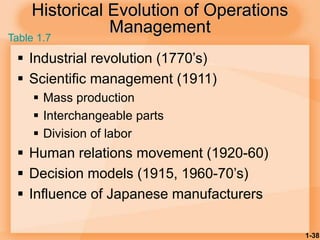
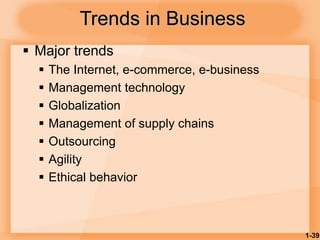
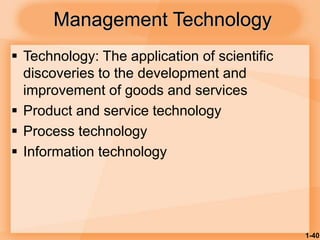
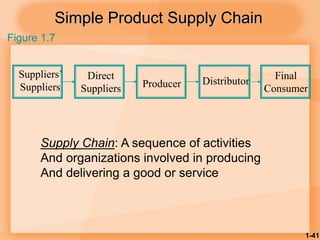
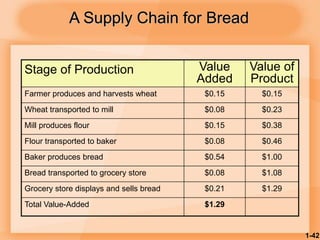
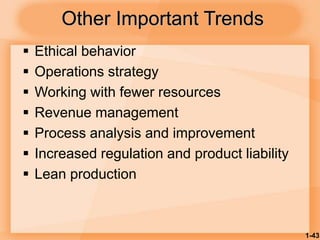
McGraw-Hill/Irwin Copyright © 2007 by The McGraw-Hill Companies, Inc. All rights reserved.
1
Introduction to
Operations
Management
1-2
Learning Objectives
 Define the term operations management
 Identify the three major functional areas of
organizations and describe how they
interrelate
 Compare and contrast service and
manufacturing operations
 Describe the operations function and the
nature of the operations manager’s job
1-3
Learning Objectives
 Differentiate between design and operation
of production systems
 Describe the key aspects of operations
management decision making
 Briefly describe the historicalevolution of
operations management
 Identify current trends that impact operations
management
1-4
Operations Management
 Operations Management is:
The management of systems or processes
that create goods and/or provide services
 Operations Management affects:
 Companies’ ability to compete
 Nation’s ability to compete internationally
1-5
The Organization
The Three Basic Functions
Organization
Finance Operations Marketing
Figure 1.1
1-6
Value-Added Process
The operations function involves the conversion of
inputs into outputs
Inputs
Land
Labor
Capital
Transformation/
Conversion
process
Outputs
Goods
Services
Control
Feedback
Feedback
Feedback
Value added
Figure 1.2
1-7
Value-Added & Product
Packages
 Value-added is the difference between the
cost of inputs and the value or price of
outputs.
 Product packages are a combination of
goods and services.
 Product packages can make a company
more competitive.
1-8
Automobile assembly, steel making
Home remodeling, retail sales
Automobile Repair, fast food
Goods-service Continuum
Figure 1.3
Computer repair, restaurant meal
Song writing, software development
Goods Service
Surgery, teaching
1-9
Food Processor
Inputs Processing Outputs
Raw Vegetables Cleaning Canned
vegetables
Metal Sheets Making cans
Water Cutting
Energy Cooking
Labor Packing
Building Labeling
Equipment
Table 1.2
1-10
Hospital Process
Inputs Processing Outputs
Doctors, nurses Examination Healthy
patients
Hospital Surgery
Medical Supplies Monitoring
Equipment Medication
Laboratories Therapy
Table 1.2
1-11
Manufacturing or Service?
Tangible Act
1-12
Production of Goods vs. Delivery of
Services
 Production of goods – tangible output
 Delivery of services – an act
 Service job categories
 Government
 Wholesale/retail
 Financial services
 Healthcare
 Personal services
 Business services
 Education
1-13
Key Differences
1. Customer contact
2. Uniformity of input
3. Labor content of jobs
4. Uniformity of output
5. Measurement of productivity
1-14
Key Differences
6. Production and delivery
7. Quality assurance
8. Amount of inventory
9. Evaluation of work
10. Ability to patent design
1-15
Goods vs Service
Characteristic Goods Service
Customer contact Low High
Uniformity of input High Low
Labor content Low High
Uniformity of output High Low
Output Tangible Intangible
Measurement of productivity Easy Difficult
Opportunity to correct problems High Low
Inventory Much Little
Evaluation Easier Difficult
Patentable Usually Not usual
1-16
 Operations Management includes:
 Forecasting
 Capacity planning
 Scheduling
 Managing inventories
 Assuring quality
 Motivating employees
 Deciding where to locate facilities
 Supply chain management
 And more . . .
Scope of Operations Management
1-17
Types of Operations
Table 1.4
Operations Examples
Goods Producing Farming, mining, construction,
manufacturing, power generation
Storage/Transportation Warehousing, trucking, mail
service, moving, taxis, buses,
hotels, airlines
Exchange Retailing, wholesaling, banking,
renting, leasing, library, loans
Entertainment Films, radio and television,
concerts, recording
Communication Newspapers, radio and television
newscasts, telephone, satellites
1-18
Year Mfg. Service
45 79 21
50 72 28
55 72 28
60 68 32
65 64 36
70 64 36
75 58 42
80 44 46
85 43 57
90 35 65
95 25 75
00 30 70
02 25 75
U.S. Manufacturing vs. Service Employment
0
10
20
30
40
50
60
70
80
90
45 50 55 60 65 70 75 80 85 90 95 00 02 05
Year
Percent
Mfg.
Service
Figure 1.4
1-19
Decline in Manufacturing Jobs
 Productivity
 Increasing productivity allows companies to
maintain or increase their output using fewer
workers
 Outsourcing
 Some manufacturing work has been outsourced
to more productive companies
1-20
Why Manufacturing Matters
 Over 18 million workers in manufacturing
jobs
 Accounts for over 70% of value of U.S.
exports
 Average full-time compensation about 20%
higher than average of all workers
 Manufacturing workers more likely to have
benefits
 Productivity growth in manufacturing in the
last 5 years is more than double U.S.
economy
1-21
Why Manufacturing Matters
 More than half of the total R&D performed is
in the manufacturing industries
 Manufacturing workers in California earn an
average of about $25,000 more a year than
service workers
 When a California manufacturing job is lost,
an average of 2.5 service jobs are lost
1-22
Challenges of Managing
Services
 Service jobs are often less structured than
manufacturing jobs
 Customer contact is higher
 Worker skill levels are lower
 Services hire many low-skill, entry-level workers
 Employee turnover is higher
 Input variability is higher
 Service performance can be affected by worker’s
personal factors
1-23
Operations Management
Decision Making
 Models
 Quantitative approaches
 Analysis of trade-offs
 Systems approach
 Establishing priorities
 Ethics
1-24
Key Decisions of Operations
Managers
 What
What resources/what amounts
 When
Needed/scheduled/ordered
 Where
Work to be done
 How
Designed
 Who
To do the work
1-25
Decision Making
System Design
– capacity
– location
– arrangement of departments
– product and service planning
– acquisition and placement of
equipment
1-26
Decision Making
System operation
– personnel
– inventory
– scheduling
– project
management
– quality assurance
1-27
Decision Making
 Models
 Quantitative approaches
 Analysis of trade-offs
 Systems approach
1-28
Models
A model is an abstraction of reality.
– Physical
– Schematic
– Mathematical
What are the pros and cons of models?
Tradeoffs
1-29
Models Are Beneficial
 Easy to use, less expensive
 Require users to organize
 Increase understanding of the problem
 Enable “what if” questions
 Consistent tool for evaluation and
standardized format
 Power of mathematics
1-30
Limitations of Models
 Quantitative information may be emphasized
over qualitative
 Models may be incorrectly applied and
results misinterpreted
 Nonqualified users may not comprehend the
rules on how to use the model
 Use of models does not guarantee good
decisions
1-31
Quantitative Approaches
• Linear programming
• Queuing Techniques
• Inventory models
• Project models
• Statistical models
1-32
Analysis of Trade-Offs
 Decision on the amount of inventory to stock
 Increased cost of holding inventory
Vs.
 Level of customer service
1-33
Systems Approach
“The whole is greater than
the sum of the parts.”
Suboptimization
1-34
Pareto Phenomenon
• A few factors account for a high
percentage of the occurrence of some
event(s).
• 80/20 Rule - 80% of problems are caused
by 20% of the activities.
How do we identify the vital few?
1-35
Ethical Issues
 Financial statements
 Worker safety
 Product safety
 Quality
 Environment
 Community
 Hiring/firing workers
 Closing facilities
 Worker’s rights
1-36
Business Operations Overlap
Operations
Finance
Figure 1.5
Marketing
1-37
Operations Interfaces
Public
Relations
Accounting
Industrial
Engineering
Operations
Maintenance
Personnel
Purchasing
Distribution
MIS
Legal
1-38
Historical Evolution of Operations
Management
 Industrial revolution (1770’s)
 Scientific management (1911)
 Mass production
 Interchangeable parts
 Division of labor
 Human relations movement (1920-60)
 Decision models (1915, 1960-70’s)
 Influence of Japanese manufacturers
Table 1.7
1-39
Trends in Business
 Major trends
 The Internet, e-commerce, e-business
 Management technology
 Globalization
 Management of supply chains
 Outsourcing
 Agility
 Ethical behavior
1-40
Management Technology
 Technology: The application of scientific
discoveries to the development and
improvement of goods and services
 Product and service technology
 Process technology
 Information technology
1-41
Suppliers’
Suppliers
Direct
Suppliers Producer Distributor Final
Consumer
Simple Product Supply Chain
Figure 1.7
Supply Chain: A sequence of activities
And organizations involved in producing
And delivering a good or service
1-42
Stage of Production Value
Added
Value of
Product
Farmer produces and harvests wheat $0.15 $0.15
Wheat transported to mill $0.08 $0.23
Mill produces flour $0.15 $0.38
Flour transported to baker $0.08 $0.46
Baker produces bread $0.54 $1.00
Bread transported to grocery store $0.08 $1.08
Grocery store displays and sells bread $0.21 $1.29
Total Value-Added $1.29
A Supply Chain for Bread
1-43
Other Important Trends
 Ethical behavior
 Operations strategy
 Working with fewer resources
 Revenue management
 Process analysis and improvement
 Increased regulation and product liability
 Lean production

chap001.ppt

  • 1.
    McGraw-Hill/Irwin Copyright ©2007 by The McGraw-Hill Companies, Inc. All rights reserved. 1 Introduction to Operations Management
  • 2.
    1-2 Learning Objectives  Definethe term operations management  Identify the three major functional areas of organizations and describe how they interrelate  Compare and contrast service and manufacturing operations  Describe the operations function and the nature of the operations manager’s job
  • 3.
    1-3 Learning Objectives  Differentiatebetween design and operation of production systems  Describe the key aspects of operations management decision making  Briefly describe the historicalevolution of operations management  Identify current trends that impact operations management
  • 4.
    1-4 Operations Management  OperationsManagement is: The management of systems or processes that create goods and/or provide services  Operations Management affects:  Companies’ ability to compete  Nation’s ability to compete internationally
  • 5.
    1-5 The Organization The ThreeBasic Functions Organization Finance Operations Marketing Figure 1.1
  • 6.
    1-6 Value-Added Process The operationsfunction involves the conversion of inputs into outputs Inputs Land Labor Capital Transformation/ Conversion process Outputs Goods Services Control Feedback Feedback Feedback Value added Figure 1.2
  • 7.
    1-7 Value-Added & Product Packages Value-added is the difference between the cost of inputs and the value or price of outputs.  Product packages are a combination of goods and services.  Product packages can make a company more competitive.
  • 8.
    1-8 Automobile assembly, steelmaking Home remodeling, retail sales Automobile Repair, fast food Goods-service Continuum Figure 1.3 Computer repair, restaurant meal Song writing, software development Goods Service Surgery, teaching
  • 9.
    1-9 Food Processor Inputs ProcessingOutputs Raw Vegetables Cleaning Canned vegetables Metal Sheets Making cans Water Cutting Energy Cooking Labor Packing Building Labeling Equipment Table 1.2
  • 10.
    1-10 Hospital Process Inputs ProcessingOutputs Doctors, nurses Examination Healthy patients Hospital Surgery Medical Supplies Monitoring Equipment Medication Laboratories Therapy Table 1.2
  • 11.
  • 12.
    1-12 Production of Goodsvs. Delivery of Services  Production of goods – tangible output  Delivery of services – an act  Service job categories  Government  Wholesale/retail  Financial services  Healthcare  Personal services  Business services  Education
  • 13.
    1-13 Key Differences 1. Customercontact 2. Uniformity of input 3. Labor content of jobs 4. Uniformity of output 5. Measurement of productivity
  • 14.
    1-14 Key Differences 6. Productionand delivery 7. Quality assurance 8. Amount of inventory 9. Evaluation of work 10. Ability to patent design
  • 15.
    1-15 Goods vs Service CharacteristicGoods Service Customer contact Low High Uniformity of input High Low Labor content Low High Uniformity of output High Low Output Tangible Intangible Measurement of productivity Easy Difficult Opportunity to correct problems High Low Inventory Much Little Evaluation Easier Difficult Patentable Usually Not usual
  • 16.
    1-16  Operations Managementincludes:  Forecasting  Capacity planning  Scheduling  Managing inventories  Assuring quality  Motivating employees  Deciding where to locate facilities  Supply chain management  And more . . . Scope of Operations Management
  • 17.
    1-17 Types of Operations Table1.4 Operations Examples Goods Producing Farming, mining, construction, manufacturing, power generation Storage/Transportation Warehousing, trucking, mail service, moving, taxis, buses, hotels, airlines Exchange Retailing, wholesaling, banking, renting, leasing, library, loans Entertainment Films, radio and television, concerts, recording Communication Newspapers, radio and television newscasts, telephone, satellites
  • 18.
    1-18 Year Mfg. Service 4579 21 50 72 28 55 72 28 60 68 32 65 64 36 70 64 36 75 58 42 80 44 46 85 43 57 90 35 65 95 25 75 00 30 70 02 25 75 U.S. Manufacturing vs. Service Employment 0 10 20 30 40 50 60 70 80 90 45 50 55 60 65 70 75 80 85 90 95 00 02 05 Year Percent Mfg. Service Figure 1.4
  • 19.
    1-19 Decline in ManufacturingJobs  Productivity  Increasing productivity allows companies to maintain or increase their output using fewer workers  Outsourcing  Some manufacturing work has been outsourced to more productive companies
  • 20.
    1-20 Why Manufacturing Matters Over 18 million workers in manufacturing jobs  Accounts for over 70% of value of U.S. exports  Average full-time compensation about 20% higher than average of all workers  Manufacturing workers more likely to have benefits  Productivity growth in manufacturing in the last 5 years is more than double U.S. economy
  • 21.
    1-21 Why Manufacturing Matters More than half of the total R&D performed is in the manufacturing industries  Manufacturing workers in California earn an average of about $25,000 more a year than service workers  When a California manufacturing job is lost, an average of 2.5 service jobs are lost
  • 22.
    1-22 Challenges of Managing Services Service jobs are often less structured than manufacturing jobs  Customer contact is higher  Worker skill levels are lower  Services hire many low-skill, entry-level workers  Employee turnover is higher  Input variability is higher  Service performance can be affected by worker’s personal factors
  • 23.
    1-23 Operations Management Decision Making Models  Quantitative approaches  Analysis of trade-offs  Systems approach  Establishing priorities  Ethics
  • 24.
    1-24 Key Decisions ofOperations Managers  What What resources/what amounts  When Needed/scheduled/ordered  Where Work to be done  How Designed  Who To do the work
  • 25.
    1-25 Decision Making System Design –capacity – location – arrangement of departments – product and service planning – acquisition and placement of equipment
  • 26.
    1-26 Decision Making System operation –personnel – inventory – scheduling – project management – quality assurance
  • 27.
    1-27 Decision Making  Models Quantitative approaches  Analysis of trade-offs  Systems approach
  • 28.
    1-28 Models A model isan abstraction of reality. – Physical – Schematic – Mathematical What are the pros and cons of models? Tradeoffs
  • 29.
    1-29 Models Are Beneficial Easy to use, less expensive  Require users to organize  Increase understanding of the problem  Enable “what if” questions  Consistent tool for evaluation and standardized format  Power of mathematics
  • 30.
    1-30 Limitations of Models Quantitative information may be emphasized over qualitative  Models may be incorrectly applied and results misinterpreted  Nonqualified users may not comprehend the rules on how to use the model  Use of models does not guarantee good decisions
  • 31.
    1-31 Quantitative Approaches • Linearprogramming • Queuing Techniques • Inventory models • Project models • Statistical models
  • 32.
    1-32 Analysis of Trade-Offs Decision on the amount of inventory to stock  Increased cost of holding inventory Vs.  Level of customer service
  • 33.
    1-33 Systems Approach “The wholeis greater than the sum of the parts.” Suboptimization
  • 34.
    1-34 Pareto Phenomenon • Afew factors account for a high percentage of the occurrence of some event(s). • 80/20 Rule - 80% of problems are caused by 20% of the activities. How do we identify the vital few?
  • 35.
    1-35 Ethical Issues  Financialstatements  Worker safety  Product safety  Quality  Environment  Community  Hiring/firing workers  Closing facilities  Worker’s rights
  • 36.
  • 37.
  • 38.
    1-38 Historical Evolution ofOperations Management  Industrial revolution (1770’s)  Scientific management (1911)  Mass production  Interchangeable parts  Division of labor  Human relations movement (1920-60)  Decision models (1915, 1960-70’s)  Influence of Japanese manufacturers Table 1.7
  • 39.
    1-39 Trends in Business Major trends  The Internet, e-commerce, e-business  Management technology  Globalization  Management of supply chains  Outsourcing  Agility  Ethical behavior
  • 40.
    1-40 Management Technology  Technology:The application of scientific discoveries to the development and improvement of goods and services  Product and service technology  Process technology  Information technology
  • 41.
    1-41 Suppliers’ Suppliers Direct Suppliers Producer DistributorFinal Consumer Simple Product Supply Chain Figure 1.7 Supply Chain: A sequence of activities And organizations involved in producing And delivering a good or service
  • 42.
    1-42 Stage of ProductionValue Added Value of Product Farmer produces and harvests wheat $0.15 $0.15 Wheat transported to mill $0.08 $0.23 Mill produces flour $0.15 $0.38 Flour transported to baker $0.08 $0.46 Baker produces bread $0.54 $1.00 Bread transported to grocery store $0.08 $1.08 Grocery store displays and sells bread $0.21 $1.29 Total Value-Added $1.29 A Supply Chain for Bread
  • 43.
    1-43 Other Important Trends Ethical behavior  Operations strategy  Working with fewer resources  Revenue management  Process analysis and improvement  Increased regulation and product liability  Lean production