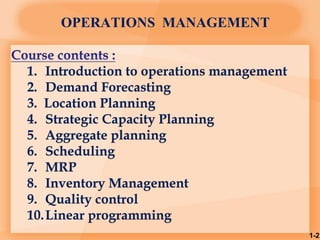
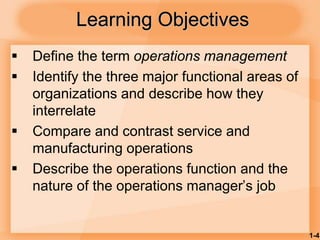
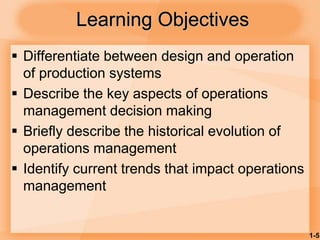
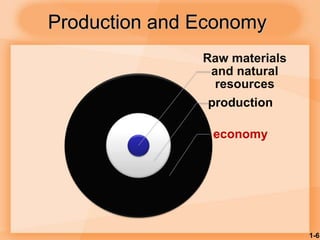
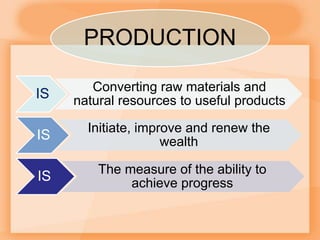
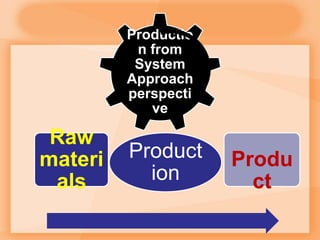
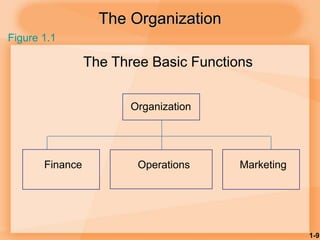
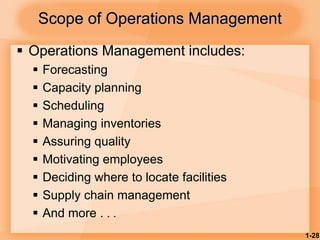
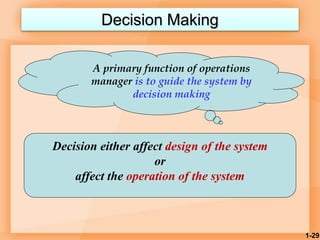
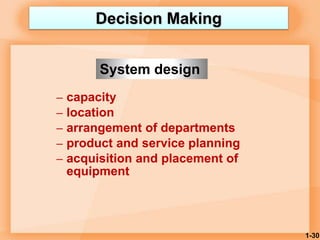
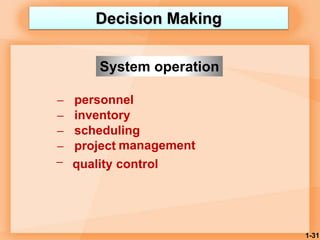
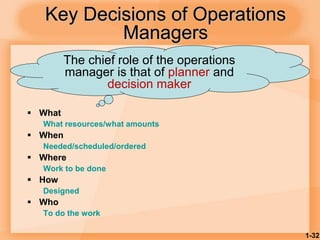
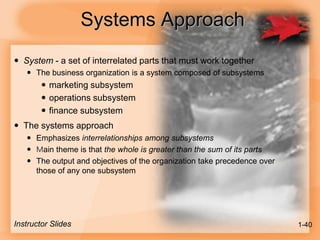
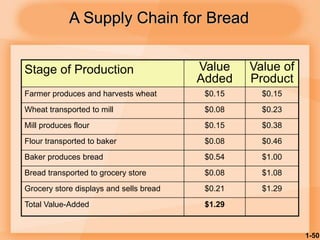
Arab Academy for Science and
Technology
Graduate School of Business
OPERATIONS MANAGEMENT
1-1
OPERATIONS MANAGEMENT
1-2
1. Introduction to operations management
2. Demand Forecasting
3. Location Planning
4. Strategic Capacity Planning
5. Aggregate planning
6. Scheduling
7. MRP
8. Inventory Management
9. Quality control
10.Linear programming
McGraw-Hill/Irwin Copyright © 2007 by The McGraw-Hill Companies, Inc. All rights reserved.
1
Introduction to
Operations
Management
1-4
Learning Objectives
 Define the term operations management
 Identify the three major functional areas of
organizations and describe how they
interrelate
 Compare and contrast service and
manufacturing operations
 Describe the operations function and the
nature of the operations manager’s job
1-5
Learning Objectives
 Differentiate between design and operation
of production systems
 Describe the key aspects of operations
management decision making
 Briefly describe the historical evolution of
operations management
 Identify current trends that impact operations
management
1-6
Raw materials
and natural
resources
production
economy
Production and Economy
PRODUCTION
IS
Converting raw materials and
natural resources to useful products
IS
Initiate, improve and renew the
wealth
IS The measure of the ability to
achieve progress
Productio
n from
System
Approach
perspecti
ve
Product
ion
Raw
materi
als
Produ
ct
1-9
The Organization
The Three Basic Functions
Organization
Finance Operations Marketing
Figure 1.1
1-10
FINANCE IS RESPONSIBLE FOR :
Securing financial resources at
favorable prices and allocating
those resources throughout
the organization
1-11
OPERATIONS IS RESPONSIBLE FOR :
Producing the goods or providing
the services offered by the
organization
1-12
MARKETING IS RESPONSIBLE FOR:
Assessing consumers wants
and needs and promoting
and selling the organization
goods and services
1-13
OPERATIONS MANAGEMENT
It is the management of that part
of an organization that is
responsible for producing
goods and/or providing services
1-14
Business Operations Overlap
Operations
Finance
Figure 1.5
Marketing
1 2
3
4
1-15
Operations Interfaces
Public
Relations
Accounting
Industrial
Engineering
Operations
Maintenance
Personnel
Purchasing
Distribution
MIS
Legal
The Transformation Process
Inputs
•Land
•Labor
•Capital
•Information
Outputs
•Goods
•Services
Transformation/
Conversion
Process
Control
Measurement
and Feedback
Measurement
and Feedback
Measurement
and Feedback
Value-Added
Feedback = measurements taken at various points in the transformation process
Control = The comparison of feedback against previously established standards
to determine if corrective action is needed.
Instructor Slides 1-16
1-17
Value-Added & Product
Packages
 Value-added is the difference between the
cost of inputs and the value or price of
outputs.
 Product packages are a combination of
goods and services.
 Product packages can make a company
more competitive.
1-18
Value-Added
 The essence of the operation function is to
add value during the transformation process
 The value added in a for-profit organization
is the difference between cost of inputs and
price of outputs
 Value added could be applied in a non-profit
organization and as their value to society
 value added used in firm for research,
improvement, salaries and investment and
so on.
1-19
Automobile assembly, steel making
Home remodeling, retail sales
Automobile Repair, fast food
Goods-service Continuum
Computer repair, restaurant meal
Song writing, software development
Goods Service
Surgery, teaching
• Goods and Services often occurs jointly
•The Goods-Services combination is a continuum (chain)
•There are relatively few pure goods and few pure services
1-20
Example
Food Processor: Goods Oriented
Inputs Processing Outputs
Raw Vegetables Cleaning Canned
vegetables
Metal Sheets Making cans
Water Cutting
Energy Cooking
Labor Packing
Building Labeling
Equipment
1-21
Example
Hospital Process: Service Oriented
Inputs Processing Outputs
Doctors, nurses Examination Healthy
patients
Hospital Surgery
Medical Supplies Monitoring
Equipment Medication
Laboratories Therapy
1-22
Types of Operations
Operations Examples
Goods Producing Farming, mining, construction,
manufacturing, power generation
Storage/Transportation Warehousing, trucking, mail
service, moving, taxis, buses,
hotels, airlines
Exchange Retailing, wholesaling, banking,
renting, leasing, library loans
Entertainment Films, radio and television,
concerts, recording
Communication Newspapers, radio and television
newscasts, telephone, satellites
Tangible Act-Oriented
Goods Services
Manufacturing and Service Organizations differ chiefly because
manufacturing is goods-oriented and service is act-oriented.
Manufacturing vs. Service?
Instructor Slides 1-23
1-24
Production of Goods vs. Delivery of
Services
 Production of goods – tangible output
 Delivery of services – an act (intangible output)
 Service job categories
 Government
 Wholesale/retail
 Financial services
 Healthcare
 Personal services
 Business services
 Education, etc.,………….
Manufacturing vs. Service
1. Degree of customer contact
2. Uniformity of input
3. Labor content of jobs
4. Uniformity of output
5. Measurement of productivity
6. Production and delivery
7. Quality assurance
8. Amount of inventory
9. Evaluation of work
10. Ability to patent design
Instructor Slides 1-25
U.S. Manufacturing vs. Service Employment
Instructor Slides 1-26
Supply & Demand
Supply Demand
>
Supply Demand
<
Supply Demand
=
Wasteful
Costly
Opportunity Loss
Customer
Dissatisfaction
Ideal
Operations &
Supply Chains Sales & Marketing
Instructor Slides 1-27
1-28
 Operations Management includes:
 Forecasting
 Capacity planning
 Scheduling
 Managing inventories
 Assuring quality
 Motivating employees
 Deciding where to locate facilities
 Supply chain management
 And more . . .
Scope of Operations Management
1-29
Decision Making
A primary function of operations
manager is to guide the system by
decision making
Decision either affect design of the system
or
affect the operation of the system
1-30
– capacity
– location
– arrangement of departments
– product and service planning
– acquisition and placement of
equipment
Decision Making
System design
1-31
Decision Making
– personnel
– inventory
– scheduling
– project management
– quality control
System operation
1-32
Key Decisions of Operations
Managers
 What
What resources/what amounts
 When
Needed/scheduled/ordered
 Where
Work to be done
 How
Designed
 Who
To do the work
The chief role of the operations
manager is that of planner and
decision maker
1-33
Decision Making tools
 Models
 Quantitative approaches
 Analysis of trade-offs
 Systems approach
 Establishing priorities
1-34
Models
– Physical
– Schematic
– Mathematical
What are the pros and cons of models?
an abstraction of reality, a simplified
representation of the system.
 Types of Models:
 Physical Models
 Look like their real-life counterparts
 Schematic Models
 Look less like their real-life counterparts than physical
models
 Mathematical Models
 Do not look at all like their real-life counterparts
Models
Instructor Slides 1-35
1. Models are generally easier to use and less expensive than dealing
with the real system
2. Require users to organize and sometimes quantify information
3. Increase understanding of the problem
4. Enable managers to analyze “What if?” questions
5. Serve as a consistent tool for evaluation and provide a standardized
format for analyzing a problem
6. Enable users to bring the power of mathematics to solve a problem.
Benefits of Models
Instructor Slides 1-36
1-37
Limitations of Models
 Quantitative information may be emphasized
over qualitative
 Models may be incorrectly applied and
results misinterpreted
 Nonqualified users may not comprehend the
rules on how to use the model
 Use of models does not guarantee good
decisions
1-38
Quantitative Approaches
• Linear programming
• Queuing Techniques
• Inventory models
• Project models
• Statistical models, etc.,…..
An attempt to obtain
mathematically optimal solution to
managerial problems
1-39
Analysis of Trade-Offs
 Decision on the amount of inventory to stock
Increased cost of holding inventory Vs Level of customer service
What are the pros and cons of models?
What are the advantage and disadvantage of
models?
Systems Approach
 System - a set of interrelated parts that must work together
 The business organization is a system composed of subsystems
 marketing subsystem
 operations subsystem
 finance subsystem
 The systems approach
 Emphasizes interrelationships among subsystems
 Main theme is that the whole is greater than the sum of its parts
 The output and objectives of the organization take precedence over
those of any one subsystem
Instructor Slides 1-40
1-41
“The whole is greater than
the sum of the parts.”
Systems Approach
The objectives of the
organization as a whole take
precedence over those of
any one subsystems
Sub optimization
1-42
Establishing
Priority
Certain few factors are more important than
the others, recognizing this enables the
managers to direct their efforts to where
they will do good and avoid wasting time
and energy on insignificant factors
How do we identify the vital few?
1-43
Pareto Phenomenon
• A few factors account for a high
percentage of the occurrence of
some event(s).
• 80/20 Rule - 80% of problems are
caused by 20% of the activities.
How do we identify the vital few?
1-44
Pareto Phenomenon
1.Search for the few factors that will
have the greatest impact
2.Give them the highest priority
3.Use them for achieving the objective
or solving the problem
1-45
Suppliers’
Suppliers
Direct
Suppliers Producer Distributor Final
Consumer
Supply Chain
Figure 1.7
Supply Chain: A sequence of activities
And organizations involved in producing
And delivering a good or service
The Need for Supply Chain Management
 In the past, organizations did little to
manage the supply chain beyond their
own operations and immediate suppliers
which led to numerous problems:
 Oscillating inventory levels
 Inventory stockouts
 Late deliveries
 Quality problems
Instructor Slides 1-46
Supply Chain Issues
1. The need to improve operations
2. Increasing levels of outsourcing
3. Increasing transportation costs
4. Competitive pressures
5. Increasing globalization
6. Increasing importance of e-business
7. The complexity of supply chains
8. The need to manage inventories
Instructor Slides 1-47
Elements of Supply Chain Management
 Customers – what products/services do customers want
 Forecasting – predicting timing and volume of customer demand
 Design – incorporating customer wants, manufacturability, and time to
market
 Capacity planning – matching supply and demand
 Processing – controlling quality, scheduling work
 Inventory – meeting demand requirements while managing costs
 Purchasing – evaluating potential suppliers, supporting the needs of
operations on purchased goods and services
 Suppliers – monitoring supplier quality, on-time delivery, and flexibility;
maintaining supplier relations
 Location – determining the location of facilities
 Logistics – deciding how to best move information and materials
Instructor Slides 1-48
Supply Chain for Bread
Instructor Slides 1-49
1-50
Stage of Production Value
Added
Value of
Product
Farmer produces and harvests wheat $0.15 $0.15
Wheat transported to mill $0.08 $0.23
Mill produces flour $0.15 $0.38
Flour transported to baker $0.08 $0.46
Baker produces bread $0.54 $1.00
Bread transported to grocery store $0.08 $1.08
Grocery store displays and sells bread $0.21 $1.29
Total Value-Added $1.29
A Supply Chain for Bread

CHAPTER_1 Introduction to Operations Mangement.ppt

  • 1.
    Arab Academy forScience and Technology Graduate School of Business OPERATIONS MANAGEMENT 1-1
  • 2.
    OPERATIONS MANAGEMENT 1-2 1. Introductionto operations management 2. Demand Forecasting 3. Location Planning 4. Strategic Capacity Planning 5. Aggregate planning 6. Scheduling 7. MRP 8. Inventory Management 9. Quality control 10.Linear programming
  • 3.
    McGraw-Hill/Irwin Copyright ©2007 by The McGraw-Hill Companies, Inc. All rights reserved. 1 Introduction to Operations Management
  • 4.
    1-4 Learning Objectives  Definethe term operations management  Identify the three major functional areas of organizations and describe how they interrelate  Compare and contrast service and manufacturing operations  Describe the operations function and the nature of the operations manager’s job
  • 5.
    1-5 Learning Objectives  Differentiatebetween design and operation of production systems  Describe the key aspects of operations management decision making  Briefly describe the historical evolution of operations management  Identify current trends that impact operations management
  • 6.
  • 7.
    PRODUCTION IS Converting raw materialsand natural resources to useful products IS Initiate, improve and renew the wealth IS The measure of the ability to achieve progress
  • 8.
  • 9.
    1-9 The Organization The ThreeBasic Functions Organization Finance Operations Marketing Figure 1.1
  • 10.
    1-10 FINANCE IS RESPONSIBLEFOR : Securing financial resources at favorable prices and allocating those resources throughout the organization
  • 11.
    1-11 OPERATIONS IS RESPONSIBLEFOR : Producing the goods or providing the services offered by the organization
  • 12.
    1-12 MARKETING IS RESPONSIBLEFOR: Assessing consumers wants and needs and promoting and selling the organization goods and services
  • 13.
    1-13 OPERATIONS MANAGEMENT It isthe management of that part of an organization that is responsible for producing goods and/or providing services
  • 14.
  • 15.
  • 16.
    The Transformation Process Inputs •Land •Labor •Capital •Information Outputs •Goods •Services Transformation/ Conversion Process Control Measurement andFeedback Measurement and Feedback Measurement and Feedback Value-Added Feedback = measurements taken at various points in the transformation process Control = The comparison of feedback against previously established standards to determine if corrective action is needed. Instructor Slides 1-16
  • 17.
    1-17 Value-Added & Product Packages Value-added is the difference between the cost of inputs and the value or price of outputs.  Product packages are a combination of goods and services.  Product packages can make a company more competitive.
  • 18.
    1-18 Value-Added  The essenceof the operation function is to add value during the transformation process  The value added in a for-profit organization is the difference between cost of inputs and price of outputs  Value added could be applied in a non-profit organization and as their value to society  value added used in firm for research, improvement, salaries and investment and so on.
  • 19.
    1-19 Automobile assembly, steelmaking Home remodeling, retail sales Automobile Repair, fast food Goods-service Continuum Computer repair, restaurant meal Song writing, software development Goods Service Surgery, teaching • Goods and Services often occurs jointly •The Goods-Services combination is a continuum (chain) •There are relatively few pure goods and few pure services
  • 20.
    1-20 Example Food Processor: GoodsOriented Inputs Processing Outputs Raw Vegetables Cleaning Canned vegetables Metal Sheets Making cans Water Cutting Energy Cooking Labor Packing Building Labeling Equipment
  • 21.
    1-21 Example Hospital Process: ServiceOriented Inputs Processing Outputs Doctors, nurses Examination Healthy patients Hospital Surgery Medical Supplies Monitoring Equipment Medication Laboratories Therapy
  • 22.
    1-22 Types of Operations OperationsExamples Goods Producing Farming, mining, construction, manufacturing, power generation Storage/Transportation Warehousing, trucking, mail service, moving, taxis, buses, hotels, airlines Exchange Retailing, wholesaling, banking, renting, leasing, library loans Entertainment Films, radio and television, concerts, recording Communication Newspapers, radio and television newscasts, telephone, satellites
  • 23.
    Tangible Act-Oriented Goods Services Manufacturingand Service Organizations differ chiefly because manufacturing is goods-oriented and service is act-oriented. Manufacturing vs. Service? Instructor Slides 1-23
  • 24.
    1-24 Production of Goodsvs. Delivery of Services  Production of goods – tangible output  Delivery of services – an act (intangible output)  Service job categories  Government  Wholesale/retail  Financial services  Healthcare  Personal services  Business services  Education, etc.,………….
  • 25.
    Manufacturing vs. Service 1.Degree of customer contact 2. Uniformity of input 3. Labor content of jobs 4. Uniformity of output 5. Measurement of productivity 6. Production and delivery 7. Quality assurance 8. Amount of inventory 9. Evaluation of work 10. Ability to patent design Instructor Slides 1-25
  • 26.
    U.S. Manufacturing vs.Service Employment Instructor Slides 1-26
  • 27.
    Supply & Demand SupplyDemand > Supply Demand < Supply Demand = Wasteful Costly Opportunity Loss Customer Dissatisfaction Ideal Operations & Supply Chains Sales & Marketing Instructor Slides 1-27
  • 28.
    1-28  Operations Managementincludes:  Forecasting  Capacity planning  Scheduling  Managing inventories  Assuring quality  Motivating employees  Deciding where to locate facilities  Supply chain management  And more . . . Scope of Operations Management
  • 29.
    1-29 Decision Making A primaryfunction of operations manager is to guide the system by decision making Decision either affect design of the system or affect the operation of the system
  • 30.
    1-30 – capacity – location –arrangement of departments – product and service planning – acquisition and placement of equipment Decision Making System design
  • 31.
    1-31 Decision Making – personnel –inventory – scheduling – project management – quality control System operation
  • 32.
    1-32 Key Decisions ofOperations Managers  What What resources/what amounts  When Needed/scheduled/ordered  Where Work to be done  How Designed  Who To do the work The chief role of the operations manager is that of planner and decision maker
  • 33.
    1-33 Decision Making tools Models  Quantitative approaches  Analysis of trade-offs  Systems approach  Establishing priorities
  • 34.
    1-34 Models – Physical – Schematic –Mathematical What are the pros and cons of models? an abstraction of reality, a simplified representation of the system.
  • 35.
     Types ofModels:  Physical Models  Look like their real-life counterparts  Schematic Models  Look less like their real-life counterparts than physical models  Mathematical Models  Do not look at all like their real-life counterparts Models Instructor Slides 1-35
  • 36.
    1. Models aregenerally easier to use and less expensive than dealing with the real system 2. Require users to organize and sometimes quantify information 3. Increase understanding of the problem 4. Enable managers to analyze “What if?” questions 5. Serve as a consistent tool for evaluation and provide a standardized format for analyzing a problem 6. Enable users to bring the power of mathematics to solve a problem. Benefits of Models Instructor Slides 1-36
  • 37.
    1-37 Limitations of Models Quantitative information may be emphasized over qualitative  Models may be incorrectly applied and results misinterpreted  Nonqualified users may not comprehend the rules on how to use the model  Use of models does not guarantee good decisions
  • 38.
    1-38 Quantitative Approaches • Linearprogramming • Queuing Techniques • Inventory models • Project models • Statistical models, etc.,….. An attempt to obtain mathematically optimal solution to managerial problems
  • 39.
    1-39 Analysis of Trade-Offs Decision on the amount of inventory to stock Increased cost of holding inventory Vs Level of customer service What are the pros and cons of models? What are the advantage and disadvantage of models?
  • 40.
    Systems Approach  System- a set of interrelated parts that must work together  The business organization is a system composed of subsystems  marketing subsystem  operations subsystem  finance subsystem  The systems approach  Emphasizes interrelationships among subsystems  Main theme is that the whole is greater than the sum of its parts  The output and objectives of the organization take precedence over those of any one subsystem Instructor Slides 1-40
  • 41.
    1-41 “The whole isgreater than the sum of the parts.” Systems Approach The objectives of the organization as a whole take precedence over those of any one subsystems Sub optimization
  • 42.
    1-42 Establishing Priority Certain few factorsare more important than the others, recognizing this enables the managers to direct their efforts to where they will do good and avoid wasting time and energy on insignificant factors How do we identify the vital few?
  • 43.
    1-43 Pareto Phenomenon • Afew factors account for a high percentage of the occurrence of some event(s). • 80/20 Rule - 80% of problems are caused by 20% of the activities. How do we identify the vital few?
  • 44.
    1-44 Pareto Phenomenon 1.Search forthe few factors that will have the greatest impact 2.Give them the highest priority 3.Use them for achieving the objective or solving the problem
  • 45.
    1-45 Suppliers’ Suppliers Direct Suppliers Producer DistributorFinal Consumer Supply Chain Figure 1.7 Supply Chain: A sequence of activities And organizations involved in producing And delivering a good or service
  • 46.
    The Need forSupply Chain Management  In the past, organizations did little to manage the supply chain beyond their own operations and immediate suppliers which led to numerous problems:  Oscillating inventory levels  Inventory stockouts  Late deliveries  Quality problems Instructor Slides 1-46
  • 47.
    Supply Chain Issues 1.The need to improve operations 2. Increasing levels of outsourcing 3. Increasing transportation costs 4. Competitive pressures 5. Increasing globalization 6. Increasing importance of e-business 7. The complexity of supply chains 8. The need to manage inventories Instructor Slides 1-47
  • 48.
    Elements of SupplyChain Management  Customers – what products/services do customers want  Forecasting – predicting timing and volume of customer demand  Design – incorporating customer wants, manufacturability, and time to market  Capacity planning – matching supply and demand  Processing – controlling quality, scheduling work  Inventory – meeting demand requirements while managing costs  Purchasing – evaluating potential suppliers, supporting the needs of operations on purchased goods and services  Suppliers – monitoring supplier quality, on-time delivery, and flexibility; maintaining supplier relations  Location – determining the location of facilities  Logistics – deciding how to best move information and materials Instructor Slides 1-48
  • 49.
    Supply Chain forBread Instructor Slides 1-49
  • 50.
    1-50 Stage of ProductionValue Added Value of Product Farmer produces and harvests wheat $0.15 $0.15 Wheat transported to mill $0.08 $0.23 Mill produces flour $0.15 $0.38 Flour transported to baker $0.08 $0.46 Baker produces bread $0.54 $1.00 Bread transported to grocery store $0.08 $1.08 Grocery store displays and sells bread $0.21 $1.29 Total Value-Added $1.29 A Supply Chain for Bread