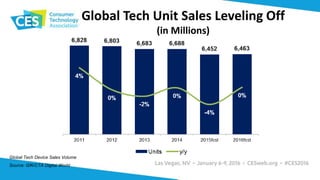
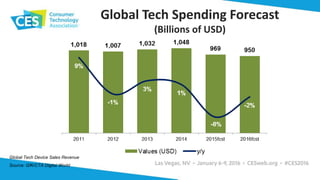
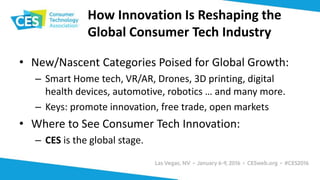
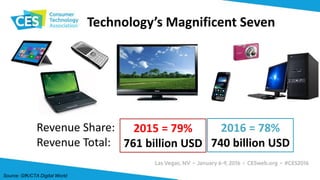
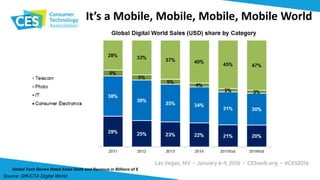
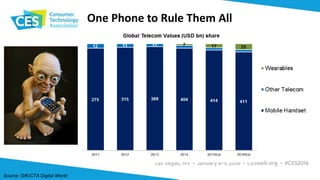
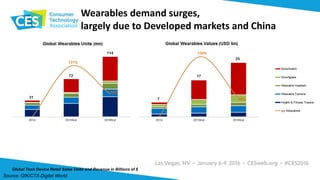
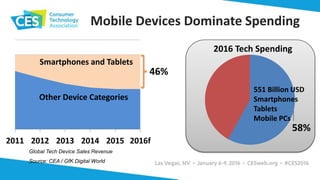
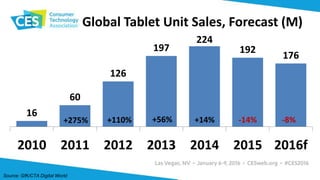
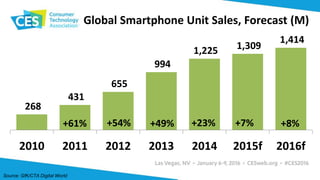
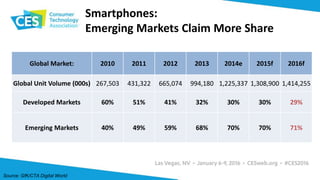
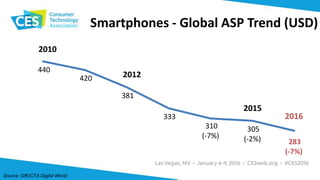
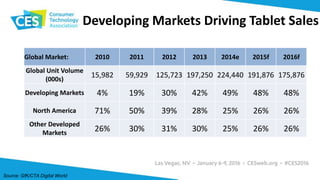
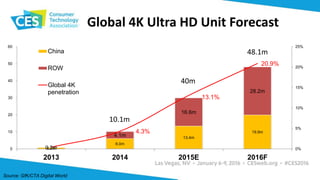
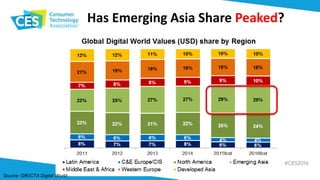
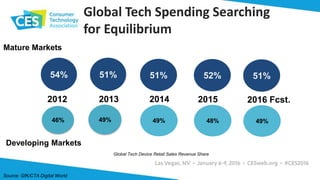
Global Technology Market Update
TECHNOLOGY WORLD TOUROFF-PEAK|RETURN
Steve Koenig
Senior Director, Market Research
@KoenigSteve | skoenig@CE.org
Retail CE sales tracking at more than 340,000 retail stores in 80 countries.
U.S. sell-in (shipments) data for dozens
of CE categories on a monthly basis.
+ =
Digital World:
Global Consumer Technology
Spending Forecasts
Analysis Considerations: Geographical, Financial
• North America
• Western Europe
• Developed APAC
• Exchange Rates (FX)
• Sales Tax
• Tech Subsidies
• Central /Eastern Europe
• Latin America
• Emerging APAC
• Middle East/ Africa
Mature Developing
GLOBAL MARKET:
Global Technology Spending – On Track?
Global Tech Unit Sales Leveling Off
(in Millions)
Global Tech Device Sales Volume
Source: GfK/CTA Digital World
Global Tech Spending Forecast
(Billions of USD)
Global Tech Device Sales Revenue
Source: GfK/CTA Digital World
Reasons for Declining Tech Spending
• Strong Dollar unfavorable to conversion of global currencies.
• ASPs trending lower in categories with big impact:
– Smartphones (-7%); TV (-2%); Laptops (-4%)
• Global unit growth moderate or negative in key sectors.
– TV (1%); smartphones (8%); Laptops (-3%); Tablets (-8%)
• Economic weakness in several emerging markets:
– Latin America, Central/Eastern Europe
• China slowdown
– transitioning to consumption/services; spillover effects on commodity
dependent economies.
Comparisons With Adjacent
Global Industries
• Semiconductors: Capital spending -1% in 2015 to $64 billion
• Consumer Appliances: 2% volume growth in 2016
• Automotive: 2015 - 2-3% growth to 91 million cars
• Furniture: 2.2% consumer spending growth
• Toys: Spending grew 6% (+$1 billion) in 2015
• Fitness Equipment: 4% CAGR to reach $12 billion by 2020
Source: Gartner 10/15
Source: Euromonitor 11/15
Source: OICA 3/15
Source: Euromonitor 11/15
Source: NPD Group 12/15
Source: Allied Market Research 10/15
How Innovation Is Reshaping the
Global Consumer Tech Industry
• New/Nascent Categories Poised for Global Growth:
– Smart Home tech, VR/AR, Drones, 3D printing, digital
health devices, automotive, robotics … and many more.
– Keys: promote innovation, free trade, open markets
• Where to See Consumer Tech Innovation:
– CES is the global stage.
DEVICES:
Still Riding High?
Technology’s Magnificent Seven
2015 = 79%
761 billion USD
2016 = 78%
740 billion USD
Revenue Share:
Revenue Total:
Source: GfK/CTA Digital World
It’s a Mobile, Mobile, Mobile, Mobile World
Global Tech Device Retail Sales Units and Revenue in Billions of $
Source: GfK/CTA Digital World
One Phone to Rule Them All
Source: GfK/CTA Digital World
Wearables demand surges,
largely due to Developed markets and China
Global Tech Device Retail Sales Units and Revenue in Billions of $
Source: GfK/CTA Digital World
2011 2012 2013 2014 2015 2016f
Mobile Devices Dominate Spending
Global Tech Device Sales Revenue
Source: CEA / GfK Digital World
46%
Other Device Categories
Smartphones and Tablets
58%
2016 Tech Spending
551 Billion USD
Smartphones
Tablets
Mobile PCs
History Repeats Itself
1st Roman Triumvirate Technology’s Triumvirate
Lasted from 60 B.C. to 53 B.C. How long will it last?
Unit Growth Story Has Been Mixed …
Global Sales YoY Growth by Product
Source: GfK/CTA Digital World
… And It Remains Mixed in 2016
Global Revenue Growth by Product
Source: GfK/CTA Digital World
Global Tablet Unit Sales, Forecast (M)
16
60
126
197
224
192
176
2010 2011 2012 2013 2014 2015 2016f
+110% +56% +14% -14% -8%+275%
Source: GfK/CTA Digital World
Global Smartphone Unit Sales, Forecast (M)
268
431
655
994
1,225 1,309
1,414
2010 2011 2012 2013 2014 2015f 2016f
+23%+49% +7%+54%+61% +8%
Source: GfK/CTA Digital World
Global Market: 2010 2011 2012 2013 2014e 2015f 2016f
Global Unit Volume (000s) 267,503 431,322 665,074 994,180 1,225,337 1,308,900 1,414,255
Developed Markets 60% 51% 41% 32% 30% 30% 29%
Emerging Markets 40% 49% 59% 68% 70% 70% 71%
Smartphones:
Emerging Markets Claim More Share
Source: GfK/CTA Digital World
Smartphones - Global ASP Trend (USD)
440
420
381
333
310
(-7%)
305
(-2%) 283
(-7%)
2010
2012
2015
2016
Source: GfK/CTA Digital World
Global Tablet Unit Sales, Forecast (M)
16
60
126
197
224
192
176
2010 2011 2012 2013 2014 2015 2016f
+110% +56% +14% -14% -8%+275%
Source: GfK/CTA Digital World
Developing Markets Driving Tablet Sales
Global Market: 2010 2011 2012 2013 2014e 2015f 2016f
Global Unit Volume
(000s)
15,982 59,929 125,723 197,250 224,440 191,876 175,876
Developing Markets 4% 19% 30% 42% 49% 48% 48%
North America 71% 50% 39% 28% 25% 26% 26%
Other Developed
Markets
26% 30% 31% 30% 25% 26% 26%
Source: GfK/CTA Digital World
Global Tablet ASP
685
599
457
347
294
(-7%) 250
(-15%)
228
(-9%)
2010
2012
2015
2016
Source: GfK/CTA Digital World
LCD TV – All Hail the King of Screens
Source: GfK/CTA Digital World
Global LCD TV – Avg. Size Gains
34.7''
36.2''
37.7''
39.3''
40.4''
42.1''
2011 2012 2013 2014 2015F 2016F
Source: GfK/CTA Digital World
0.7m
6.0m
13.4m
19.9m
0.2m
4.1m
16.6m
28.2m
4.3%
13.1%
20.9%
0%
5%
10%
15%
20%
25%
0
10
20
30
40
50
60
2013 2014 2015E 2016F
China
ROW
Global 4K
penetration
Global 4K Ultra HD Unit Forecast
10.1m
40m
48.1m
Source: GfK/CTA Digital World
REGIONAL ANALYSIS:
Spending Growth Picture
Remains Mixed
Has Emerging Asia Share Peaked?
Source: GfK/CTA Digital World
2012 2014
Mature Markets
Developing Markets
$564
bn
54%
49%
$$593
bn
2013
Global Tech Spending Searching
for Equilibrium
Global Tech Device Retail Sales Revenue Share
51%
49%46%
14%
51%
2015
48%
52%
2016 Fcst.
49%
51%
Source: GfK/CTA Digital World

Ces 2016-global-tech-spending-update media-copy

  • 1.
    Global Technology MarketUpdate TECHNOLOGY WORLD TOUROFF-PEAK|RETURN Steve Koenig Senior Director, Market Research @KoenigSteve | skoenig@CE.org
  • 2.
    Retail CE salestracking at more than 340,000 retail stores in 80 countries. U.S. sell-in (shipments) data for dozens of CE categories on a monthly basis. + = Digital World: Global Consumer Technology Spending Forecasts
  • 3.
    Analysis Considerations: Geographical,Financial • North America • Western Europe • Developed APAC • Exchange Rates (FX) • Sales Tax • Tech Subsidies • Central /Eastern Europe • Latin America • Emerging APAC • Middle East/ Africa Mature Developing
  • 4.
    GLOBAL MARKET: Global TechnologySpending – On Track?
  • 5.
    Global Tech UnitSales Leveling Off (in Millions) Global Tech Device Sales Volume Source: GfK/CTA Digital World
  • 6.
    Global Tech SpendingForecast (Billions of USD) Global Tech Device Sales Revenue Source: GfK/CTA Digital World
  • 7.
    Reasons for DecliningTech Spending • Strong Dollar unfavorable to conversion of global currencies. • ASPs trending lower in categories with big impact: – Smartphones (-7%); TV (-2%); Laptops (-4%) • Global unit growth moderate or negative in key sectors. – TV (1%); smartphones (8%); Laptops (-3%); Tablets (-8%) • Economic weakness in several emerging markets: – Latin America, Central/Eastern Europe • China slowdown – transitioning to consumption/services; spillover effects on commodity dependent economies.
  • 8.
    Comparisons With Adjacent GlobalIndustries • Semiconductors: Capital spending -1% in 2015 to $64 billion • Consumer Appliances: 2% volume growth in 2016 • Automotive: 2015 - 2-3% growth to 91 million cars • Furniture: 2.2% consumer spending growth • Toys: Spending grew 6% (+$1 billion) in 2015 • Fitness Equipment: 4% CAGR to reach $12 billion by 2020 Source: Gartner 10/15 Source: Euromonitor 11/15 Source: OICA 3/15 Source: Euromonitor 11/15 Source: NPD Group 12/15 Source: Allied Market Research 10/15
  • 9.
    How Innovation IsReshaping the Global Consumer Tech Industry • New/Nascent Categories Poised for Global Growth: – Smart Home tech, VR/AR, Drones, 3D printing, digital health devices, automotive, robotics … and many more. – Keys: promote innovation, free trade, open markets • Where to See Consumer Tech Innovation: – CES is the global stage.
  • 10.
  • 11.
    Technology’s Magnificent Seven 2015= 79% 761 billion USD 2016 = 78% 740 billion USD Revenue Share: Revenue Total: Source: GfK/CTA Digital World
  • 12.
    It’s a Mobile,Mobile, Mobile, Mobile World Global Tech Device Retail Sales Units and Revenue in Billions of $ Source: GfK/CTA Digital World
  • 13.
    One Phone toRule Them All Source: GfK/CTA Digital World
  • 14.
    Wearables demand surges, largelydue to Developed markets and China Global Tech Device Retail Sales Units and Revenue in Billions of $ Source: GfK/CTA Digital World
  • 15.
    2011 2012 20132014 2015 2016f Mobile Devices Dominate Spending Global Tech Device Sales Revenue Source: CEA / GfK Digital World 46% Other Device Categories Smartphones and Tablets 58% 2016 Tech Spending 551 Billion USD Smartphones Tablets Mobile PCs
  • 16.
    History Repeats Itself 1stRoman Triumvirate Technology’s Triumvirate Lasted from 60 B.C. to 53 B.C. How long will it last?
  • 17.
    Unit Growth StoryHas Been Mixed … Global Sales YoY Growth by Product Source: GfK/CTA Digital World
  • 18.
    … And ItRemains Mixed in 2016 Global Revenue Growth by Product Source: GfK/CTA Digital World
  • 19.
    Global Tablet UnitSales, Forecast (M) 16 60 126 197 224 192 176 2010 2011 2012 2013 2014 2015 2016f +110% +56% +14% -14% -8%+275% Source: GfK/CTA Digital World
  • 20.
    Global Smartphone UnitSales, Forecast (M) 268 431 655 994 1,225 1,309 1,414 2010 2011 2012 2013 2014 2015f 2016f +23%+49% +7%+54%+61% +8% Source: GfK/CTA Digital World
  • 21.
    Global Market: 20102011 2012 2013 2014e 2015f 2016f Global Unit Volume (000s) 267,503 431,322 665,074 994,180 1,225,337 1,308,900 1,414,255 Developed Markets 60% 51% 41% 32% 30% 30% 29% Emerging Markets 40% 49% 59% 68% 70% 70% 71% Smartphones: Emerging Markets Claim More Share Source: GfK/CTA Digital World
  • 22.
    Smartphones - GlobalASP Trend (USD) 440 420 381 333 310 (-7%) 305 (-2%) 283 (-7%) 2010 2012 2015 2016 Source: GfK/CTA Digital World
  • 23.
    Global Tablet UnitSales, Forecast (M) 16 60 126 197 224 192 176 2010 2011 2012 2013 2014 2015 2016f +110% +56% +14% -14% -8%+275% Source: GfK/CTA Digital World
  • 24.
    Developing Markets DrivingTablet Sales Global Market: 2010 2011 2012 2013 2014e 2015f 2016f Global Unit Volume (000s) 15,982 59,929 125,723 197,250 224,440 191,876 175,876 Developing Markets 4% 19% 30% 42% 49% 48% 48% North America 71% 50% 39% 28% 25% 26% 26% Other Developed Markets 26% 30% 31% 30% 25% 26% 26% Source: GfK/CTA Digital World
  • 25.
    Global Tablet ASP 685 599 457 347 294 (-7%)250 (-15%) 228 (-9%) 2010 2012 2015 2016 Source: GfK/CTA Digital World
  • 26.
    LCD TV –All Hail the King of Screens Source: GfK/CTA Digital World
  • 27.
    Global LCD TV– Avg. Size Gains 34.7'' 36.2'' 37.7'' 39.3'' 40.4'' 42.1'' 2011 2012 2013 2014 2015F 2016F Source: GfK/CTA Digital World
  • 28.
    0.7m 6.0m 13.4m 19.9m 0.2m 4.1m 16.6m 28.2m 4.3% 13.1% 20.9% 0% 5% 10% 15% 20% 25% 0 10 20 30 40 50 60 2013 2014 2015E2016F China ROW Global 4K penetration Global 4K Ultra HD Unit Forecast 10.1m 40m 48.1m Source: GfK/CTA Digital World
  • 29.
  • 30.
    Has Emerging AsiaShare Peaked? Source: GfK/CTA Digital World
  • 31.
    2012 2014 Mature Markets DevelopingMarkets $564 bn 54% 49% $$593 bn 2013 Global Tech Spending Searching for Equilibrium Global Tech Device Retail Sales Revenue Share 51% 49%46% 14% 51% 2015 48% 52% 2016 Fcst. 49% 51% Source: GfK/CTA Digital World