Downloaded 151 times
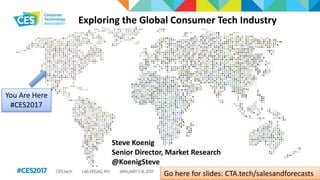

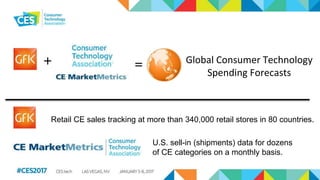
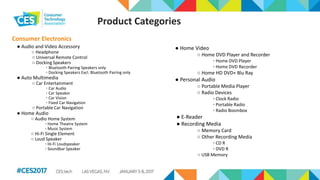
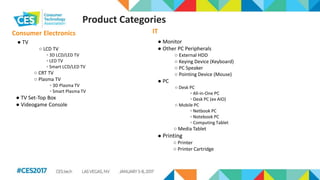
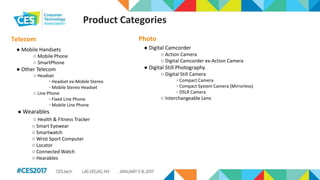
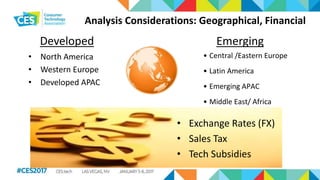

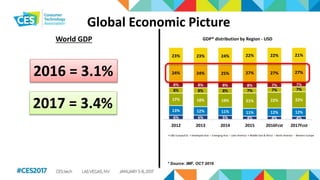
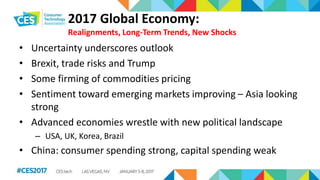
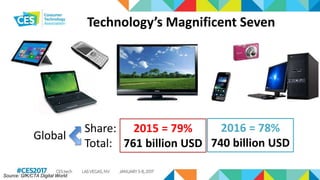

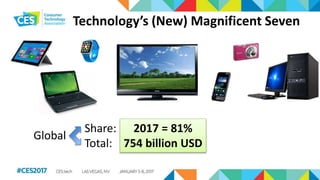
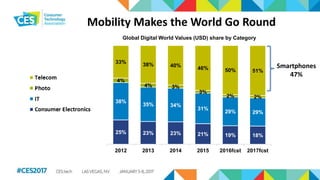

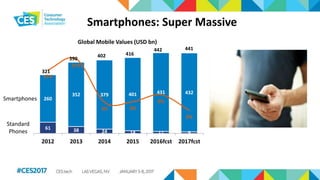
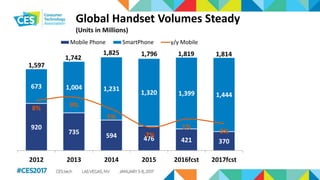
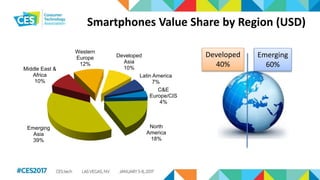
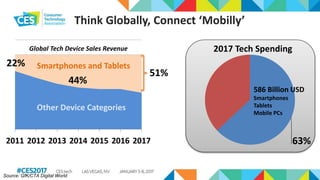
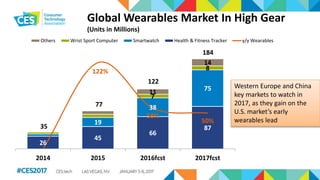
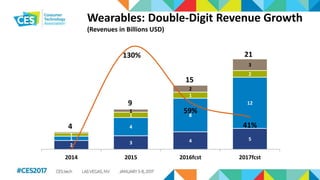
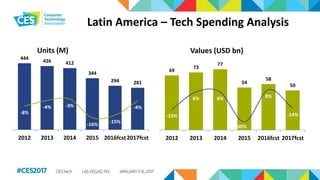
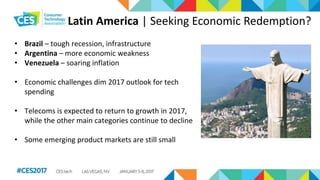
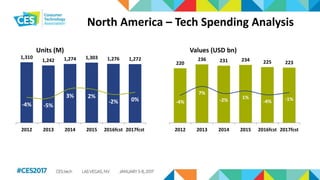
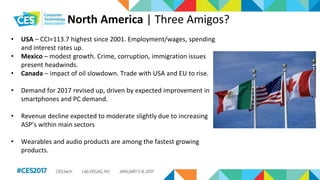
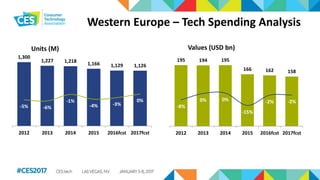
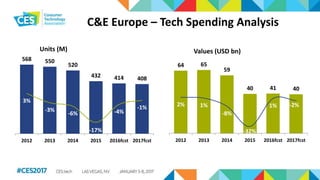
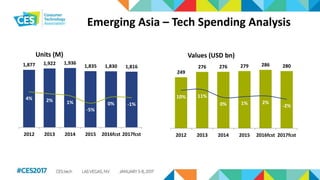
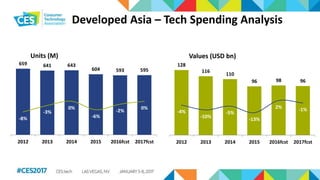
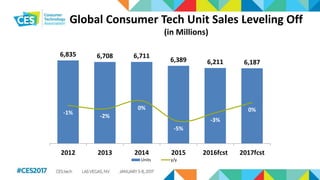
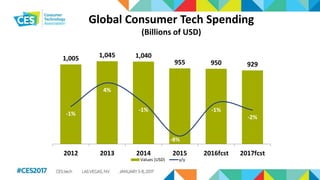
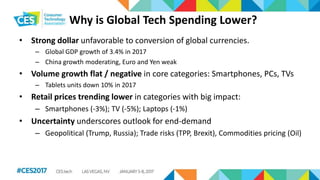


The document provides an analysis of the global consumer technology industry, highlighting trends in spending across various product categories such as smartphones, PCs, and wearable devices. It discusses economic factors affecting tech spending in regions like North America, Latin America, and Europe, including the impacts of political changes and economic recessions. Overall, the outlook predicts variability in growth, with certain product segments experiencing increases while others decline.


![[Infographic] How will Internet of Things (IoT) change the world as we know it?](https://cdn.slidesharecdn.com/ss_thumbnails/iotinfographicv3-160309101328-thumbnail.jpg?width=640&height=640&fit=bounds)


