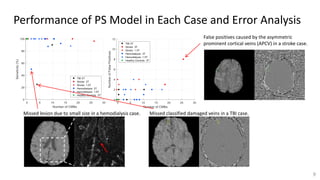
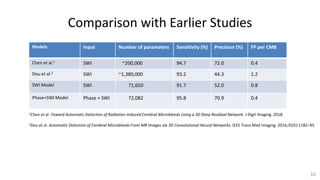
Cerebral Microbleed Detection
using Susceptibility Weighted Imaging
and Deep Learning
Saifeng Liu
May, 2019
Cerebral Microbleed Detection
• Cerebral microbleed (CMB) detection is important in studying dementia,
stroke and traumatic brain injury (TBI)
• Susceptibility Weighted Imaging (SWI) provides exquisite sensitivity to the
presence of CMB
• Manual detection of CMBs
 Time consuming
 Prone to errors (false positive or missed CMB)
1
• Conventional machine learning algorithms
 Require feature engineering (shape, intensity etc.)
 Variation in the shape and intensity of CMBs leads to low sensitivity or low specificity
• Current deep learning based algorithms
 Utilize SWI (magnitude) images only -> difficulties in separating calcifications and CMBs
• Phase images are valuable for separting CMBs and CMB mimics (e.g. calcifications, veins)
2
Magnitude Phase
: CMB
: Calcification
Cerebral Microbleed Detection
CMB Detection using Multi-channel 3D MRI Data
3
1. CMB
Candidate
Detection
using SWI
2. False
Positive
Removal
using Phase
and SWI
: CMB
: False Positive
*
*3D-FRST: 3D Fast Radial Symmetry Transform
Why 3D-FRST for CMB Candidate Detection
5
B0
CMBs are close to
spheres on SWI
images, due to the
shape of the induced
field variation.
TE=10ms TE=2.5ms
Magnitude
Phase
Data Information and Pre-processing
4
Hemodialysis TBI Stroke Normal Control Total
Training 72 (756)a 80 (522) 2 (2) 0 154 (1280)
Validation 15 (160) 8 (33) 2 (0) 0 25 (193)
Test 13 (95) 9 (14) 9 (59) 10 (0) 41 (168)
Data
Splitting
B0 (T) TE (ms) TR (ms) FA (o) In-plane
Resolution (mm2)
Slice Thickness
(mm)
1.5 or 3 40@1.5T;
20@3T
49 or 50 @ 1.5T;
27 to 34 @ 3T
12 or 15 0.5x0.5 to
0.54x1.07
1.2 to 2.65
Imaging
Parameters
aNumber of Cases (Number of CMBs)
Bias-field
Correction
(for magnitude)
Registration
(Magnitude with
MNI-152 template)
Generate
SWI&QSMb
Interpolation
(to 0.5mm
isotropic)
Intensity
Normalization
(to [-1, 1])
Pre-processing
bQSM: quantitative susceptibility mapping
Selection of 3D-FRST Threshold
5
th=0.1
Training and Validation
Selection of the 3D-FRST
threshold using train and
validation data: a trade-off
between sensitivity and FPavg.
Test Data Performance
Sensitivity: 99.4%
FPavg: 276.8 per case
th: 0.09
th=0.09 th=0.08
Overall Performance on Test Data
6
The best combination was
phase and SWI (PS model).
The PS model achieved
similar performance to the
most experienced human
rater (Rater3).
Rater1: SWI data processor
Rater2: Radiologist
Rater3: Experienced SWI
data processor (8+ years)
Contribution of Individual Channels,
Effects of Model Averaging and Input Scale
7
• QSM > SWI > phase > magnitude
• Simple averaging of multiple models (dashed lines) with the same type of input did not help.
• Smaller input scale reduced the performance.
Separating CMBs from Calcification
8
Magnitude Phase SWI QSM
3D-FRST SWI SWI with Candidates SWI Model Prediction Phase+SWI Model Prediction
: calcification
Performance of PS Model in Each Case and Error Analysis
9
False positives caused by the asymmetric
prominent cortical veins (APCV) in a stroke case.
Missed lesion due to small size in a hemodialysis case. Missed classified damaged veins in a TBI case.
Comparison with Earlier Studies
10
Models Input Number of parameters Sensitivity (%) Precision (%) FP per CMB
Chen et al.1
SWI ~200,000 94.7 72.0 0.4
Dou et al.2
SWI ~1,380,000 93.2 44.3 1.2
SWI Model SWI 71,650 91.7 52.0 0.8
Phase+SWI Model Phase + SWI 72,082 95.8 70.9 0.4
1Chen et al. Toward Automatic Detection of Radiation-Induced Cerebral Microbleeds Using a 3D Deep Residual Network. J Digit Imaging. 2018.
2Dou et al. Automatic Detection of Cerebral Microbleeds From MR Images via 3D Convolutional Neural Networks. IEEE Trans Med Imaging. 2016;35(5):1182–95
Discussion
• Limited sample size of different categories
 variation in the performance for different types of disease
• Lack of comprehensive comparison with earlier algorithms
 used the SWI model as a reference
 compared with human raters
• The raw phase images were not available
 limited quality of QSM -> the best combination of input channels is phase
and SWI
• Use of conventional 3D-FRST for candidate selection:
 fully convolutional network may further improve time-efficiency
11
Conclusions
• The use of both SWI and phase images leads to significant improvement in the
model performance.
• Preprocessing is important for utilizing 3D multi-contrast MRI data.
• The best PS model outperformed earlier studies and achieved similar
performance to the most experienced human rater.
• There is great potential of applying deep learning techniques to medical
imaging.
14
• A paper based on this study has been published on NeuroImage:
• Liu S, Utriainen D, Chai C, Chen Y, Wang L, Sethi SK, Xia S, Haacke EM. Cerebral
microbleed detection using Susceptibility Weighted Imaging and deep
learning. NeuroImage. 2019 May 20.
• https://doi.org/10.1016/j.neuroimage.2019.05.046
15

Cerebral Microbleed Detection using Susceptibility Weighted Imaging and Deep Learning

  • 1.
    Cerebral Microbleed Detection usingSusceptibility Weighted Imaging and Deep Learning Saifeng Liu May, 2019
  • 2.
    Cerebral Microbleed Detection •Cerebral microbleed (CMB) detection is important in studying dementia, stroke and traumatic brain injury (TBI) • Susceptibility Weighted Imaging (SWI) provides exquisite sensitivity to the presence of CMB • Manual detection of CMBs  Time consuming  Prone to errors (false positive or missed CMB) 1
  • 3.
    • Conventional machinelearning algorithms  Require feature engineering (shape, intensity etc.)  Variation in the shape and intensity of CMBs leads to low sensitivity or low specificity • Current deep learning based algorithms  Utilize SWI (magnitude) images only -> difficulties in separating calcifications and CMBs • Phase images are valuable for separting CMBs and CMB mimics (e.g. calcifications, veins) 2 Magnitude Phase : CMB : Calcification Cerebral Microbleed Detection
  • 4.
    CMB Detection usingMulti-channel 3D MRI Data 3 1. CMB Candidate Detection using SWI 2. False Positive Removal using Phase and SWI : CMB : False Positive * *3D-FRST: 3D Fast Radial Symmetry Transform
  • 5.
    Why 3D-FRST forCMB Candidate Detection 5 B0 CMBs are close to spheres on SWI images, due to the shape of the induced field variation. TE=10ms TE=2.5ms Magnitude Phase
  • 6.
    Data Information andPre-processing 4 Hemodialysis TBI Stroke Normal Control Total Training 72 (756)a 80 (522) 2 (2) 0 154 (1280) Validation 15 (160) 8 (33) 2 (0) 0 25 (193) Test 13 (95) 9 (14) 9 (59) 10 (0) 41 (168) Data Splitting B0 (T) TE (ms) TR (ms) FA (o) In-plane Resolution (mm2) Slice Thickness (mm) 1.5 or 3 40@1.5T; 20@3T 49 or 50 @ 1.5T; 27 to 34 @ 3T 12 or 15 0.5x0.5 to 0.54x1.07 1.2 to 2.65 Imaging Parameters aNumber of Cases (Number of CMBs) Bias-field Correction (for magnitude) Registration (Magnitude with MNI-152 template) Generate SWI&QSMb Interpolation (to 0.5mm isotropic) Intensity Normalization (to [-1, 1]) Pre-processing bQSM: quantitative susceptibility mapping
  • 7.
    Selection of 3D-FRSTThreshold 5 th=0.1 Training and Validation Selection of the 3D-FRST threshold using train and validation data: a trade-off between sensitivity and FPavg. Test Data Performance Sensitivity: 99.4% FPavg: 276.8 per case th: 0.09 th=0.09 th=0.08
  • 8.
    Overall Performance onTest Data 6 The best combination was phase and SWI (PS model). The PS model achieved similar performance to the most experienced human rater (Rater3). Rater1: SWI data processor Rater2: Radiologist Rater3: Experienced SWI data processor (8+ years)
  • 9.
    Contribution of IndividualChannels, Effects of Model Averaging and Input Scale 7 • QSM > SWI > phase > magnitude • Simple averaging of multiple models (dashed lines) with the same type of input did not help. • Smaller input scale reduced the performance.
  • 10.
    Separating CMBs fromCalcification 8 Magnitude Phase SWI QSM 3D-FRST SWI SWI with Candidates SWI Model Prediction Phase+SWI Model Prediction : calcification
  • 11.
    Performance of PSModel in Each Case and Error Analysis 9 False positives caused by the asymmetric prominent cortical veins (APCV) in a stroke case. Missed lesion due to small size in a hemodialysis case. Missed classified damaged veins in a TBI case.
  • 12.
    Comparison with EarlierStudies 10 Models Input Number of parameters Sensitivity (%) Precision (%) FP per CMB Chen et al.1 SWI ~200,000 94.7 72.0 0.4 Dou et al.2 SWI ~1,380,000 93.2 44.3 1.2 SWI Model SWI 71,650 91.7 52.0 0.8 Phase+SWI Model Phase + SWI 72,082 95.8 70.9 0.4 1Chen et al. Toward Automatic Detection of Radiation-Induced Cerebral Microbleeds Using a 3D Deep Residual Network. J Digit Imaging. 2018. 2Dou et al. Automatic Detection of Cerebral Microbleeds From MR Images via 3D Convolutional Neural Networks. IEEE Trans Med Imaging. 2016;35(5):1182–95
  • 13.
    Discussion • Limited samplesize of different categories  variation in the performance for different types of disease • Lack of comprehensive comparison with earlier algorithms  used the SWI model as a reference  compared with human raters • The raw phase images were not available  limited quality of QSM -> the best combination of input channels is phase and SWI • Use of conventional 3D-FRST for candidate selection:  fully convolutional network may further improve time-efficiency 11
  • 14.
    Conclusions • The useof both SWI and phase images leads to significant improvement in the model performance. • Preprocessing is important for utilizing 3D multi-contrast MRI data. • The best PS model outperformed earlier studies and achieved similar performance to the most experienced human rater. • There is great potential of applying deep learning techniques to medical imaging. 14
  • 15.
    • A paperbased on this study has been published on NeuroImage: • Liu S, Utriainen D, Chai C, Chen Y, Wang L, Sethi SK, Xia S, Haacke EM. Cerebral microbleed detection using Susceptibility Weighted Imaging and deep learning. NeuroImage. 2019 May 20. • https://doi.org/10.1016/j.neuroimage.2019.05.046 15