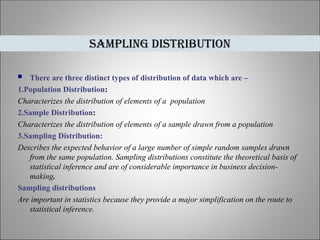
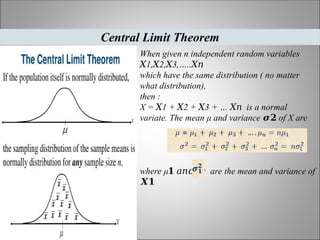
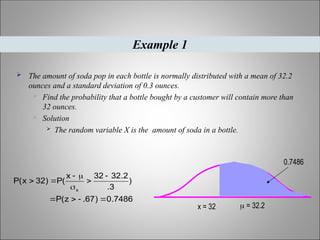
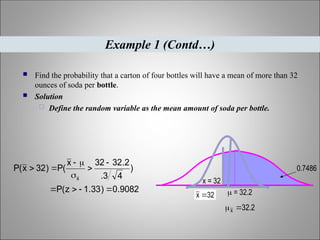
Applied Statistics
Sampling Distribution
Topic
 Aims of Sampling
 Sampling Distributions
 Characteristics
 The Central Limit Theorem
 Example
Sampling and Sampling Distributions
 Reduces cost of research (e.g. political polls)
 Generalize about a larger population (e.g.,
benefits of sampling city r/t neighborhood)
 In some cases (e.g. industrial production)
analysis may be destructive, so sampling is
needed
Aims of sampling
 There are three distinct types of distribution of data which are –
1.Population Distribution:
Characterizes the distribution of elements of a population
2.Sample Distribution:
Characterizes the distribution of elements of a sample drawn from a population
3.Sampling Distribution:
Describes the expected behavior of a large number of simple random samples drawn
from the same population. Sampling distributions constitute the theoretical basis of
statistical inference and are of considerable importance in business decision-
making.
Sampling distributions
Are important in statistics because they provide a major simplification on the route to
statistical inference.
Sampling Distribution
 Sampling distribution of the mean – A theoretical
probability distribution of sample means that would be
obtained by drawing from the population all possible
samples of the same size.
 Sampling distribution is a theoretical distribution of an
infinite number of sample means of equal size taken from a
population ( Walsh : 95)
Sampling distribution
In real life calculating parameters of populations is
usually impossible because populations are very
large.
Rather than investigating the whole population, we
take a sample, calculate a statistic related to the
parameter of interest, and make an inference.
The sampling distribution of the statistic is the tool
that tells us how close is the statistic to the parameter.
What Actually Sampling distribution IS
 Usually a univariate distribution.
 Closely approximate a normal distribution.
 Sample statistic is a random variable – sample mean , sample
& proportion A theoretical probability distribution
 The form of a sampling distribution refers to the shape of the
particular curve that describes the distribution.
CHARACTERISTICS
 Sampling distribution is a graph which perform several duties to show
data graphically.
 Sampling distribution works for :
 Mean
 Mean absolute value of the deviation from the mean
 Range
 Standard deviation of the sample
 Unbiased estimate of the sample
 Variance of the sample
FUNCTIONS OF SAMPLING DISTRIBUTION
 PROPERTIES OF STATISTICS
 SELECTION OF DISTRIBUTIO TYPE TO MODEL
SCORE
 HYPOTHESIS TESTING
WHY SAMPLING DISTRIBUTION IS IMPORTANT????
 An example
 A die is thrown infinitely many times. Let X
represent the number of spots showing on
any throw.
 The probability distribution of X is
Sampling Distribution of the Mean
x 1 2 3 4 5 6
p(x) 1/6 1/6 1/6 1/6 1/6 1/6
 Suppose we want to estimate m from the mean
of a sample of size n = 2.
 What is the distribution of ?
Throwing a die twice – sample mean
Sample Mean Sample Mean Sample Mean
1 1,1 1 13 3,1 2 25 5,1 3
2 1,2 1.5 14 3,2 2.5 26 5,2 3.5
3 1,3 2 15 3,3 3 27 5,3 4
4 1,4 2.5 16 3,4 3.5 28 5,4 4.5
5 1,5 3 17 3,5 4 29 5,5 5
6 1,6 3.5 18 3,6 4.5 30 5,6 5.5
7 2,1 1.5 19 4,1 2.5 31 6,1 3.5
8 2,2 2 20 4,2 3 32 6,2 4
9 2,3 2.5 21 4,3 3.5 33 6,3 4.5
10 2,4 3 22 4,4 4 34 6,4 5
11 2,5 3.5 23 4,5 4.5 35 6,5 5.5
12 2,6 4 24 4,6 5 36 6,6 6
 No matter what we are measuring, the
distribution of any measure across all possible
samples we could take approximates a normal
distribution, as long as the number of cases in
each sample is about 30 or larger.
Throwing a die twice – sample mean
 The number observed in a population: This variable is represented by
"N." It is the measure of observed activity in a given group of data.
 The number observed in the sample: This variable is represented by "n."
It is the measure of observed activity in a random sample of data that is
part of the larger grouping.
 The method of choosing the sample: How the samples were chosen can
account for variability, in some cases.
Three variability factors
 The central limit theorem, first introduced by De Moivre during the early
eighteenth century, happens to be the most important theorem in statistics.
 According to this theorem, if we select a large number of simple random
samples, for example, from any population distribution and determine the
mean of each sample, the distribution of these sample means will tend to
be described by the normal probability distribution with a mean μ and
variance σ /n. Or in other words, we can say that, the sampling
𝟐
distribution of sample means approaches to a normal distribution.
 Symbolically, the theorem can be explained as following:
Central Limit Theorem
When given n independent random variables
𝑋1, 2, 3,…..
𝑋 𝑋 𝑋𝑛
which have the same distribution ( no matter
what distribution),
then :
X = 1 + 2 + 3 + … is a normal
𝑋 𝑋 𝑋 𝑋𝑛
variate. The mean μ and variance of X are
𝝈𝟐
where μ are the mean and variance of
𝟏 𝑎𝑛𝑑
𝑿𝟏
 The amount of soda pop in each bottle is normally distributed with a mean of 32.2
ounces and a standard deviation of 0.3 ounces.
 Find the probability that a bottle bought by a customer will contain more than
32 ounces.
 Solution
 The random variable X is the amount of soda in a bottle.
Example 1
7486
.
0
)
67
.
z
(
P
)
3
.
2
.
32
32
x
(
P
)
32
x
(
P
x











0.7486
x = 32  = 32.2
 Find the probability that a carton of four bottles will have a mean of more than 32
ounces of soda per bottle.
 Solution
 Define the random variable as the mean amount of soda per bottle.
Example 1 (Contd…)
9082
.
0
)
33
.
1
z
(
P
)
4
3
.
2
.
32
32
x
(
P
)
32
x
(
P
x











 = 32.2
0.7486
x = 32
32
x 
2
.
32
x 

Thank You!!

(Applied Statistics) Sampling and Sampling Distributions

  • 1.
  • 2.
  • 3.
     Aims ofSampling  Sampling Distributions  Characteristics  The Central Limit Theorem  Example Sampling and Sampling Distributions
  • 4.
     Reduces costof research (e.g. political polls)  Generalize about a larger population (e.g., benefits of sampling city r/t neighborhood)  In some cases (e.g. industrial production) analysis may be destructive, so sampling is needed Aims of sampling
  • 5.
     There arethree distinct types of distribution of data which are – 1.Population Distribution: Characterizes the distribution of elements of a population 2.Sample Distribution: Characterizes the distribution of elements of a sample drawn from a population 3.Sampling Distribution: Describes the expected behavior of a large number of simple random samples drawn from the same population. Sampling distributions constitute the theoretical basis of statistical inference and are of considerable importance in business decision- making. Sampling distributions Are important in statistics because they provide a major simplification on the route to statistical inference. Sampling Distribution
  • 6.
     Sampling distributionof the mean – A theoretical probability distribution of sample means that would be obtained by drawing from the population all possible samples of the same size.  Sampling distribution is a theoretical distribution of an infinite number of sample means of equal size taken from a population ( Walsh : 95) Sampling distribution
  • 7.
    In real lifecalculating parameters of populations is usually impossible because populations are very large. Rather than investigating the whole population, we take a sample, calculate a statistic related to the parameter of interest, and make an inference. The sampling distribution of the statistic is the tool that tells us how close is the statistic to the parameter. What Actually Sampling distribution IS
  • 8.
     Usually aunivariate distribution.  Closely approximate a normal distribution.  Sample statistic is a random variable – sample mean , sample & proportion A theoretical probability distribution  The form of a sampling distribution refers to the shape of the particular curve that describes the distribution. CHARACTERISTICS
  • 9.
     Sampling distributionis a graph which perform several duties to show data graphically.  Sampling distribution works for :  Mean  Mean absolute value of the deviation from the mean  Range  Standard deviation of the sample  Unbiased estimate of the sample  Variance of the sample FUNCTIONS OF SAMPLING DISTRIBUTION
  • 10.
     PROPERTIES OFSTATISTICS  SELECTION OF DISTRIBUTIO TYPE TO MODEL SCORE  HYPOTHESIS TESTING WHY SAMPLING DISTRIBUTION IS IMPORTANT????
  • 11.
     An example A die is thrown infinitely many times. Let X represent the number of spots showing on any throw.  The probability distribution of X is Sampling Distribution of the Mean x 1 2 3 4 5 6 p(x) 1/6 1/6 1/6 1/6 1/6 1/6
  • 12.
     Suppose wewant to estimate m from the mean of a sample of size n = 2.  What is the distribution of ? Throwing a die twice – sample mean
  • 13.
    Throwing a dietwice – sample mean Sample Mean Sample Mean Sample Mean 1 1,1 1 13 3,1 2 25 5,1 3 2 1,2 1.5 14 3,2 2.5 26 5,2 3.5 3 1,3 2 15 3,3 3 27 5,3 4 4 1,4 2.5 16 3,4 3.5 28 5,4 4.5 5 1,5 3 17 3,5 4 29 5,5 5 6 1,6 3.5 18 3,6 4.5 30 5,6 5.5 7 2,1 1.5 19 4,1 2.5 31 6,1 3.5 8 2,2 2 20 4,2 3 32 6,2 4 9 2,3 2.5 21 4,3 3.5 33 6,3 4.5 10 2,4 3 22 4,4 4 34 6,4 5 11 2,5 3.5 23 4,5 4.5 35 6,5 5.5 12 2,6 4 24 4,6 5 36 6,6 6
  • 14.
     No matterwhat we are measuring, the distribution of any measure across all possible samples we could take approximates a normal distribution, as long as the number of cases in each sample is about 30 or larger. Throwing a die twice – sample mean
  • 15.
     The numberobserved in a population: This variable is represented by "N." It is the measure of observed activity in a given group of data.  The number observed in the sample: This variable is represented by "n." It is the measure of observed activity in a random sample of data that is part of the larger grouping.  The method of choosing the sample: How the samples were chosen can account for variability, in some cases. Three variability factors
  • 16.
     The centrallimit theorem, first introduced by De Moivre during the early eighteenth century, happens to be the most important theorem in statistics.  According to this theorem, if we select a large number of simple random samples, for example, from any population distribution and determine the mean of each sample, the distribution of these sample means will tend to be described by the normal probability distribution with a mean μ and variance σ /n. Or in other words, we can say that, the sampling 𝟐 distribution of sample means approaches to a normal distribution.  Symbolically, the theorem can be explained as following: Central Limit Theorem
  • 17.
    Central Limit Theorem Whengiven n independent random variables 𝑋1, 2, 3,….. 𝑋 𝑋 𝑋𝑛 which have the same distribution ( no matter what distribution), then : X = 1 + 2 + 3 + … is a normal 𝑋 𝑋 𝑋 𝑋𝑛 variate. The mean μ and variance of X are 𝝈𝟐 where μ are the mean and variance of 𝟏 𝑎𝑛𝑑 𝑿𝟏
  • 18.
     The amountof soda pop in each bottle is normally distributed with a mean of 32.2 ounces and a standard deviation of 0.3 ounces.  Find the probability that a bottle bought by a customer will contain more than 32 ounces.  Solution  The random variable X is the amount of soda in a bottle. Example 1 7486 . 0 ) 67 . z ( P ) 3 . 2 . 32 32 x ( P ) 32 x ( P x            0.7486 x = 32  = 32.2
  • 19.
     Find theprobability that a carton of four bottles will have a mean of more than 32 ounces of soda per bottle.  Solution  Define the random variable as the mean amount of soda per bottle. Example 1 (Contd…) 9082 . 0 ) 33 . 1 z ( P ) 4 3 . 2 . 32 32 x ( P ) 32 x ( P x             = 32.2 0.7486 x = 32 32 x  2 . 32 x  
  • 20.