Downloaded 41 times

![Fractionation
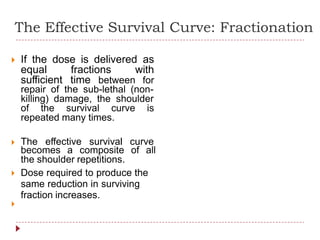
If the dose is delivered as
equal fractions with sufficient
time ,repair of sub-lethal
damage ocurs
n = exp[D / D ]q 0
104
103
Elkind‟ s Recovery takes place 102
between radiation exposure ,
cell now acts as a fresh
target.
q
101
100
-1
10
Elkind & Sutton showed that
when two exposure were given
few hours apart ,the shoulder
-2
10 5 10 2515 20
Dose (Gy)
reappeared.
Dq
n = e
D
D0
-](https://image.slidesharecdn.com/z4nxnqxms6q0bdoxup0g-signature-eaf12d6eca54dc17cb0f861df5438b7d6558073f64c8818c45af2f13932cdafa-poli-180401072642/85/Cell-survival-curve-36-320.jpg)
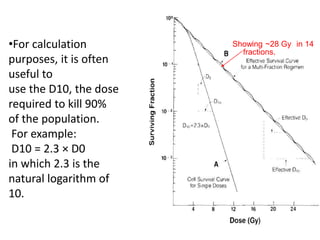
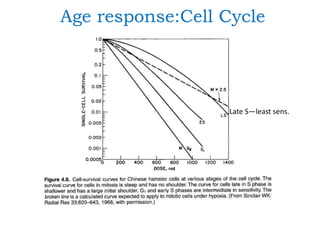


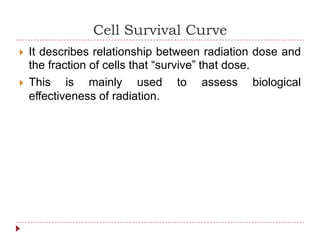
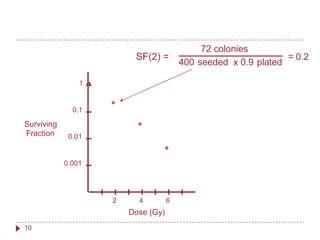
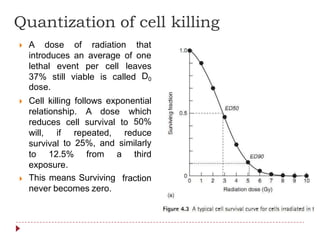
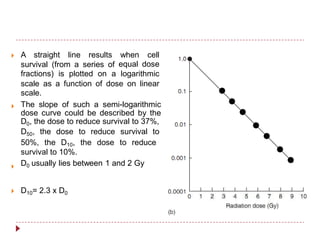
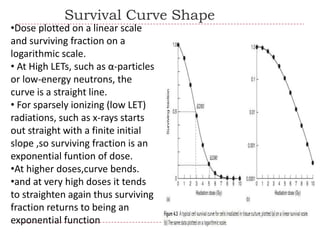
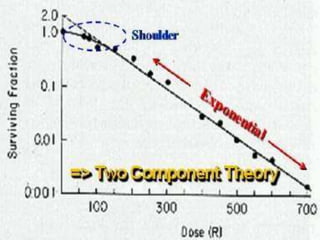
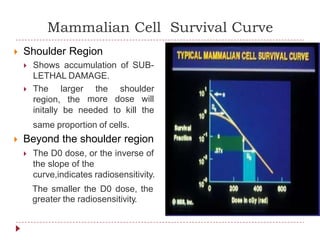
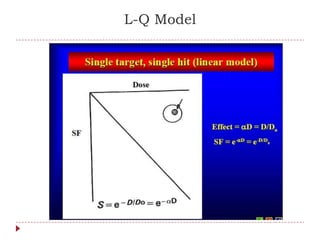
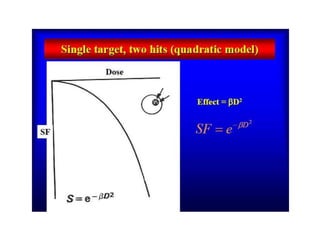
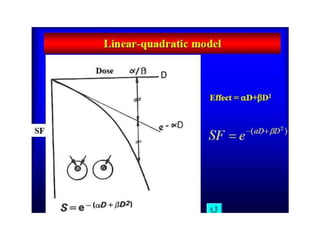
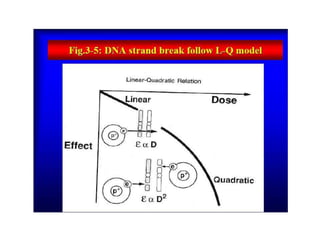
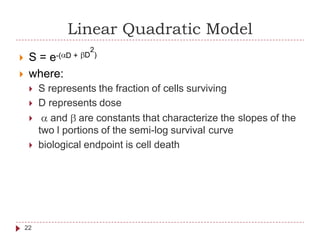
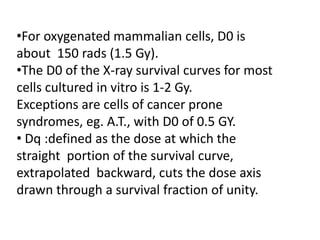
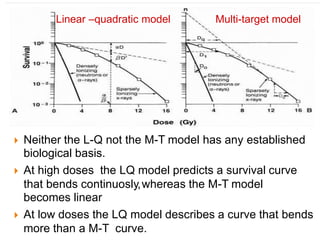
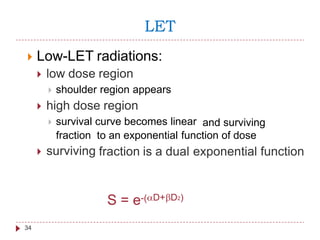
Cell survival curves describe the relationship between radiation dose and the fraction of cells that survive that dose. They are used to assess the biological effectiveness of radiation. The curves follow an exponential relationship, with cell killing increasing exponentially with dose. Two common models used to describe survival curves are the linear-quadratic model and the multi-target model. Key parameters of the curves include D0, D10, and the shoulder width, which provide information about a cell's radiosensitivity. Factors like LET, fractionation, dose rate, cell type, and oxygen presence can impact the shape and slope of the survival curve.


![Chapter 39 role of radiotherapy in benign diseases.pptx [read only]](https://cdn.slidesharecdn.com/ss_thumbnails/chapter39roleofradiotherapyinbenigndiseases-191105205437-thumbnail.jpg?width=640&height=640&fit=bounds)


