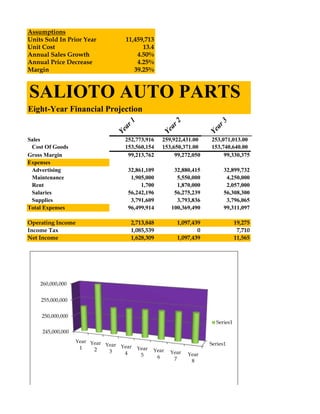
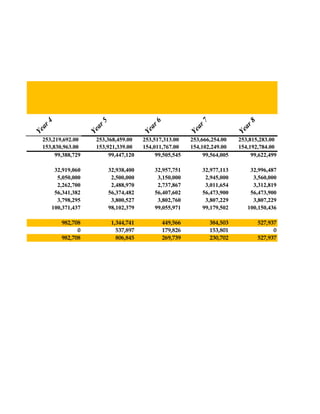
Assumptions
Units Sold In Prior Year            11,459,713
Unit Cost                                 13.4
Annual Sales Growth                     4.50%
Annual Price Decrease                   4.25%
Margin                                 39.25%


SALIOTO AUTO PARTS
Eight-Year Financial Projection

                                   r1


                                                       r2


                                                                        r3
                                   a


                                                      a


                                                                         a
                                Ye


                                                   Ye


                                                                      Ye
Sales                              252,773,916     259,922,431.00      253,071,013.00
 Cost Of Goods                     153,560,154     153,650,371.00      153,740,640.00
Gross Margin                        99,213,762          99,272,050          99,330,375
Expenses
 Advertising                        32,861,109          32,880,415           32,899,732
 Maintenance                         1,905,000           5,550,000            4,250,000
 Rent                                    1,700           1,870,000            2,057,000
 Salaries                           56,242,196          56,275,239           56,308,300
 Supplies                            3,791,609           3,793,836            3,796,065
Total Expenses                      96,499,914         100,369,490           99,311,097

Operating Income                       2,713,848          1,097,439               19,275
Income Tax                             1,085,539                  0                7,710
Net Income                             1,628,309          1,097,439               11,565


    260,000,000


    255,000,000


    250,000,000
                                                                        Series1
     245,000,000
                   Year Year                                          Series1
                             Year Year
                    1    2               Year   Year
                              3    4                   Year
                                          5      6            Year
                                                        7      8
3


      r4


                           r5


                                                r6


                                                                   r7


                                                                                       r8
       a


                            a


                                                a


                                                                    a


                                                                                        a
    Ye


                         Ye


                                             Ye


                                                                 Ye


                                                                                     Ye
      253,219,692.00       253,368,459.00    253,517,313.00      253,666,254.00      253,815,283.00
      153,830,963.00       153,921,339.00    154,011,767.00      154,102,249.00      154,192,784.00
           99,388,729           99,447,120        99,505,545          99,564,005          99,622,499

            32,919,060          32,938,400          32,957,751          32,977,113       32,996,487
             5,050,000           2,500,000           3,150,000           2,945,000        3,560,000
             2,262,700           2,488,970           2,737,867           3,011,654        3,312,819
            56,341,382          56,374,482          56,407,602          56,473,900       56,473,900
             3,798,295           3,800,527           3,802,760           3,807,229        3,807,229
           100,371,437          98,102,379          99,055,971          99,179,502      100,150,436

              982,708            1,344,741            449,566             384,503           527,937
                    0              537,897            179,826             153,801                 0
              982,708              806,845            269,739             230,702           527,937
Castillon chap3 lab1

Castillon chap3 lab1

  • 1.
    Assumptions Units Sold InPrior Year 11,459,713 Unit Cost 13.4 Annual Sales Growth 4.50% Annual Price Decrease 4.25% Margin 39.25% SALIOTO AUTO PARTS Eight-Year Financial Projection r1 r2 r3 a a a Ye Ye Ye Sales 252,773,916 259,922,431.00 253,071,013.00 Cost Of Goods 153,560,154 153,650,371.00 153,740,640.00 Gross Margin 99,213,762 99,272,050 99,330,375 Expenses Advertising 32,861,109 32,880,415 32,899,732 Maintenance 1,905,000 5,550,000 4,250,000 Rent 1,700 1,870,000 2,057,000 Salaries 56,242,196 56,275,239 56,308,300 Supplies 3,791,609 3,793,836 3,796,065 Total Expenses 96,499,914 100,369,490 99,311,097 Operating Income 2,713,848 1,097,439 19,275 Income Tax 1,085,539 0 7,710 Net Income 1,628,309 1,097,439 11,565 260,000,000 255,000,000 250,000,000 Series1 245,000,000 Year Year Series1 Year Year 1 2 Year Year 3 4 Year 5 6 Year 7 8
  • 3.
    3 r4 r5 r6 r7 r8 a a a a a Ye Ye Ye Ye Ye 253,219,692.00 253,368,459.00 253,517,313.00 253,666,254.00 253,815,283.00 153,830,963.00 153,921,339.00 154,011,767.00 154,102,249.00 154,192,784.00 99,388,729 99,447,120 99,505,545 99,564,005 99,622,499 32,919,060 32,938,400 32,957,751 32,977,113 32,996,487 5,050,000 2,500,000 3,150,000 2,945,000 3,560,000 2,262,700 2,488,970 2,737,867 3,011,654 3,312,819 56,341,382 56,374,482 56,407,602 56,473,900 56,473,900 3,798,295 3,800,527 3,802,760 3,807,229 3,807,229 100,371,437 98,102,379 99,055,971 99,179,502 100,150,436 982,708 1,344,741 449,566 384,503 527,937 0 537,897 179,826 153,801 0 982,708 806,845 269,739 230,702 527,937