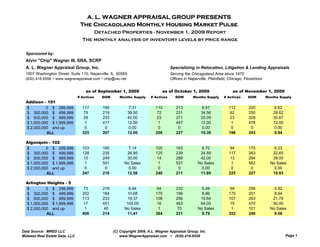
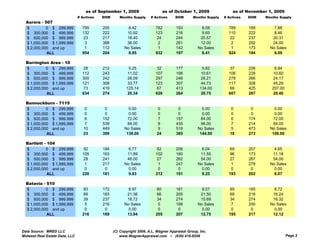
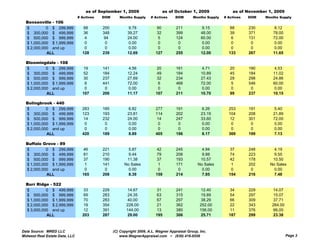
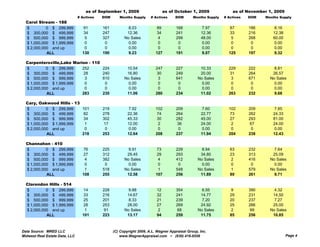
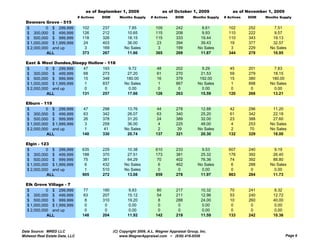
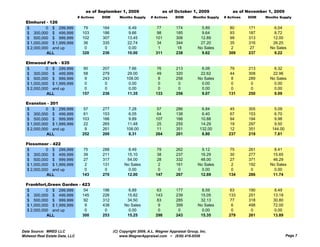
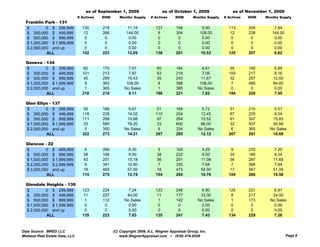
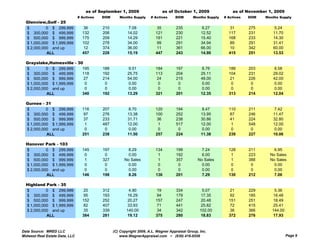
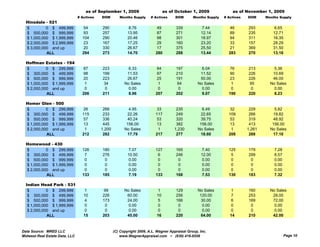
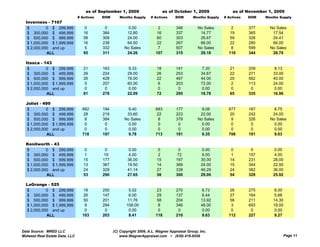
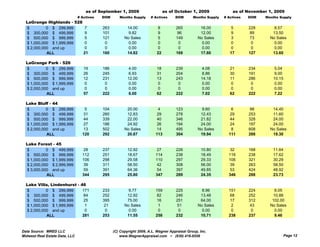
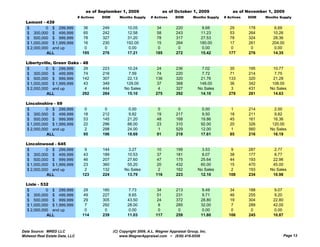
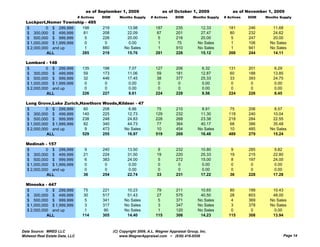
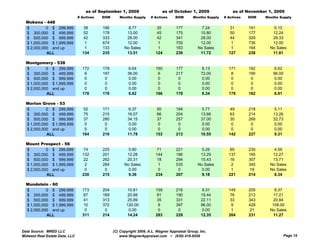
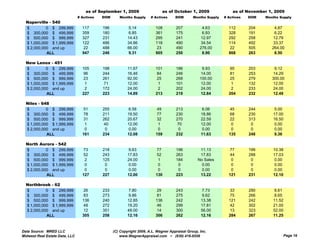
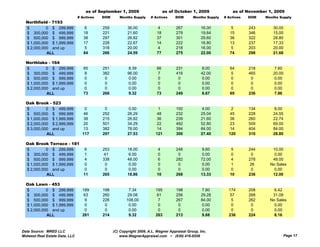
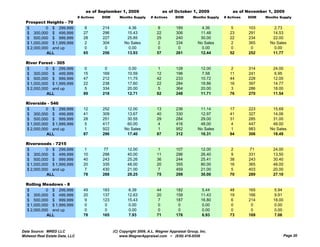
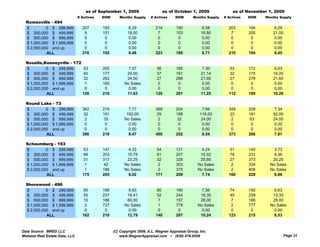
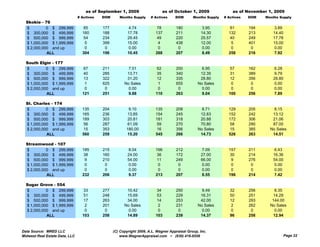
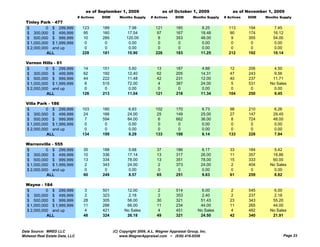
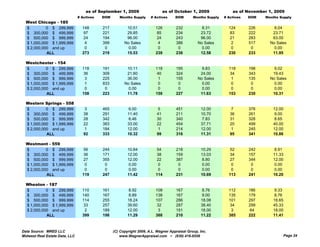
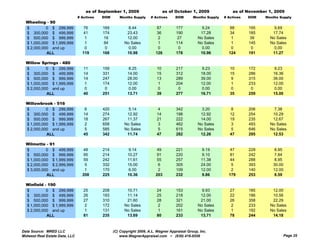
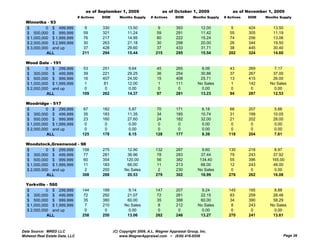
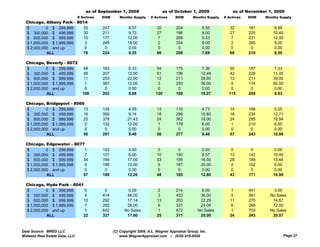
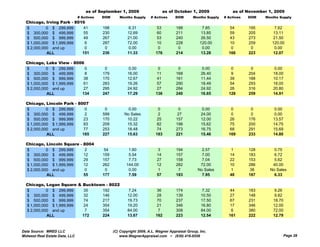
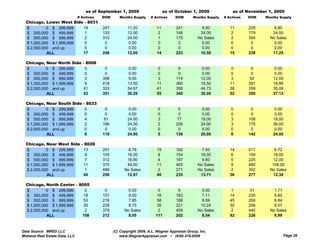
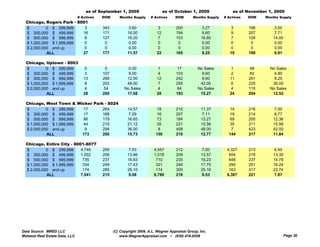
The document provides a monthly report on housing market inventory levels in various price ranges for detached properties in several Chicago suburbs. It includes data on the number of active listings, average days on market, and months of supply as of September 1, October 1, and November 1, 2009 for cities like Addison, Algonquin, Arlington Heights, Aurora, and others. The report aims to analyze housing inventory trends in these areas over the three reported months.
The document provides housing market data for several Chicago suburbs for detached properties in February 2010. It shows the number of active listings, average days on market, and months of supply by price range for each area. Overall, inventory levels were down slightly from January 2010 in most price ranges and areas. The months of supply generally ranged from 5 to 20 months, indicating a buyer's market in most areas.
This report provides a monthly analysis of housing inventory levels by price range for detached properties in several Chicago suburbs for November 2009, December 2009, and January 2010. It shows the number of active listings, average days on market, and months of supply for different price tiers in communities such as Addison, Algonquin, Arlington Heights, Aurora, and others. Overall, inventory levels decreased slightly from November to January while average days on market and months of supply generally remained stable or increased slightly.
This document provides a monthly analysis of housing market inventory levels by price range for detached properties in various Chicago suburbs for October 1, 2011. It shows data on the number of active listings, average days on market, and months of supply for different price brackets in communities such as Addison, Algonquin, Arlington Heights, Aurora, and others. The data indicates inventory levels, absorption rates, and overall housing market conditions changed slightly between August, September, and October 2011 across the different price points and locations.
1) The document analyzes housing inventory levels by price range for detached properties in several Chicago suburbs for May 1, 2010, June 1, 2010, and July 1, 2010.
2) Inventory levels fluctuated slightly between the months but remained relatively stable.
3) Days on market and months of supply also remained fairly consistent, indicating a stable and balanced housing market during this period.
This document presents housing market data for the Chicagoland area for January 2010. It provides statistics on housing inventory levels, including number of active listings, average days on market (DOM), and months of supply. The data is broken down by price range for various municipalities in the area, including Addison, Algonquin, Antioch, Arlington Heights, Aurora, Barrington Area, Bartlett, Batavia, Bensenville, and Berwyn. The report finds that in January 2010 inventory levels were generally stable or decreased slightly compared to previous months across most price ranges and locations in the Chicagoland region.
The document analyzes housing inventory levels by price range for several Chicagoland municipalities in May, June, and July 2010. It shows the number of active listings, average days on market, and months of supply for different price brackets. In most areas, inventory levels were stable or increased slightly over the three months. Average days on market remained largely similar, while months of supply increased modestly in many price categories.
This document presents a monthly report from the A. L. Wagner Appraisal Group analyzing housing market inventory levels by price range for several Chicago suburbs in February 2010. It provides data on the number of active listings, average days on market, and months of supply for different price tiers in communities such as Addison, Algonquin, Antioch, Arlington Heights, Aurora, and others. The report finds some decreases in inventory levels across most price ranges from the previous month in many areas.
The document presents data on housing market inventory levels from August 2011 through October 2011 for several Chicago suburbs. It shows the number of active listings, average days on market (DOM), and months of supply by price range for communities such as Addison, Algonquin, Antioch, Arlington Heights, Aurora, Barrington Area, and Bartlett. The data indicates that in most communities and across most price ranges, inventory levels decreased slightly from August to September to October while average DOM increased, resulting in a small decrease in months of supply over the three months.
The report analyzes housing statistics for single family homes in the Chicagoland area from October 2008 to September 2009. It shows data on inventory levels, average list prices, sales prices, months of supply, and year-over-year percentage changes for numerous towns. Most towns saw large drops in average sale prices (over 10% in many cases), increased months of housing supply, and substantial decreases in the number of sales compared to the previous year. The housing market in the Chicagoland region remained weak during the period analyzed.
Quirky's headcount grew steadily throughout 2011. By the end of the year, 239 ideas had been chosen and 36 products were on sale, with 29 in production and 74 in development. Total product revenue for 2011 was over $6.5 million, up 681% from 2010. The top 10 influencers earned over 63% of total rewards. Quirky announced a major retail partnership with a top 3 US retailer known for its community and design-centric approach. This partnership is expected to help drive further growth for Quirky in 2012.
This document summarizes key details about student loan repayment, including:
- A sample loan of $10,000 at 4% interest over 10 years would have monthly payments of $101.25 and total payments of $12,149.42, resulting in $2,149.42 in total finance costs.
- For a loan of the same amount but repaid over 15 years, the monthly payment would be $73.97 and total payments $13,314.38, resulting in $3,314.38 in total finance costs.
- Student loan interest payments may be tax deductible for those with an adjusted gross income under $65,000 (or $130,000 for joint
The document summarizes average residential home prices in the Denver metro area from 1974 to 2009. It shows that prices steadily increased over this period, rising from around $35,000 in 1974 to over $240,000 in 2009. It also includes a graph depicting the sharp rise in prices from the 1990s onwards for all areas as well as the suburbs of Denver (DSE) and southeast suburbs (SSE). Additional data lists total housing listings and sales each year to gauge market activity.
This document appears to be a sales report from an athletic apparel company listing individual employee sales, totals for various categories, and comparisons to previous months and years. It includes tables with employee names and IDs, sales amounts, commissions, and amounts for various categories like clothing, accessories, and activities. Overall sales for the month were $70,424.62 with sales representatives accounting for $69,158.62 of that total. Sales and other categories were up compared to the previous January in most cases.
The document presented Golden Heartland's proposal for a new casino and resort development. It provided details on the planned facilities including a 131,804 square foot casino, 272,000 square foot hotel, 25,000 square foot banquet space, and 293,689 square foot residential lofts. It also discussed the golf course design, projected revenues, tax structures, economic impacts and investment details such as a $661.6 million budget. The proposal aimed to demonstrate that Golden Heartland offered the right size facility for the market at the right location with an experienced management team.
This document provides monthly real estate statistics for the Cottonwood area, including Sedona and Village of Oak Creek offices, for June 2012. It includes:
- The prices, square footages, price per square foot, and acreage of 38 residential properties (houses and condos) sold between $62,699-$242,500. The average price per square foot for properties under $250,000 was $82.75.
- The prices, acreage, and price per acre of 5 residential/mobile home lots sold between $20,000-$169,900. The average price per acre was $1.57.
- Charts showing the number of active listings and pending sales amounts by month from
The document outlines a guaranteed high yield capital fund offered by Standard Morgan. It shows daily rates of return for investments of various amounts over a period of 730 days. Larger investments and longer time periods yield higher returns, with investments of $10,000 or more earning a guaranteed 0.3% daily dividend. The fund guarantees preservation of capital as well as competitive returns.
This document summarizes the projected financial performance and valuation of the Eden Grove Resort & Spa Hotel from 2011-2021. Key highlights include:
- Occupancy rates increase from 68% in 2011 to 85% in 2021 while average daily room rates rise from $450 to $550 over the same period.
- Total revenues grow from $19.2 million in 2011 to $29.5 million in 2021 as occupancy and room rates increase.
- Net income increases from $14.8 million in 2011 to $22.5 million in 2021 after accounting for operating expenses and fixed charges.
- Using a discounted cash flow analysis with a 13.25% discount rate, the projected total value of
This presentation summarizes gaming revenue projections for four proposed casinos in the Northeast Kansas gaming zone. Cummings Associates projects that the Speedway casino will generate $271.6 million in annual revenue, followed by Golden Heartland at $258.8 million, Pinnacle at $239.2 million, and Legends Sun at $212 million. Location and size are significant factors, with larger facilities projected to earn more. The projections are lower than estimates from applicants, with Cummings noting key differences in modeling assumptions around local versus long-distance customers.
The document provides monthly real estate statistics for the Cottonwood area, including Sedona and Village of Oak Creek, for May 2012. It includes:
1) A list of residential properties (houses and condos) sold in May 2012 with details like price, square footage, price per square foot, and acreage. The average price per square foot for properties under $250,000 was $75.12.
2) A single residential lot sold for $100,000 on 6.03 acres, or $0.38 per square foot.
3) Charts showing the number of active listings and pending sales (in millions) from 2010 to 2012 for the areas of Cottonwood, Bridgep
This document provides Canadian federal marginal tax rates from 1998-2012. It shows the tax brackets and tax rates for each year. Taxable income is broken into brackets such as $0-$10,527, $10,527-$42,707, etc. The rates range from 0% to 29% depending on the tax bracket. Certain types of income like gifts, inheritances, and lottery winnings are not taxed in Canada.
The document provides a daily market report that includes stock market index values, total market turnover, top gainers and losers, and upcoming rights issues. The key details are:
- The CSE All Share Index increased to 6,559.89 points and the Milanka Price Index increased to 7,110.97 points.
- Total market turnover was Rs. 3.3 billion with 332 million shares traded.
- Top gainers were Bogala Graphite, S M B Leasing, and Merchant Bank. Top losers were Good Hope, Parquet, and Environmental Resources.
- Upcoming rights issues were announced for Hotel Reefcomber, Laxapana Batteries, Blue Diam
This document provides deer claim statistics for the state of Illinois by county for the year 2005, including the number of deer claims, total losses paid for deer claims, deer claim frequency per 1,000 exposures, and deer claim frequencies and severities for previous years. Some key details include over 2,200 deer claims in Macon County resulting in over $64,000 in losses paid, and Franklin County having the highest deer claim frequency in 2005 at 23 claims per 1,000 exposures. Cook County had the lowest deer claim frequency in 2005 despite having the largest number of exposures.
Presentation given to the Iowa Wholesale Beer Distributors Association at their Annual Meeting on February 9, 2012, by ABD Administrator Stephen Larson.
The document provides data on 35 used Ford Mustangs being sold by Tom from his new car lot and performs regression analyses to determine the relationships between price and various attributes like age, miles, cylinders in order to help Tom better understand how to competitively price his inventory and maximize profits. Recommendations include focusing on the most significant factors of age, cylinders, and miles in pricing according to the regression models as well as comparing prices to industry sources and offering incentives to customers.
The document contains a table listing vehicle models for sale with their price, interest rate over 12 months, and monthly payment amounts for loans paid over 12, 24, 36, and 48 months. It also includes some sample charts showing the price, interest, and monthly payments for 6 of the vehicle models over time. The table and charts provide financial details for purchasing various cars and trucks.
The document contains monthly expense records for various utility bills and expenses including phone, light, water, community fees, food, mortgage, and gas. It shows the expenses for each month from January to July and calculates the total expenses and increases month over month. The largest expenses are the mortgage and food/groceries. It notes that the increases month over month were significant with comments of "mucho gasto" or "a lot of spending".
This document provides monthly real estate statistics for the Cottonwood area, including Sedona and Village of Oak Creek, for April 2012. It shows:
- The prices, square footages, price per square foot, and acreage of 38 residential properties (houses and condos) sold between $36,500 and $255,000. The average price per square foot for properties under $250,000 was $70.46, and $147.74 for properties between $250,000-$400,000.
- The prices, acreages, and price per acre for 4 residential lots sold between $2,500 and $41,900, with an average of $0.54 per square foot.
The report analyzes housing statistics for single family homes in the Chicagoland area from July 1, 2009 to June 30, 2010. It finds that during this period, average home sale prices decreased in most towns compared to the previous 12 months. The months of housing inventory increased in most towns as well, indicating lower housing demand. For example, in Addison the average sale price decreased 14.07% and months of inventory increased 46.01%. The report provides statistics on housing inventory levels, average list prices, homes under contract and pending sales, average sale prices, and months of housing supply for over 60 towns in the Chicagoland region.
Chicago Real Estate Market Data - Broken Down by Citybethrepta
The report provides statistics on housing market trends in various towns in the Chicagoland area between January 1, 2009 and December 31, 2009. It shows that during this period, average home sale prices declined substantially in most towns, with decreases ranging from 4.71% to 73.41%. Housing inventory levels also increased significantly across most areas. For example, months of supply increased from 7.74 to 9.78 in Arlington Heights. The report concludes that absorption rates declined and inventory levels rose sharply during 2009 compared to the previous year.
The report provides statistics on housing sales in various towns in the Chicagoland area between January 1, 2009 and December 31, 2009. It shows data such as average list prices, number of homes under contract and pending sales, number of sales in the last 12 months, average sale prices, and the percentage change in average sale prices compared to the previous year. For example, in Addison the average sale price decreased 17.01% from the previous year to $219,885, and the number of sales decreased 45.99% over the last 12 months. Overall the report indicates significant decreases in housing inventory levels, sales, and average sale prices across most towns in the Chicagoland area during 2009 compared
This document provides monthly real estate statistics for the Sedona area for August 2010, including:
- The number and prices of residential properties (houses and condos) sold, organized by square footage ranges and average price per square foot. A total of 26 residential properties were sold.
- The number and prices of residential lots sold, organized by price ranges and average price per acre. A total of 7 residential lots were sold.
- Contact information for two Coldwell Banker offices serving the Sedona area.
Coldwell Banker First Affiliate monthly stats for the Cottonwood area include:
- Sales data for January 2012 including prices, square footage, acreage and average price per square foot for residential properties and lots sold.
- Charts showing the number of active listings and pending sales in millions of dollars from 2010 to 2012.
- Tables with the number of residential units (homes, condos, mobiles) and lots sold by price range from 2010 to 2012.
The document provides monthly real estate statistics for September 2012 for areas 10-16 in the Cottonwood area, which includes Cottonwood, Bridgeport, Mingus Foothills, Verde Village, Clarkdale, and Jerome. It lists the square footage and sale prices of residential houses and condominiums sold during that month, with an average sale price per square foot of $78.92. It also lists the acreage and sale prices of residential lots sold, with an average sale price per acre of $0.39.
This document provides monthly real estate statistics for the Cottonwood area, including Sedona and Village of Oak Creek, for March 2013. It shows the square footage and sale prices of residential houses and condominiums sold, with an average sale price per square foot of $84.73 for homes under 250,000 square feet. It also lists residential/mobile home lots sold, with an average sale price per square foot of $0.87. Finally, it gives charts showing active listings, pending sales, and units sold by price range from 2011 to 2013.
This document provides monthly real estate statistics for October 2012 for areas 10-16 in the Cottonwood area, which includes Cottonwood, Bridgeport, Mingus Foothills, Verde Village, Clarkdale and Jerome. It shows that 28 residential properties (homes and condos) were sold that month with an average price per square foot of $97.11. No vacant land lots were sold. Year-to-date pending sales in millions of dollars and number of active listings are also shown, along with comparisons to prior years.
New automated techniques to validate and populate property valuationsRob Carroll
New automated techniques from Pictometry can help address budget and accuracy challenges facing property assessors. Pictometry's ChangeFindr detects property changes from aerial imagery to help identify inaccurate property records. Their Sketch Check verifies property sketches against imagery to flag discrepancies. Both aim to increase tax revenues by finding previously undetected improvements through remote desktop review, reducing the need for expensive on-site visits.
This document provides monthly real estate statistics for the Cottonwood area, including Sedona and Village of Oak Creek, for February 2013. It includes data on square footage and sale prices of residential properties sold, as well as lot sale prices and counts of active listings and pending sales. Average sale prices per square foot for different price ranges are also presented.
This document provides monthly real estate statistics for August 2012 for the Cottonwood area, including Sedona and Village of Oak Creek offices. It lists the prices, square footage, price per square foot, and acreage of 38 residential houses and condominiums that sold between $25,000 and $195,000. It also lists statistics for 2 residential lots that sold for $16,900 each. Charts show active listings and pending sales amounts from 2010 to 2012 for the Cottonwood area.
This report includes MLS data for the past 36 months in Maricopa County only as provided by the FlexMLS system. Please note that searches fluctuate daily when running these reports;these figures were obtained on 9/2/12. A reminder that you need to meet with a real estate professionalto see how statistics impact the area where you are considering selling or buying – blended statistics will not be as accurate as a more detailed report that your real estate professional can provide to help you with your decision making.
This document provides monthly real estate statistics for the Cottonwood area, including Sedona and Village of Oak Creek, for February 2012. It shows the square footage and sale prices of residential houses and condominiums sold, with averages of $73.48 per square foot for properties under $250,000 and $150 per square foot for properties between $250,000-$400,000. It also lists residential/mobile home lots sold during this period, with an average of $0.46 per square foot.
This document contains monthly real estate statistics for January 2013 from Coldwell Banker First Affiliate for the Cottonwood area, including Sedona, Village of Oak Creek, and areas 10-16. It provides data on square footage and sale prices of residential properties sold, average price per square foot, pending sales amounts, active listings, and units sold by price range. Overall, 81 properties sold totaling over $6.5 million in sales.
Bnm comparativo de provisiones oct t2001-nov2000gonzaloromani
This document is a comparative table of risk classifications and financial information for various companies from Banco Nuevo Mundo from October 2001 to November 2000. It includes information on risk level, debt amounts, guarantees, provisions, and changes from the previous period for over 50 companies across different industries like fishing, hotels, supermarkets, and construction. The levels of debt, guarantees and provisions are shown for October 2001 and November 2000 with the changes between the two periods.
Bnm comparativo de clasificaciones de riesgo nov01 - nov00gonzaloromani
This document is a comparative table of risk classifications and loan amounts for various debtors of Banco Nuevo Mundo from October 2001 to November 2000. It shows changes in risk level, outstanding debt amounts, guarantees, and loan provisions for over 50 companies from various industries including fishing, real estate, hotels, and retail. The debtors with the largest changes in outstanding debt from the previous period include Almacenes y Logistica S.A., Continental S.A., and Mavilas Hermanos S.A.
This document contains tables showing the amortization of loans with fixed monthly payments over various terms. It includes tables for loans of $10,000,000, $20,000,000, and $50,000,000 with interest rates ranging from 1.29% to 1.95% per month and terms of 1 to 5 years. Each monthly payment is comprised of interest charged on the outstanding balance and principal paid down, with the balance decreasing each period until the loan is fully paid off by the final payment.
The document describes using INDEX and MATCH formulas to retrieve data from a pivot table and populate it into a flat table. INDEX returns a value from a reference table using row and column numbers. MATCH returns the position of a value within a range which can then be used as the row or column number in INDEX. This allows data to be pulled from the pivot table into the flat table dynamically.
Part 2 Deep Dive: Navigating the 2024 Slowdownjeffkluth1
Introduction
The global retail industry has weathered numerous storms, with the financial crisis of 2008 serving as a poignant reminder of the sector's resilience and adaptability. However, as we navigate the complex landscape of 2024, retailers face a unique set of challenges that demand innovative strategies and a fundamental shift in mindset. This white paper contrasts the impact of the 2008 recession on the retail sector with the current headwinds retailers are grappling with, while offering a comprehensive roadmap for success in this new paradigm.
Zodiac Signs and Food Preferences_ What Your Sign Says About Your Tastemy Pandit
Know what your zodiac sign says about your taste in food! Explore how the 12 zodiac signs influence your culinary preferences with insights from MyPandit. Dive into astrology and flavors!
How are Lilac French Bulldogs Beauty Charming the World and Capturing Hearts....Lacey Max
“After being the most listed dog breed in the United States for 31
years in a row, the Labrador Retriever has dropped to second place
in the American Kennel Club's annual survey of the country's most
popular canines. The French Bulldog is the new top dog in the
United States as of 2022. The stylish puppy has ascended the
rankings in rapid time despite having health concerns and limited
color choices.”
Top mailing list providers in the USA.pptxJeremyPeirce1
Discover the top mailing list providers in the USA, offering targeted lists, segmentation, and analytics to optimize your marketing campaigns and drive engagement.
Structural Design Process: Step-by-Step Guide for BuildingsChandresh Chudasama
The structural design process is explained: Follow our step-by-step guide to understand building design intricacies and ensure structural integrity. Learn how to build wonderful buildings with the help of our detailed information. Learn how to create structures with durability and reliability and also gain insights on ways of managing structures.
Discover timeless style with the 2022 Vintage Roman Numerals Men's Ring. Crafted from premium stainless steel, this 6mm wide ring embodies elegance and durability. Perfect as a gift, it seamlessly blends classic Roman numeral detailing with modern sophistication, making it an ideal accessory for any occasion.
https://rb.gy/usj1a2
Industrial Tech SW: Category Renewal and CreationChristian Dahlen
Every industrial revolution has created a new set of categories and a new set of players.
Multiple new technologies have emerged, but Samsara and C3.ai are only two companies which have gone public so far.
Manufacturing startups constitute the largest pipeline share of unicorns and IPO candidates in the SF Bay Area, and software startups dominate in Germany.
Storytelling is an incredibly valuable tool to share data and information. To get the most impact from stories there are a number of key ingredients. These are based on science and human nature. Using these elements in a story you can deliver information impactfully, ensure action and drive change.
How to Implement a Real Estate CRM SoftwareSalesTown
To implement a CRM for real estate, set clear goals, choose a CRM with key real estate features, and customize it to your needs. Migrate your data, train your team, and use automation to save time. Monitor performance, ensure data security, and use the CRM to enhance marketing. Regularly check its effectiveness to improve your business.
3 Simple Steps To Buy Verified Payoneer Account In 2024SEOSMMEARTH
Buy Verified Payoneer Account: Quick and Secure Way to Receive Payments
Buy Verified Payoneer Account With 100% secure documents, [ USA, UK, CA ]. Are you looking for a reliable and safe way to receive payments online? Then you need buy verified Payoneer account ! Payoneer is a global payment platform that allows businesses and individuals to send and receive money in over 200 countries.
If You Want To More Information just Contact Now:
Skype: SEOSMMEARTH
Telegram: @seosmmearth
Gmail: seosmmearth@gmail.com
Navigating the world of forex trading can be challenging, especially for beginners. To help you make an informed decision, we have comprehensively compared the best forex brokers in India for 2024. This article, reviewed by Top Forex Brokers Review, will cover featured award winners, the best forex brokers, featured offers, the best copy trading platforms, the best forex brokers for beginners, the best MetaTrader brokers, and recently updated reviews. We will focus on FP Markets, Black Bull, EightCap, IC Markets, and Octa.
IMPACT Silver is a pure silver zinc producer with over $260 million in revenue since 2008 and a large 100% owned 210km Mexico land package - 2024 catalysts includes new 14% grade zinc Plomosas mine and 20,000m of fully funded exploration drilling.
Digital Marketing with a Focus on Sustainabilitysssourabhsharma
Digital Marketing best practices including influencer marketing, content creators, and omnichannel marketing for Sustainable Brands at the Sustainable Cosmetics Summit 2024 in New York
How to Implement a Strategy: Transform Your Strategy with BSC Designer's Comp...Aleksey Savkin
The Strategy Implementation System offers a structured approach to translating stakeholder needs into actionable strategies using high-level and low-level scorecards. It involves stakeholder analysis, strategy decomposition, adoption of strategic frameworks like Balanced Scorecard or OKR, and alignment of goals, initiatives, and KPIs.
Key Components:
- Stakeholder Analysis
- Strategy Decomposition
- Adoption of Business Frameworks
- Goal Setting
- Initiatives and Action Plans
- KPIs and Performance Metrics
- Learning and Adaptation
- Alignment and Cascading of Scorecards
Benefits:
- Systematic strategy formulation and execution.
- Framework flexibility and automation.
- Enhanced alignment and strategic focus across the organization.