Salary Survey Nov 2011
•
1 like•627 views

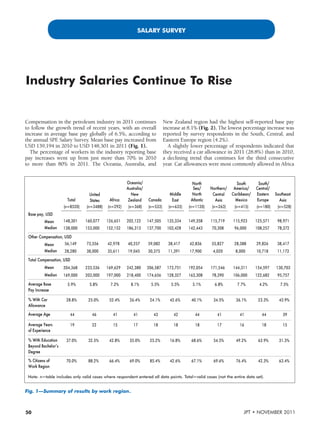
Compensation in the petroleum industry in 2011 continues to follow the growth trend of recent years, with an overall increase in average base pay globally of 6.5%, according to the annual SPE Salary Survey.

Recommended
More Related Content
What's hot
What's hot (19)
Viewers also liked
Viewers also liked (14)
Similar to Salary Survey Nov 2011
Similar to Salary Survey Nov 2011 (20)
More from Risman BizNet
More from Risman BizNet (20)
Recently uploaded
Recently uploaded (20)
Salary Survey Nov 2011
- 1. SALARY SURVEY Industry Salaries Continue To Rise Compensation in the petroleum industry in 2011 continues New Zealand region had the highest self-reported base pay to follow the growth trend of recent years, with an overall increase at 8.1% (Fig. 2). The lowest percentage increase was increase in average base pay globally of 6.5%, according to reported by survey respondents in the South, Central, and the annual SPE Salary Survey. Mean base pay increased from Eastern Europe region (4.2%). USD 139,194 in 2010 to USD 148,301 in 2011 (Fig. 1). A slightly lower percentage of respondents indicated that The percentage of workers in the industry reporting base they received a car allowance in 2011 (28.8%) than in 2010, pay increases went up from just more than 70% in 2010 a declining trend that continues for the third consecutive to more than 80% in 2011. The Oceania, Australia, and year. Car allowances were most commonly allowed in Africa Oceania/ North South South/ Australia/ Sea/ Northern/ America/ Central/ United New Middle North Central Caribbean/ Eastern Southeast Total States Africa Zealand Canada East Atlantic Asia Mexico Europe Asia (n=8520) (n=3488) (n=292) (n=368) (n=533) (n=633) (n=1120) (n=263) (n=415) (n=180) (n=528) Base pay, USD Mean 148,301 160,077 126,651 202,122 147,505 135,334 149,358 115,719 115,923 125,571 98,971 Median 138,000 153,000 152,152 186,313 137,700 103,428 142,443 70,308 96,000 108,257 78,372 Other Compensation, USD Mean 56,149 73,556 42,978 40,257 59,082 38,417 42,836 55,827 28,388 29,826 38,417 Median 28,280 38,000 35,611 19,045 30,375 11,391 17,900 4,020 8,000 10,718 11,172 Total Compensation, USD Mean 204,368 233,536 169,629 242,380 206,587 173,751 192,054 171,546 144,311 154,597 130,703 Median 169,000 203,000 197,000 218,400 174,656 128,327 163,308 78,390 106,000 122,682 95,757 Average Base 5.9% 5.8% 7.2% 8.1% 5.5% 5.5% 5.1% 6.8% 7.7% 4.2% 7.5% Pay Increase % With Car 28.8% 25.0% 52.4% 26.4% 24.1% 42.6% 40.1% 34.5% 36.1% 23.3% 43.9% Allowance Average Age 44 46 41 41 43 42 44 41 41 44 39 Average Years 19 22 15 17 18 18 18 17 16 18 15 of Experience % With Education 37.0% 32.5% 42.8% 35.0% 25.2% 16.8% 68.6% 54.5% 49.2% 63.9% 31.3% Beyond Bachelorʼs Degree % Citizens of 70.0% 88.2% 66.4% 69.0% 85.4% 42.6% 67.1% 69.6% 76.4% 42.3% 63.4% Work Region Note: n=table includes only valid cases where respondent entered all data points. Total=valid cases (not the entire data set). Fig. 1—Summary of results by work region. 50 JPT • NOVEMBER 2011
- 2. 73,556 40,257 56,149 59,082 42,836 200,000 38,417 42,978 55,827 175,000 29,826 202,122 28,388 150,000 38,417 125,000 Other compensa on USD 160,077 147,505 Base pay 100,000 149,358 125,571 148,301 115,923 75,000 135,334 126,651 115,719 50,000 98,971 25,000 0 sia pe c ico sia da st nd l es a ta tA lan ro ric Ea lA ex na at ala To Eu Af as /M At St e ra Ca Ze dl he nt rn d rth an id ite ew Ce te ut M be No Un as So n/ /N ib l/E a/ er lia ar Se rth ra ra /C nt rth st No ica Ce Au No er h/ a/ Am ut ni ea So h ut Oc So Fig. 2—Base pay and other compensation by work region. (52.4%) and least common in South, Central, and Eastern which was narrowly ahead of finance and administration Europe (23.3%). at USD 164,222 (Fig. 4). These categories were followed Experience levels in the survey remained stable over the by the drilling discipline (USD 162,240) as the high- past year with the average years of work experience at 19. est average compensation in average base pay this year. The US reported the highest average years of experience The “other” engineering category—which includes some at 22, up from 21 years in 2010. Seven out of 10 workers hybrid, multiple, or specialized disciplines—and drilling globally indicated that they are a citizen of the country showed some of the largest average percentage base pay in- in which they work; almost a third of them are expatri- creases globally. ates. North Americans were most likely to work in their Academia was one of the few categories to show flat to home countries. negative growth in average base pay over the past year, Job Categories and Total Compensation Median total compensation increased from USD 149,279 in 2010 to USD 169,000 in 2011, an increase of 13.2% About the Survey (Fig. 3). The region with the highest median total compen- Invitations to participate in the annual SPE Salary sation increase was Oceania, Australia, and New Zealand. Survey were sent to 49,239 professional members The region with the lowest overall compensation was by email. This year, 8,520 members responded to Southeast Asia, followed by the South America, Caribbean, the survey, resulting in a 17.3% response rate. This and Mexico region. sample produces a margin of error of ±1.1% at a 95% Overall compensation increases are driven by strong confidence level. growth among all levels in Oceania, including Australia and This year’s participants are based in 98 countries New Zealand. The US, Canada, and the Middle East also and represent citizenship in 101 countries. Their experienced strong growth in top-level compensation, while employers are based in 99 countries, and 46 US states. the US; Southeast Asia; South, Central, and Eastern Europe; A majority of respondents (54.6%) work and live in and Oceania reported growth in the lower-tier categories. countries outside the US, reflecting SPE’s increasing Professionals in the US, Oceania, North and Central Asia, international membership reach. and Canada reported some of the highest percentage increas- All compensation data presented in this report es among all categories and regions. is expressed in US dollars (USD). Data collected in local currencies have been converted to USD using Job Function and Base Pay the exchange rate as of 15 August 2011, which is the Engineering in “other technical categories” represented effective date of this year’s data. the highest mean base pay in 2011 at USD 164,270, JPT • NOVEMBER 2011 51
- 3. SALARY SURVEY North South South/ Oceania/ Sea/ Northern/ America/ Central/ United Australia/ Middle North Central Caribbean/ Eastern Southeast States Africa New Zealand Canada East Atlantic Asia Mexico Europe Asia Executive/Top 447,557 341,393 464,027 337,123 473,735 405,336 337,492 285,636 290,108 254,024 Management Manager/Director 285,321 256,030 352,907 276,936 245,161 239,889 249,026 208,603 226,111 186,663 Supervisor 181,524 128,383 183,555 163,212 153,085 145,858 99,587 108,396 113,611 85,370 Professional 216,078 177,565 239,139 202,235 153,334 195,241 211,807 134,825 111,908 146,941 Technician/Specialist 149,273 72,096 138,522 132,670 89,804 125,485 50,838 80,840 84,598 31,690 Fig. 3—Total compensation by job category and work region. (Compensation data expressed in USD.) Oceania/ North South South/ Australia/ Sea/ Northern/ America/ Central/ United New Middle North Central Caribbean/ Eastern Southeast States Africa Zealand Canada East Atlantic Asia Mexico Europe Asia Average College/University/Academic 107,247 94,227 77,294 161,866 61,107 79,741 37,447 60,101 17,646 5,760 82,983 Computer or Information 143,982 52,282 * 112,843 114,910 154,597 42,000 62,818 28,489 52,128 122,954 Technology Earth Science/Geology 164,732 89,017 235,582 195,809 124,921 157,588 117,610 80,675 142,662 104,414 152,091 Engineering— 152,059 40,611 138,513 95,667 75,366 138,834 59,767 57,514 48,838 37,241 105,035 Chemical/Chemistry Engineering— 157,734 117,131 189,073 138,864 101,585 130,809 134,599 105,027 185,176 79,529 139,804 Civil/Construction/Facilities Engineering—Completions 154,149 106,829 156,681 128,853 150,106 144,646 91,125 107,554 202,831 89,300 144,023 Engineering—Drilling 175,363 144,631 236,796 157,086 116,539 170,242 127,132 142,137 118,373 148,641 162,240 Engineering— 148,072 66,371 306,116 130,915 138,518 125,340 177,727 126,867 164,268 49,833 140,082 Health/Safety/Environment Engineering—Other or 175,424 177,779 206,771 158,272 134,163 158,502 180,256 115,453 164,182 108,340 164,270 Combination of Above Engineering—Production 143,047 116,727 153,941 137,100 110,010 152,624 94,608 100,927 114,440 81,032 131,225 Engineering—Reservoir 169,272 120,441 196,743 145,716 139,275 142,014 96,722 109,560 92,983 85,924 148,694 Finance or Administration 170,602 37,272 288,802 134,518 136,122 186,360 101,045 115,309 368,629 121,031 164,222 Geophysics/Petrophysics/ 152,475 145,742 181,560 129,384 117,137 135,485 148,051 137,806 45,913 83,946 137,208 Physics Non-Engineering Technical 130,801 197,668 175,066 119,748 556,686 169,771 43,571 116,054 108,257 98,711 160,567 Other or Combination of 182,360 165,758 264,136 182,068 179,297 162,355 176,214 148,625 182,398 132,010 176,775 Above Professional Training 139,894 180,000 207,014 120,000 141,327 102,485 120,000 85,230 48,431 8,708 123,507 Research 139,544 * 181,482 158,819 157,277 119,585 41,916 114,921 83,263 21,621 128,254 Sales or Marketing 131,590 105,919 178,094 140,710 141,656 143,579 144,895 120,970 194,886 113,863 136,008 *Table includes only cell values containing adequate valid cases to be statistically representative. Note: Cells without data did not have enough responses to represent statistically valid data. Fig. 4—Base pay by region of company headquarters and job function. (Compensation data expressed in USD.) 52 JPT • NOVEMBER 2011
- 4. 90.0% Some nontechnical categories, such as marketing and 80.9% 83.6% Male 80.0% research, reported moderate increases, while the professional Female training and college/university/academic categories’ average 70.0% compensation showed a decrease from 2010 to 2011. 60.0% 50.0% Gender and Experience Women in the industry were again more likely to report a 40.0% positive change in base pay, with 83.6% reporting a positive 30.0% change in income in 2011, compared with 80.9% of males 20.0% 17.2% 15.4% reporting an increase in base pay (Fig. 5). Both genders 10.0% were about 10% more likely to report positive change than 1.9% in 2010. 1.1% 0.0% Both average level of experience and total compensation Positive change No change Negative change increased for both men and women in 2011 (Fig. 6). Some of the largest percentage increases were among female top exec- Fig. 5—Members’ change in salary since July 2010, by utives and male professionals, supervisors, and technicians/ gender. specialists. Base pay and total compensation again shows the value of experience, with top-level managers and directors and remained the lowest average mean compensation cat- earning significantly more than other categories of workers. egory at USD 82,983, followed by chemical engineering at USD 105,035. Southeast Asia showed the widest disparity in mean com- This article represents a portion of the full SPE Salary Survey. pensation in most categories, compared with other regions, For the full report, please go to the SPE Bookstore at www.spe. followed by North and Central Asia. Southeast Asia reported org/store. Data tables are also available for download through strong growth in compensation in the computer/information the bookstore to provide the opportunity for individual analysis technology category, as well as in the “other” or combination and localization of data. Questions about the survey can be engineering discipline category. addressed to speresearch@spe.org. JPT Female Male Executive/Top Manager/ Technician/ Executive/Top Manager/ Technician/ Management Director Professional Supervisor Specialist Management Director Professional Supervisor Specialist Average Years of 24 20 10 15 10 29 25 16 21 15 Experience Number of 22 80 473 103 71 489 1,576 2,907 1,259 303 Records Base Pay, 193,573 155,418 104,389 118,101 63,246 232,120 184,103 129,747 193,573 155,418 USD Other Cash, 66,247 64,102 25,283 26,057 7,058 183,870 83,242 35,474 66,247 64,102 USD Total Cash, 259,821 219,520 129,451 144,159 70,304 415,038 267,038 267,345 259,821 219,520 USD Fig. 6—Cash compensation by position and experience. JPT • NOVEMBER 2011 53