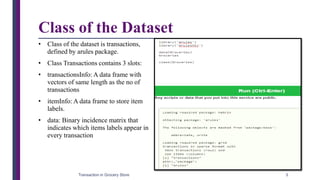
This document outlines a case study on data analytics applied to a grocery store using R programming and the arules package to analyze a dataset containing 9,835 transactions. It describes the installation of necessary packages, creation of frequent itemsets with the apriori algorithm, and the generation and visualization of association rules derived from the dataset. Key findings include the most frequently purchased items and visualization techniques to represent rules based on support and confidence metrics.
![Display Transaction as per Customer Cart
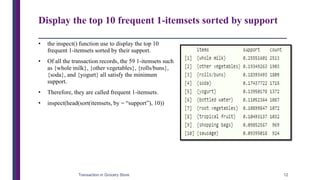
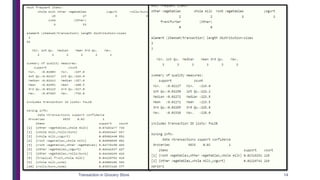
• The following code displays the 10th to 20th
transactions of the Groceries dataset.
• The [10:20] can be changed to [1:9835] to
display all the transactions.
• apply(Groceries@data[,10:20], 2, function(r)
paste(Groceries@itemInfo[r,“labels”],
collapse=”, “) )
• Each row in the output shows a transaction
that includes one or more products, and each
transaction corresponds to everything in a
customer’s shopping cart.
• For example, in the first transaction, a
customer has purchased whole milk and
cereals.
Transaction in Grocery Store 8](https://image.slidesharecdn.com/41divyawanidacasestudy-200921165744/85/Case-study-on-Transaction-in-Grocery-Store-8-320.jpg)


![[DSC Europe 25] Mikhail Rozhkov - AI Product Canvas: From Business Goals to T...](https://cdn.slidesharecdn.com/ss_thumbnails/d53doddtpgfqivmzqel6-mikhail-rozhkov-ai-product-canvas-v1-260121115910-9dd517a7-thumbnail.jpg?width=640&height=640&fit=bounds)

![[DSC Europe 25] Borko Kozomora - Optimizing business workflows with advances ...](https://cdn.slidesharecdn.com/ss_thumbnails/hbgekyb0txw0xpo4yfml-borko-kozomora-leading-ai-transformation-260122103838-cc29ee38-thumbnail.jpg?width=640&height=640&fit=bounds)

![[DSC Europe 25] Laila Kakar - Leveraging AI for Strategic Excellence: Enhanci...](https://cdn.slidesharecdn.com/ss_thumbnails/eykmhrtsqmaaftwkexh7-dsc-lailakakar-1-260119101520-5f3b5616-thumbnail.jpg?width=640&height=640&fit=bounds)


![[DSC Europe 25] Srdj Stanisic - Local and Private AI in UX.pdf](https://cdn.slidesharecdn.com/ss_thumbnails/vwmetykqmztgmokmmkfa-3-srdjan-stanisic-local-and-small-ai-in-ux-260120105855-55a31869-thumbnail.jpg?width=640&height=640&fit=bounds)
![[DSC Europe 25] Harshvardhan Jain - From Pre-Trained to Purpose-Built: Fine-T...](https://cdn.slidesharecdn.com/ss_thumbnails/zru4zmiseku5tgvu2dgw-harshvardhan-jain-from-pre-trained-to-purpose-built-fine-tuning-llms-for-high-i-260119101520-8335585f-thumbnail.jpg?width=640&height=640&fit=bounds)


![[DSC Europe 25] Jovan Sumarac - Real-World Applications of Computer Vision in...](https://cdn.slidesharecdn.com/ss_thumbnails/fiksms22smcpopvvld03-jovan-sumarac-real-life-applications-of-computer-vision-in-automotive-systems-260120105855-de622abb-thumbnail.jpg?width=640&height=640&fit=bounds)

![[DSC Europe 25] Tali Fulman - Guild Meetings, Then What? Building Data Commun...](https://cdn.slidesharecdn.com/ss_thumbnails/fgohhi33rwmhqdowdj5k-tali-fulman-guild-meetings-then-what-building-data-communities-that-actually-ch-260120105855-528492c3-thumbnail.jpg?width=640&height=640&fit=bounds)


