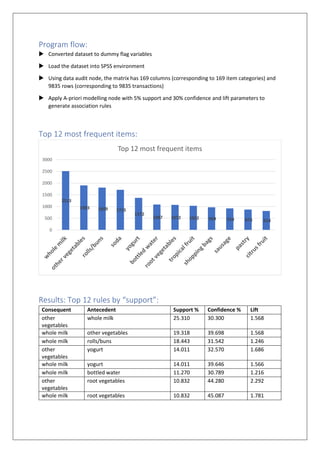
- The document discusses market basket analysis and association rule mining, which are techniques used to analyze purchasing patterns in transactional data.
- It provides an example of an association rule discovered from store transaction data: "If a basket contains beer, it is likely to also contain diapers." Knowing this, the store changed its layout to place diapers and beer next to each other, increasing sales of both products.
- The key measures for evaluating association rules are support, confidence and lift, which indicate how often items are purchased together versus by chance alone. Market basket analysis can help businesses promote complementary products and increase overall revenue.
This document provides information about a course on data warehousing and data mining, including:
1. It outlines the course syllabus which covers the basics of data warehousing, data preprocessing, association rules, classification and clustering, and recent trends in data mining.
2. It describes the 5 units that make up the course, including an overview of the topics covered in each unit such as data warehouse architecture, data integration, decision trees, and applications of data mining.
3. It lists two textbooks and four references that will be used for the course.
Binary search is an algorithm that finds the position of a target value within a sorted array. It works by recursively dividing the array range in half and searching only within the appropriate half. The time complexity is O(log n) in the average and worst cases and O(1) in the best case, making it very efficient for searching sorted data. However, it requires the list to be sorted for it to work.
The document discusses market basket analysis and the Apriori algorithm. It provides an introduction to market basket analysis and defines key terms like transactions, support, confidence and frequent itemsets. It then explains the Apriori algorithm for finding frequent itemsets and generating association rules. The document demonstrates the algorithm with three examples: using a self-created table, Oracle's sample schema, and extending the results to an OLAP analytic workspace to add dimensions and measures. It concludes that market basket analysis can determine customer buying patterns and OLAP can further analyze other metrics like revenue and costs.
Data Science - Part VI - Market Basket and Product Recommendation EnginesDerek Kane
This lecture provides an overview of association analysis, which includes topics such as market basket analysis and product recommendation engines. The first practical example centers around analyzing supermarket retailer product receipts and the second example touches upon the use of the association rules in the political arena.
Data Analysis: Evaluation Metrics for Supervised Learning Models of Machine L...Md. Main Uddin Rony
This document discusses various machine learning evaluation metrics for supervised learning models. It covers classification, regression, and ranking metrics. For classification, it describes accuracy, confusion matrix, log-loss, and AUC. For regression, it discusses RMSE and quantiles of errors. For ranking, it explains precision-recall, precision-recall curves, F1 score, and NDCG. The document provides examples and visualizations to illustrate how these metrics are calculated and used to evaluate model performance.
The Presentation is regarding the Market Basket Analysis Concept which is done practically with the real world data from a small Canteen. This is completely a real time data on which the analysis results are drawn.
Supervised learning and Unsupervised learning Usama Fayyaz
This document discusses supervised and unsupervised machine learning. Supervised learning uses labeled training data to learn a function that maps inputs to outputs. Unsupervised learning is used when only input data is available, with the goal of modeling underlying structures or distributions in the data. Common supervised algorithms include decision trees and logistic regression, while common unsupervised algorithms include k-means clustering and dimensionality reduction.
BCA DATA STRUCTURES SEARCHING AND SORTING MRS.SOWMYA JYOTHISowmya Jyothi
1. The document discusses various searching and sorting algorithms. It describes linear search, which compares each element to find a match, and binary search, which eliminates half the elements after each comparison in a sorted array.
2. It also explains bubble sort, which bubbles larger values up and smaller values down through multiple passes. Radix sort sorts elements based on individual digits or characters.
3. Selection sort and merge sort are also summarized. Merge sort divides the array into single elements and then merges the sorted sublists, while selection sort finds the minimum element and swaps it into place in each pass.
This presentation is about basics of Big data Analytics along with Characteristics,Challenges,Structures,Differences between Traditional and Big data,How Big data is getting benefited in Healthcare Industry,Big data in Real time
Prediction of customer propensity to churn - Telecom IndustryPranov Mishra
- A logistic regression model was found to best predict customer churn with the highest AUC and accuracy.
- The top variables increasing churn risk were credit class, handset price, average monthly calls, billing adjustments, household subscribers, call waiting ranges, and dropped/blocked calls.
- Cost and billing variables like charges and usage were significant, validating an independent survey.
- A lift chart showed targeting the highest risk 30% of customers could identify 33% of potential churners. The model allows prioritizing retention efforts on the 20% riskiest customers.
Temporal data mining aims to discover patterns from time-ordered data where observations may be dependent on preceding observations. Key concepts include temporal patterns, time series, frequent episodes, and Markov models. Temporal association mining finds relationships between events separated by time intervals, such as purchases associated with prior purchases. Markov models represent sequences where the next state depends only on the current state, and are used for tasks like predicting website clicks based on prior clicks.
The document provides information about what a data warehouse is and why it is important. A data warehouse is a relational database designed for querying and analysis that contains historical data from transaction systems and other sources. It allows organizations to access, analyze, and report on integrated information to support business processes and decisions.
The document discusses the Apriori algorithm, which is used for mining frequent itemsets from transactional databases. It begins with an overview and definition of the Apriori algorithm and its key concepts like frequent itemsets, the Apriori property, and join operations. It then outlines the steps of the Apriori algorithm, provides an example using a market basket database, and includes pseudocode. The document also discusses limitations of the algorithm and methods to improve its efficiency, as well as advantages and disadvantages.
The document discusses database management systems and their advantages over traditional file systems. It covers key concepts such as:
1) Databases organize data into tables with rows and columns to allow for easier querying and manipulation of data compared to file systems which store data in unstructured files.
2) Database management systems employ concepts like normalization, transactions, concurrency and security to maintain data integrity and consistency when multiple users are accessing the data simultaneously.
3) The logical design of a database is represented by its schema, while a database instance refers to the current state of the data stored in the database tables at a given time.
Association rule mining finds frequent patterns and correlations among items in transaction databases. It involves two main steps:
1) Frequent itemset generation: Finds itemsets that occur together in a minimum number of transactions (above a support threshold). This is done efficiently using the Apriori algorithm.
2) Rule generation: Generates rules from frequent itemsets where the confidence (fraction of transactions with left hand side that also contain right hand side) is above a minimum threshold. Rules are a partitioning of an itemset into left and right sides.
Data Science - Part VIII - Artifical Neural NetworkDerek Kane
This lecture provides an overview of biological based learning in the brain and how to simulate this approach through the use of feed-forward artificial neural networks with back propagation. We will go through some methods of calibration and diagnostics and then apply the technique on three different data mining tasks: binary prediction, classification, and time series prediction.
SQL Server database project ideas - Top, latest and best project ideas final ...Team Codingparks
SQL Server database project ideas - Top, latest and best project ideas final year engineering students.
1. Students Management System SQL Server database project idea.
2. Employees Management System idea in SQL Server for final year projects.
3. Taxi Management system project ideas in SQL Server for final year students.
4. Hotel Management System in SQL Server database project ideas for final engineering students
5. University Management System in SQL Server database project ideas for final year engineering students.
6. Hospital Management System in SQL Server database project ideas for final year students.
7. Petrol Pump sales database management in SQL Server final year engineering students.
8. Store My Information project ideas for final year student of engineering in SQL server.
9. Billing management system in SQL Server for final year engineering students.
10. Laboratory Management System in SQL Server for final year students of engineering.
11. Taxi Centre management system in SQL Server for final year students
12. Shopkeeper management system in SQL Server for final year students.
13. Students Attendance Management system – MS Access project idea for students.
14. Laboratory Management System for Labs Microsoft’s MS Access project idea.
15. Ticket Reservation System project ideas for students in MS Access.
16. Student’s admission Record Management System for the high school students.
17. Chemist Shop Management System project idea in MS Access database software.
18. Parking Management System for final year students, SQL Server database project ideas.
Case-based reasoning (CBR) is a learning paradigm that classifies new instances by analyzing similar past instances, ignoring dissimilar ones. It uses symbolic representations rather than real-valued points. CBR has been applied to conceptual design, legal reasoning, and planning by reusing solutions to similar past problems. The CADET system employs CBR to design simple mechanical devices like faucets, using a library of 75 past designs. It represents functions with qualitative relationships between input and output water levels and temperatures. CADET searches the library for exact functional description matches or partial subgraph matches to suggest solutions for new design problems.
The document provides an introduction to the concept of data mining, defining it as the extraction of useful patterns from large data sources through automatic or semi-automatic means. It discusses common data mining tasks like classification, clustering, prediction, and association rule mining. Examples of data mining applications are also given such as marketing, fraud detection, and scientific data analysis.
Reporting involves users selecting predefined reports to view results in standardized formats like tables and graphs. No person is involved beyond the user requesting the report. Reports have limited flexibility.
Analysis provides answers to specific questions by taking any necessary steps through a guided process. It is customized and flexible to the questions being addressed.
Modern data analytics tools use statistical modeling approaches like probability, sampling, inference, and machine learning algorithms like neural networks and support vector machines to gain insights from data.
The document discusses market basket analysis and the Apriori algorithm. Market basket analysis is used to discover frequent item sets purchased together in transaction data. The Apriori algorithm is used to find these frequent item sets by scanning transactions to count item occurrences, filtering out infrequent items, and generating candidate item sets. Frequent item sets can be used for applications like cross-selling items, proper item placement, fraud detection, understanding customer behavior, and affinity promotion.
This document discusses decision trees and their use in predictive modeling. It provides an example of using a decision tree to predict credit ratings. The decision tree splits the data into nodes based on variables like checking accounts, savings accounts, and duration. Each node shows the percentage of good and bad credit ratings, with deeper nodes having higher percentages. Decision trees allow targeting subsets of a population that have higher response rates to improve outcomes.
This document provides information on insertion sort, quicksort, and their time complexities. It describes how insertion sort works by dividing an array into sorted and unsorted parts, iterating through elements to insert them in the correct position. Quicksort chooses a pivot element and partitions the array into sub-arrays of smaller size, recursively sorting them. For worst-case complexities, insertion sort is O(n^2) while quicksort can also be O(n^2) if the array is already sorted. On average, insertion sort is still O(n^2) whereas quicksort has a lower complexity of O(nlogn).
The document is a presentation on using R for analytics. It discusses data mining, business analytics, the CRISP-DM process, machine learning algorithms like naive bayes and random forests, and association rule mining. Association rule mining finds relationships between variables in large datasets. It identifies strong rules using measures like support, confidence and lift. The presentation shows an example of applying association rule mining to grocery purchase data to discover rules like "customers who buy OJ also frequently buy soda". Visualization techniques in R are used to analyze the rules.
I just gave a opening keynote on the North American Precision dairy farming conference. I showed some data that we recently collected on the use of sensor systems and the effects of these systems on farm performance.
Frequent pattern mining is an analytical algorithm that is used by businesses and, is accessible in some self-serve business intelligence solutions. The FP Growth analytical technique finds frequent patterns, associations, or causal structures from data sets in various kinds of databases such as relational databases, transactional databases, and other forms of data repositories.
The document describes a capstone design project called MonitorIT that aimed to create an automated and data-driven pharmaceutical bottling process. A group of three students created a prototype bottling line that incorporated an existing bottling assembly. An Allen-Bradley PLC was used to control the process and collect production data, which was then sent to an OPC server and data historian. This allowed real-time production data to be accessed from a web-based HMI and analyzed to forecast future medication demands based on illness diagnoses. The goal was to leverage industry 4.0 principles to help pharmaceutical companies more efficiently produce medications for non-communicable diseases in low- and middle-income countries.
This document provides an overview of a handbook for assessing and managing environmental and social risks in agro-commodity supply chains. The handbook covers topics such as the business case for managing supply chain risks, common environmental and social risks, environmental and social management systems, case studies of risk assessment and management, traceability, and certification. It also includes two toolkits for assessing and managing risks in supply chains. The document lists acronyms and introduces the structure and contents of the full handbook.
The document discusses the increasing role of information and communication technologies (ICT) in agriculture and food systems. It describes how technologies like mobile/cloud computing, location-based monitoring, the Internet of Things, and big data can help address challenges in transportation, input supply, farming, food processing, retail, and consumer demands. Examples are provided of ICT solutions that offer benefits like early detection of animal health issues, optimized crop spraying advice, and food traceability. Concerns are raised about issues like data ownership and the potential for industry consolidation or lock-in under different business models enabled by big data in agriculture.
Global Organic Skim Milk Market Report from AMA Research highlights deep analysis on market characteristics, sizing, estimates and growth by segmentation, regional breakdowns & country along with competitive landscape, players market shares, and strategies that are key in the market. The exploration provides a 360° view and insights, highlighting major outcomes of the industry. These insights help the business decision-makers to formulate better business plans and make informed decisions to improved profitability. In addition, the study helps venture or private players in understanding the companies in more detail to make better informed decisions.
Nationwide Interoperability Roadmap draft version 1.0Ed Dodds
This document presents a draft nationwide interoperability roadmap with the goal of achieving a learning health system over 10 years. The roadmap identifies barriers to current interoperability and lays out a vision, principles, and critical actions for stakeholders. The near-term focus is enabling individuals, providers, and care teams to send, receive, find and use a common set of clinical data by 2017. This includes standardized elements to improve data matching and aggregation for issues like research, personalized medicine, and disparities. The roadmap provides a path from today's landscape to an expanded future state with more ubiquitous sharing of information beyond clinical records for person-centered care and a learning health system.
Health care interoperability roadmap released by HHS ONCDavid Sweigert
This document provides a draft nationwide interoperability roadmap with the goal of achieving an interoperable health IT system to support a broad scale learning health system by 2024. It lays out critical actions that need to be taken by public and private stakeholders in areas such as rules of engagement and governance, supportive business and regulatory environments, privacy and security, certification and testing, core technical standards and functions, and tracking progress. The roadmap was developed through collaboration with federal, state and private partners and is intended to be a living document that will continue to evolve based on input from stakeholders. It identifies priority actions that various stakeholders can commit to in order to advance the country towards the goal of nationwide health information interoperability.
This document summarizes a study on the impacts of dairy development programs in Andhra Pradesh, India. It analyzes typical dairy farms in two regions - a progressive region with high milk production and a lagging region with lower production. For each region, farms ranging from landless to commercial sizes are evaluated. The study finds household incomes range from $1,000-4,000 per year. Only larger farms in both regions earn a profit when family labor costs are included. It assesses over 40 dairy development programs and their potential to increase household income and dairy competitiveness. Replacing local buffaloes with graded ones, increasing herd size, producing fodder for sale, and maximizing off-farm labor had the largest
European healthcare – the good, the bad and what
needs to be done?
Ten years of open assessment have taught Health Consumer Powerhouse that there are
surprisingly stable patterns of national healthcare systems of Europe. Some are quite
positive: overall, the performance of almost every country improves year by year, offering
more than 500 million people stronger patient influence, better access, reduced risk of
medical failures, improved treatment outcomes and, even in times of significant funding
pressure, extended range and reach of services in the public package. The negative impact
from austerity policies were somewhat increased waiting in some countries (largely reversed
in 2014) and slower inclusion of new pharmaceuticals in reimbursement systems.
This document is a capstone project report analyzing the Australia grocery market which is dominated by Woolworth and Coles with over 60% combined market share. The report includes an introduction outlining the research topic and background. It then provides a literature review on relevant anti-combination laws, the effects of monopoly, and risk analysis. The report also describes the data collection and analysis methodology to be used. It will analyze factors related to the grocery industry and identify hypotheses about whether the current monopoly is optimal for the Australian market and consumers. The conclusion will forecast if other competitors could become major players by utilizing appropriate short- and long-term strategies.
The document discusses association rule mining and market basket analysis. It begins by describing the problem - a retailer tracking what items customers purchase together. It then provides definitions for key concepts in association rule mining like support, confidence and lifts. The goal is to discover all association rules that have minimum support and confidence thresholds. Common algorithms like Apriori are described to efficiently generate frequent itemsets and association rules from transactional data.
How Can We Use Big Data in the Food Supply Chain EtQ, Inc.
The document discusses how using big data in the food supply chain can help reduce risks by providing a broader perspective. It explains that big data involves combining different datasets from various sources to gain more context about supply chain issues. This allows companies to identify risks that may not be obvious when only looking at their own internal data. The document recommends moving supply chain management to the cloud to more easily collect and analyze data from multiple sources. This provides tools like improved transparency, real-time responsiveness, and a comprehensive view of the entire supply chain from farm to fork.
Association rule mining and Apriori algorithmhina firdaus
The document discusses association rule mining and the Apriori algorithm. It provides an overview of association rule mining, which aims to discover relationships between variables in large datasets. The Apriori algorithm is then explained as a popular algorithm for association rule mining that uses a bottom-up approach to generate frequent itemsets and association rules, starting from individual items and building up patterns by combining items. The key steps of Apriori involve generating candidate itemsets, counting their support from the dataset, and pruning unpromising candidates to create the frequent itemsets.
This document provides checklists of control points for good management practices on dairy farms. It covers areas like housing, feed, water, environment, electrical systems, pathogen reduction, and milk harvesting. Each checklist includes topics like animal welfare, cleanliness, maintenance, and quality assurance. References to more detailed Dairy Practices Council guidelines are included to provide additional information on each topic. The goal is to help dairy farmers implement practices that ensure animal health and well-being, as well as food safety.
This document analyzes factors affecting the farmgate price of cashew nuts in Vietnam. It uses a hedonic pricing model to examine how quality, seasonality, household characteristics, infrastructure, market information and other variables influence the price farmers receive. The study also assesses value added across the cashew supply chain from farmers to processors. It finds that farmers generally earn the lowest monthly income compared to other supply chain participants. However, farmers can gain additional profits by performing post-harvest activities themselves, such as peeling cashew nuts. The analysis aims to identify ways to improve farmgate prices and marketing opportunities for farmers.
Similar to Market basket analysis using apriori algorithm on (20)
06-04-2024 - NYC Tech Week - Discussion on Vector Databases, Unstructured Data and AI
Discussion on Vector Databases, Unstructured Data and AI
https://www.meetup.com/unstructured-data-meetup-new-york/
This meetup is for people working in unstructured data. Speakers will come present about related topics such as vector databases, LLMs, and managing data at scale. The intended audience of this group includes roles like machine learning engineers, data scientists, data engineers, software engineers, and PMs.This meetup was formerly Milvus Meetup, and is sponsored by Zilliz maintainers of Milvus.
STATATHON: Unleashing the Power of Statistics in a 48-Hour Knowledge Extravag...sameer shah
"Join us for STATATHON, a dynamic 2-day event dedicated to exploring statistical knowledge and its real-world applications. From theory to practice, participants engage in intensive learning sessions, workshops, and challenges, fostering a deeper understanding of statistical methodologies and their significance in various fields."
4th Modern Marketing Reckoner by MMA Global India & Group M: 60+ experts on W...Social Samosa
The Modern Marketing Reckoner (MMR) is a comprehensive resource packed with POVs from 60+ industry leaders on how AI is transforming the 4 key pillars of marketing – product, place, price and promotions.
The Building Blocks of QuestDB, a Time Series Databasejavier ramirez
Talk Delivered at Valencia Codes Meetup 2024-06.
Traditionally, databases have treated timestamps just as another data type. However, when performing real-time analytics, timestamps should be first class citizens and we need rich time semantics to get the most out of our data. We also need to deal with ever growing datasets while keeping performant, which is as fun as it sounds.
It is no wonder time-series databases are now more popular than ever before. Join me in this session to learn about the internal architecture and building blocks of QuestDB, an open source time-series database designed for speed. We will also review a history of some of the changes we have gone over the past two years to deal with late and unordered data, non-blocking writes, read-replicas, or faster batch ingestion.
Beyond the Basics of A/B Tests: Highly Innovative Experimentation Tactics You...Aggregage
This webinar will explore cutting-edge, less familiar but powerful experimentation methodologies which address well-known limitations of standard A/B Testing. Designed for data and product leaders, this session aims to inspire the embrace of innovative approaches and provide insights into the frontiers of experimentation!
1. Market Basket Analysis
using Apriori algorithm
on “Groceries” dataset
Submitted By:
MadhuKiran P C20-085
Sai Vinod P C20-131
Sesha Sai Harsha C20-142
2. Contents
Overview:................................................................................................................................................3
Apriori algorithm:....................................................................................................................................3
The data: .................................................................................................................................................4
Transformed data to dummy flag variables:...........................................................................................4
Program flow: .........................................................................................................................................5
Top 12 most frequent items: ..................................................................................................................5
Results: Top 12 rules by “support”: ........................................................................................................5
Results: Top 12 rules by “confidence”:...................................................................................................6
Results: Top 12 rules by “lift”: ................................................................................................................6
Web:........................................................................................................................................................7
Discussion: ..............................................................................................................................................7
References: .............................................................................................................................................7
3. Overview:
Identifies frequently purchased groceries from given transactional data
Implemented SPSS Modeler A-priori modelling node to calculate support, confidence and lift for
association rules
Listed top 12 frequent bought items, top 10 combinations by support, confidence and lift values.
Apriori algorithm:
Apriori algorithm employs a simple a priori belief as guideline for reducing the association rule
search space: all subsets of a frequent item-set must also be frequent
The support of an item-set or rule measures how frequently it occurs in the data
A rule's confidence is a measurement of its predictive power or accuracy. It is defined as the
support of the item-set containing both X and Y divided by the support of the item-set
containing only X
Lift is a measure of how much more likely one item is to be purchased relative to its typical
purchase rate, given that you know another item has been purchased
4. The data:
citrus fruit semi-finished
bread
margarine ready soups
tropical fruit yogurt coffee
whole milk
pip fruit yogurt cream cheese meat spreads
other vegetables whole milk condensed milk long life bakery
product
whole milk butter yogurt rice abrasive cleaner
rolls/buns
other vegetables UHT milk rolls/buns bottled beer liquor (appetizer)
potted plants
whole milk cereals
tropical fruit other vegetables white bread bottled water chocolate
citrus fruit tropical fruit whole milk butter curd
beef
frankfurter rolls/buns soda
The dataset has been created by researchers Department of Information Systems and
Operations, Wirtschaftsuniversitat Wien, Austria
The “Groceries” data set contains 1 month (30 days) of real-world point-of-sale transaction data
from a typical local grocery outlet. The data set contains 9835 transactions and the items are
aggregated to 169 categories
Item categories have been used instead of brands, for simplicity. So “milk” can refer to any
brand of milk.
Transformed data to dummy flag variables:
citrus
fruit
tropical
fruit
whole
milk
pip fruit other
vegetables
rolls/buns potted
plants
beef
1 1 0 0 0 0 0 0 0
2 0 1 0 0 0 0 0 0
3 0 0 1 0 0 0 0 0
4 0 0 0 1 0 0 0 0
5 0 0 1 0 1 0 0 0
6 0 0 1 0 0 0 0 0
7 0 0 0 0 0 1 0 0
8 0 0 0 0 1 1 0 0
9 0 0 0 0 0 0 1 0
10 0 0 1 0 0 0 0 0
11 0 1 0 0 1 0 0 0
12 1 1 1 0 0 0 0 0
13 0 0 0 0 0 0 0 1
5. Program flow:
Converted dataset to dummy flag variables
Load the dataset into SPSS environment
Using data audit node, the matrix has 169 columns (corresponding to 169 item categories) and
9835 rows (corresponding to 9835 transactions)
Apply A-priori modelling node with 5% support and 30% confidence and lift parameters to
generate association rules
Top 12 most frequent items:
Results: Top 12 rules by “support”:
Consequent Antecedent Support % Confidence % Lift
other
vegetables
whole milk 25.310 30.300 1.568
whole milk other vegetables 19.318 39.698 1.568
whole milk rolls/buns 18.443 31.542 1.246
other
vegetables
yogurt 14.011 32.570 1.686
whole milk yogurt 14.011 39.646 1.566
whole milk bottled water 11.270 30.789 1.216
other
vegetables
root vegetables 10.832 44.280 2.292
whole milk root vegetables 10.832 45.087 1.781
2513
1903 1809 1715
1372
1087 1072 1032 969 924 875 814
0
500
1000
1500
2000
2500
3000
Top 12 most frequent items
6. other
vegetables
tropical fruit 10.395 33.801 1.750
whole milk tropical fruit 10.395 39.130 1.546
Results: Top 12 rules by “confidence”:
Consequent Antecedent Support % Confidence % Lift
whole milk butter 5.701 49.616 1.960
whole milk curd 5.642 48.320 1.909
whole milk domestic eggs 6.459 47.856 1.891
whole milk root vegetables 10.832 45.087 1.781
other
vegetables
root vegetables 10.832 44.280 2.292
whole milk whipped/sour cream 7.333 43.936 1.736
other
vegetables
yogurt and whole milk 5.555 43.045 2.228
whole milk beef 5.351 40.872 1.615
whole milk margarine 6.211 40.845 1.614
other
vegetables
whipped/sour cream 7.333 40.755 2.110
Results: Top 12 rules by “lift”:
Consequent Antecedent Support % Confidence % Lift
root vegetables beef 5.351 33.243 3.069
root vegetables other vegetables and whole milk 7.669 31.749 2.931
yogurt curd 5.642 34.884 2.490
other
vegetables
root vegetables 10.832 44.280 2.292
other
vegetables
yogurt and whole milk 5.555 43.045 2.228
yogurt other vegetables and whole milk 7.669 31.179 2.225
other
vegetables
whipped/sour cream 7.333 40.755 2.110
other
vegetables
pork 5.846 38.155 1.975
other
vegetables
beef 5.351 38.147 1.975
whole milk butter 5.701 49.616 1.960
7. Web:
➔ We can observe that those who buys pastry, citrus fruit & sausage are a group of customers
stand out
➔ It does mean that (here, for example), a customer is more likely to buy any of these three
products if he/she buys one pf those three
Discussion:
We can see that the top rules when sorted by “support” and “confidence” are dominated by
“whole milk” and “other vegetables”, which are the two most frequently bought items overall
However, when “lift” is considered we get rules not involving “whole milk” and “other
vegetables”. A lift value of greater than 1 implies that LHS and RHS sets are found more often
than purely by chance
Although such market basket analysis may yield many rules, not all of them would be useful.
Some would be trivial, some inexplicable and only a very few of them would be useful. Further
analysis and extra domain knowledge and common-sense are often required to subjectively
judge the real-world usefulness of the rules
References:
Dataset download link (via “arules” package) http://cran.r-
project.org/web/packages/arules/index.html
"Fast algorithms for mining association rule", in Proceedings of the 20th International
Conference on Very Large Databases, pp. 487-499, by R. Agrawal, and R.Srikant, (1994).
“Implications of probabilistic data modelling for mining association rules” , in Studies in
Classification, Data Analysis, and Knowledge Organization: from Data and Information Analysis
to Knowledge Engineering, pp. 598–605, by M. Hahsler, K. Hornik, and T. Reutterer, (2006).
“Machine Learning with R”, Brett Lantz, Packt Publishing