Download to read offline

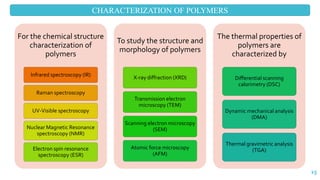
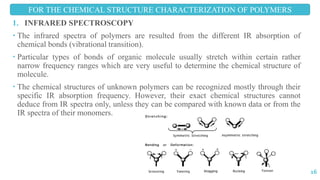


The document discusses the role of polymers in drug delivery systems, detailing their ability to enhance drug efficacy and control release rates. It classifies polymers based on various criteria such as origin, structure, and interaction with water, while also highlighting their applications in different dosage forms. Additionally, it covers advanced characterization techniques for polymers, including spectroscopy and microscopy methods, to assess their structural and thermal properties.


