Download to read offline

![References
Bosch, S. & Henderson, K. (2017). New world, same model. Library Journal, 142(7),
40-45.
Brigham, T. J. (2016). Feast for the eyes: An introduction to data visualization.
Medical Reference Services Quarterly, 35(2), 215-223. doi:
10.1080/02763869.2016.1152146
Brown, A. (2012). Assertive negotiation for librarians [PowerPoint slides]. Retrieved
from http://molib.org/2014archive/conference/2012/presentations/
assertivenegotiation.pdf](https://image.slidesharecdn.com/sprattdatavi-170610032106/85/Datavi-Negotiate-Resource-Pricing-Using-Data-Visualization-36-320.jpg)

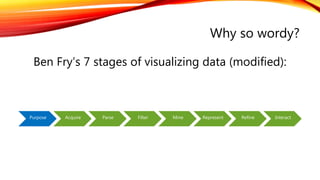
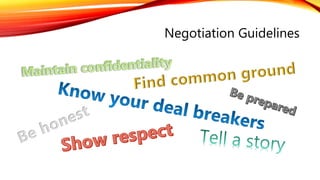
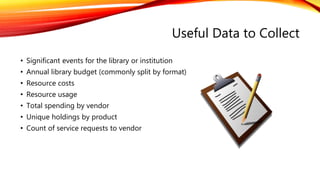
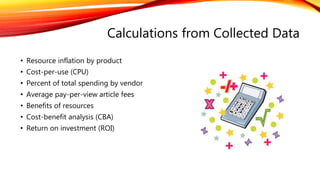
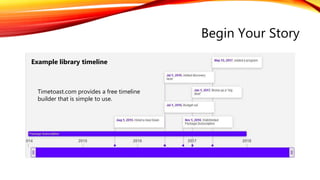
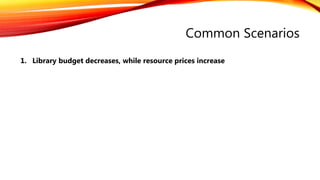
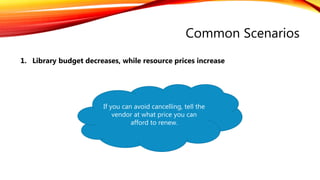
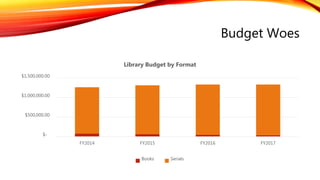
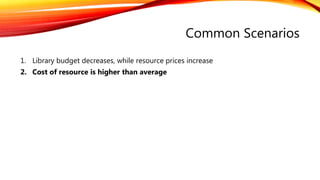
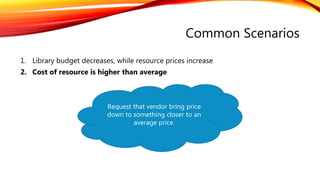
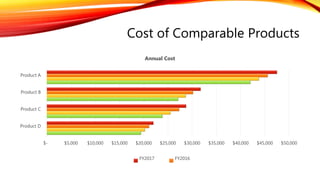
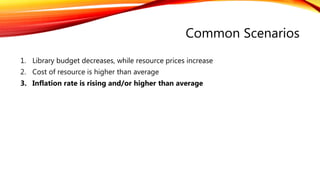
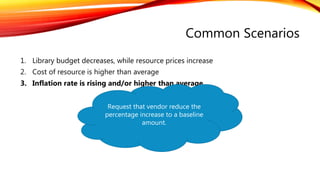
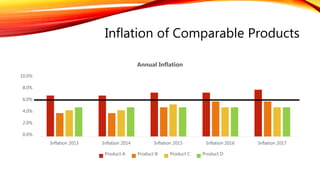
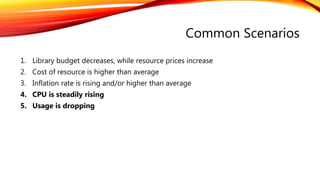
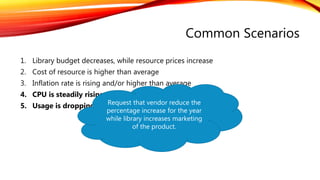
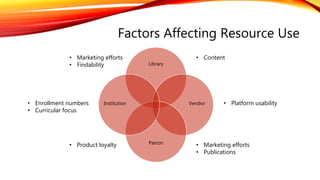
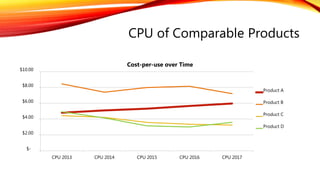
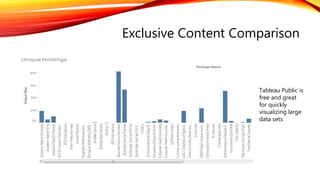
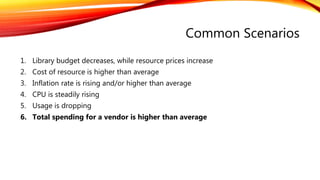
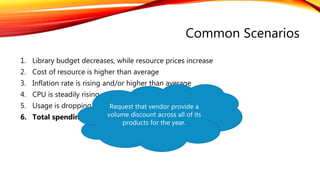
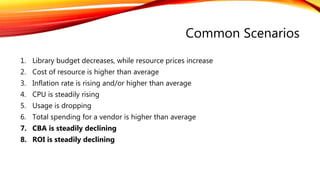
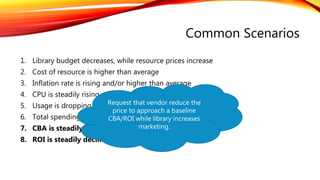
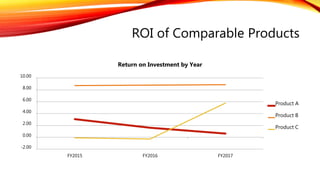
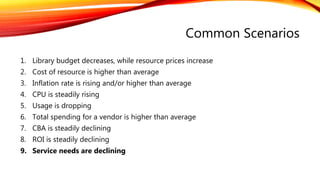
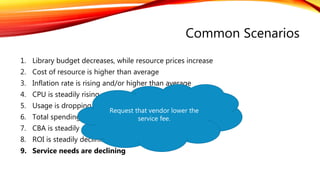
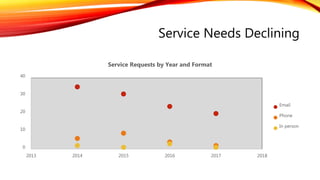
The document discusses strategies for negotiating library resource pricing, emphasizing the use of data visualization techniques to support negotiation processes. It outlines key data points to gather, potential findings from analysis, and several common scenarios that may arise during negotiations. Additionally, it provides examples of tools and methods for effective data representation and various negotiation strategies to achieve favorable outcomes.


![Purchasingb2bNegotiationApril2010[1]](https://cdn.slidesharecdn.com/ss_thumbnails/66624f00-d9e8-4350-b9f7-5e1a71f23c65-150213101909-conversion-gate01-thumbnail.jpg?width=640&height=640&fit=bounds)


![negotiating issues_Negotiating licenses [compatibility mode]](https://cdn.slidesharecdn.com/ss_thumbnails/negotiatinglicensescompatibilitymode-100419071252-phpapp01-thumbnail.jpg?width=640&height=640&fit=bounds)


