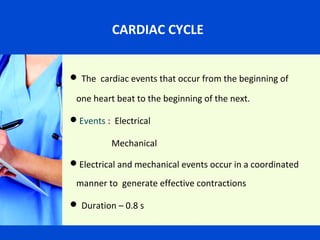
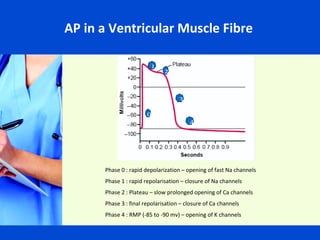
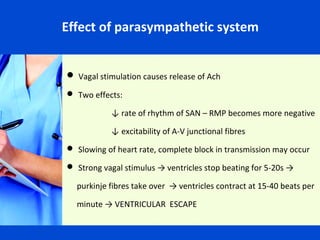
Dr. Aparajita Kumar
CARDIAC CYCLE
 The cardiac events that occur from the beginning of

one heart beat to the beginning of the next.
Events : Electrical

Mechanical
Electrical and mechanical events occur in a coordinated

manner to generate effective contractions
 Duration – 0.8 s
ELECTRICAL EVENTS
 The rhythmical activity of the heart is controlled by electrical

impulses
 A specialised conduction system generates and propagates

impulses
 Cardiac muscle as a functional syncytium enables rapid and

uniform passage of the impulses
Ensures : all parts of the ventricle contract simultaneously.
atrial contraction → 1/6th sec before ventricular
contraction
CONDUCTION SYSTEM
SINOATRIAL NODE


Junction of SVC with right atrium

 Specialized neurocardiac tissue ; almost no contractile muscle

filament
 Normal pacemaker
 Connects directly with the surrounding atrial muscle fibres so

that action potential generated spreads immediately into the
atrium.
 Properties of Self- excitation and Rythmicity
What causes the Self Excitation?
• Membrane in natural state permeable to Na and Ca ions
• RMP in SA nodal fibre is less negative : -60 to -70 mv
• This voltage closes fast Na channels but slow Na - Ca channels are open
• The ions flow inward → membrane permeability further increased → Threshold
reached → Action potential
Causes of Self Excitation
 Half way through the action potential, slow Na-Ca channels begin to

close. K channels open for a prolonged period
 Inside of the membrane becomes more negative =

HYPERPOLARIZATION
 This persists for 0.5s after the Action potential ends
 The K conductance weans off → RMP reached → Na –Ca opening

overbalances K closure → threshold for Action potential→ Action
potential
SINO ATRIAL NODE

Self–excitation & AP
Resting Memb Potential

Recovery of AP
Hyperpolarisation
Conduction through the other parts
From SAN impulses through the 3 bands (1m/s) and atria

(0.3m/s)
 Delay in the AVN – of 0.09 s. Due to reduced gap junction

number. Allows time for the ventricles to fill completely
before they contract
Rapid transmission through Purkinje fibres (4m/s) due to

many gap junctions
Transmission in ventricular muscle- 0.3 – 0.5m/s
AP in a Ventricular Muscle Fibre
1

2
3

0

4

Phase 0 : rapid depolarization – opening of fast Na channels
Phase 1 : rapid repolarisation – closure of Na channels
Phase 2 : Plateau – slow prolonged opening of Ca channels
Phase 3 : final repolarisation – closure of Ca channels
Phase 4 : RMP (-85 to -90 mv) – opening of K channels
REFRACTORY PERIOD

• Refractory to re-stimulation during Action potential

•Absolute refractory period = 0.25 – 0.3 s. Phase 0 to 2 and half of ph
3
• Relative refractory period = phase 4
• Refractory period of the atria is shorter than that of ventricle
Variation in length of action potential and associated phenomena
with cardiac rate.1
 
Heart Rate
Heart Rate
75/min
200/min
   Duration, each cardiac  
0.80
0.30
      cycle
   Duration of systole
0.27
0.16
   Duration of action 
0.25
0.15
      potential
   Duration of absolute  
0.20
0.13
      refractory period
   Duration of relative               
0.05
0.02
                       
      refractory period
   Duration of diastole
0.53
0.14
1
 All values are in seconds. 
Effect of autonomic nervous system on
conduction
Effect of parasympathetic system

 Vagal stimulation causes release of Ach
 Two effects:

↓ rate of rhythm of SAN – RMP becomes more negative
↓ excitability of A-V junctional fibres
 Slowing of heart rate, complete block in transmission may occur
 Strong vagal stimulus → ventricles stop beating for 5-20s →

purkinje fibres take over → ventricles contract at 15-40 beats per
minute → VENTRICULAR ESCAPE
Effect of sympathetic system

 Sympathetic stimulation → Noradrenaline released
 Three effects :

↑ rate of SAN discharge – RMP more positive
↑ rate of conduction and overall excitability
↑ the force of contraction – increases Ca
permeability
 Heart rate may increase 3 times and strength of contraction may

increase 2 times the normal
EXCITATION-CONTRACTION COUPLING
How AP causes myofibrils to contract
MECHANICAL EVENTS

The heart contracts and relaxes alternately during every
heart beat and this occurs in concordance with the
electrical events. The mechanical events can be studied
in various phases,which are explained henceforth.
ATRIAL SYSTOLE
Initiated by p wave of ECG :Atrial

Depolarisation

Atrial contraction causes increased
pressure in atrial chambers,forcing
more blood through the open AV valves

Ventricular filling : 80% - direct flow from SVC
20% - atrial contraction.
ATRIAL SYSTOLE
At high heart rates,however,atrial contraction may account
for 40% of ventricular filling : Atrial kick
Atrial contribution to ventricular filling directly proportional
to atrial contrctility,and inversely proportional to duration
ATRIAL SYSTOLE
of ventricular diastole.
After atrial contraction is completed,atrial pressure starts
falling: Pressure Gradient Reversal across AV Valves
EDV,120ml,represents ventricular preload;associated with
End Diastolic Pressure 8-12mm Hg in LV & 3-6mm in RV.
….. Atrial systole

JVP – ‘a’ wave
 ECG – P wave preceeds the atrial systole. PR segment – depolarization
proceeds to the AVN. The brief pause allows complete ventricular filling
 Heart sounds - S 4 – pathological. Vibration of the ventricular wall
during atrial contraction. Heard in ‘stiff’ ventricle like in hypertrophy and
in elderly. Also heard in massive pulmonary embolism, cor pulmonale, TR
ISOVOLUMETRIC CONTRACTION

Increase in ventricular pressure > atrial pressure → AV
valves close
Begins with the appearance of QRS Complex:
Ventricular Depolarisation
Period between AV valve closure and semilunar valve
opening → contraction occurs without emptying
Tension develops without change in muscle length
AV Valves close as IV pressure exceeds atrial pressure
Early in this phase,rapid increase in !V pressure: maximal dP/dT

Contraction of papillary muscles and chordae tendinae prevent AV
valve leaflets from bulging back into atria & becoming incompetent
Closure of AV Valves-First Heart Sound (S1);normally split (0.04s)
… Isovolumetric contraction

JVP – ‘c’ wave → due to the bulging of the Tricuspid valve into RA
secondary to increased pressure in the ventricle.
‘x’ descent
 ECG – Interval between QRS complex and T wave (QT interval)
Heart Sounds – S1 : closure of the AV valves. Normally split as mitral
closure preceeds tricuspid valve closure.

valve
EJECTION
• When LV pres > 80 mm Hg
RV pres > 8 mm Hg,
The semilunar valves open.
• Rapid Ejection – 70% emptying in first 1/3
• Slow Ejection – 30% in last 2/3
• The pressure in the ventricle keeps decreasing until it
becomes lower than that of the great vessels
EJECTION
Ventricular pressure exceeds outflow tract pressure by a few mm
Hg.Pressure gradient across valve usually low,due to relatively large
valve orifice ( Low resistance)
LA pressure initially decreases as atrial base is pulled downwards

Approximately 200 m sec after QRS and the beginning of ventricular
contraction, ventricular repolarization occurs as shown by the T-wav
of ECG. Repolarization leads to a decline in ventricular tension ,and t
rate of ejection falls. Ventricular pressure falls slightly below outflow tra
pressure; however, outward flow still occurs due to kinetic (or inertial)
energy of the blood.
…………. ejection

 JVP – no waves
 ECG – T wave
 Heart sounds – none
 Aortic pressure - Rapid rise in the pressure = 120 mm Hg
Even at the end of systole pressure in the aorta
is maintained at 90 mm Hg because of the
elastic recoil
ISOVOULUMETRIC RELAXATION
• When ventricle pressure < arterial pressure→ backflow
of blood → forces semilunar valves to close.
• For 0.03-0.06 s, ventricle relaxes despite no change in
its volume
• Meanwhile, atria fill up and atrial pressure gradually
rises
• Pressures in ventricle keep falling till it is < atrial
pressure
…… isovolumetric relaxation

 JVP – ‘v’ wave – due to venous return to the atria from SVC and IVC
 ECG - no deflections
Heart sounds – S2 : closure of the semilunar valves. Normally split because
aortic valve closes slightly earlier than the pulmonary valve
Aortic pressure curve – INCISURA - when the aortic valve closes. Caused by
a short period of backflow before the valve closes followed by sudden cessation
of the backflow when the valve closes.
VENTRICULAR FILLING
• Begins with the opening of AV
valves
• Rapid filling – first 1/3 of diastole
• Reduced filling (Diastasis) – middle
1/3 of diastole
• Atrial contraction – last 1/3 of
diastole
• As the atrial pressures fall, the AV
valves close and left ventricular
volume is now maximum → EDV (120
ml in LV)
……… ventricular filling

 JVP – ‘y’ descent
 ECG – no deflections
Heart sounds - S3 - Pathological in adults. Seen in dilated
congestive heart failure, MI, MR, severe hypertension. Normal in
children.
VARIOUS PRESSURE VALUES
CHAMBERS
Right Atrium
Right Ventricle

NORMAL RANGE (mm of Hg)
2–6

( systolic)

15 – 25

(diastolic)

2 -8

Pulmonary Artery (systolic)
(diastolic)
Left Atrium
Left Ventricle

15 – 25
8 - 15
6 - 12

(systolic)

100 – 140

(diastolic)

3 – 12
SUMMARY

The conduction system and the atrial and ventricular
muscle in the normal heart work in an extremely well coordinated manner to ensure correct opening and closure of
the atrio - ventricular and semilunar valves and movement
of the blood through the heart in an appropriate direction
with minimal regurgitation.
REFERENCES

1 . William F. Ganong. The heart as a Pump. Review of Medical
Physiology, Lange, 2010
2. Guyton and Hall. Heart Muscle, the heart as a Pump and
function of the heart valves. Textbook of Medical
Physiology.Philadelphia, Mosby Elsevier, 2006
3.Cardiovascular Physiology & Concepts 2nd Edition:Lippincott
Williams & Wilkins
4 Ronald D. Miller. Cardiac Physiology.Miller’s
Anaesthesia.Philadelphia, Mosby Elsevier, 2010
Cardiac cyclen

Cardiac cyclen

  • 1.
  • 2.
    CARDIAC CYCLE  Thecardiac events that occur from the beginning of one heart beat to the beginning of the next. Events : Electrical Mechanical Electrical and mechanical events occur in a coordinated manner to generate effective contractions  Duration – 0.8 s
  • 3.
    ELECTRICAL EVENTS  Therhythmical activity of the heart is controlled by electrical impulses  A specialised conduction system generates and propagates impulses  Cardiac muscle as a functional syncytium enables rapid and uniform passage of the impulses Ensures : all parts of the ventricle contract simultaneously. atrial contraction → 1/6th sec before ventricular contraction
  • 4.
  • 5.
    SINOATRIAL NODE  Junction ofSVC with right atrium  Specialized neurocardiac tissue ; almost no contractile muscle filament  Normal pacemaker  Connects directly with the surrounding atrial muscle fibres so that action potential generated spreads immediately into the atrium.  Properties of Self- excitation and Rythmicity
  • 6.
    What causes theSelf Excitation? • Membrane in natural state permeable to Na and Ca ions • RMP in SA nodal fibre is less negative : -60 to -70 mv • This voltage closes fast Na channels but slow Na - Ca channels are open • The ions flow inward → membrane permeability further increased → Threshold reached → Action potential
  • 7.
    Causes of SelfExcitation  Half way through the action potential, slow Na-Ca channels begin to close. K channels open for a prolonged period  Inside of the membrane becomes more negative = HYPERPOLARIZATION  This persists for 0.5s after the Action potential ends  The K conductance weans off → RMP reached → Na –Ca opening overbalances K closure → threshold for Action potential→ Action potential
  • 8.
    SINO ATRIAL NODE Self–excitation& AP Resting Memb Potential Recovery of AP Hyperpolarisation
  • 9.
    Conduction through theother parts From SAN impulses through the 3 bands (1m/s) and atria (0.3m/s)  Delay in the AVN – of 0.09 s. Due to reduced gap junction number. Allows time for the ventricles to fill completely before they contract Rapid transmission through Purkinje fibres (4m/s) due to many gap junctions Transmission in ventricular muscle- 0.3 – 0.5m/s
  • 10.
    AP in aVentricular Muscle Fibre 1 2 3 0 4 Phase 0 : rapid depolarization – opening of fast Na channels Phase 1 : rapid repolarisation – closure of Na channels Phase 2 : Plateau – slow prolonged opening of Ca channels Phase 3 : final repolarisation – closure of Ca channels Phase 4 : RMP (-85 to -90 mv) – opening of K channels
  • 11.
    REFRACTORY PERIOD • Refractoryto re-stimulation during Action potential •Absolute refractory period = 0.25 – 0.3 s. Phase 0 to 2 and half of ph 3 • Relative refractory period = phase 4 • Refractory period of the atria is shorter than that of ventricle
  • 12.
    Variation in lengthof action potential and associated phenomena with cardiac rate.1   Heart Rate Heart Rate 75/min 200/min    Duration, each cardiac   0.80 0.30       cycle    Duration of systole 0.27 0.16    Duration of action  0.25 0.15       potential    Duration of absolute   0.20 0.13       refractory period    Duration of relative                0.05 0.02                               refractory period    Duration of diastole 0.53 0.14 1  All values are in seconds. 
  • 13.
    Effect of autonomicnervous system on conduction
  • 14.
    Effect of parasympatheticsystem  Vagal stimulation causes release of Ach  Two effects: ↓ rate of rhythm of SAN – RMP becomes more negative ↓ excitability of A-V junctional fibres  Slowing of heart rate, complete block in transmission may occur  Strong vagal stimulus → ventricles stop beating for 5-20s → purkinje fibres take over → ventricles contract at 15-40 beats per minute → VENTRICULAR ESCAPE
  • 15.
    Effect of sympatheticsystem  Sympathetic stimulation → Noradrenaline released  Three effects : ↑ rate of SAN discharge – RMP more positive ↑ rate of conduction and overall excitability ↑ the force of contraction – increases Ca permeability  Heart rate may increase 3 times and strength of contraction may increase 2 times the normal
  • 16.
    EXCITATION-CONTRACTION COUPLING How APcauses myofibrils to contract
  • 17.
    MECHANICAL EVENTS The heartcontracts and relaxes alternately during every heart beat and this occurs in concordance with the electrical events. The mechanical events can be studied in various phases,which are explained henceforth.
  • 20.
    ATRIAL SYSTOLE Initiated byp wave of ECG :Atrial Depolarisation Atrial contraction causes increased pressure in atrial chambers,forcing more blood through the open AV valves Ventricular filling : 80% - direct flow from SVC 20% - atrial contraction.
  • 21.
    ATRIAL SYSTOLE At highheart rates,however,atrial contraction may account for 40% of ventricular filling : Atrial kick Atrial contribution to ventricular filling directly proportional to atrial contrctility,and inversely proportional to duration ATRIAL SYSTOLE of ventricular diastole. After atrial contraction is completed,atrial pressure starts falling: Pressure Gradient Reversal across AV Valves EDV,120ml,represents ventricular preload;associated with End Diastolic Pressure 8-12mm Hg in LV & 3-6mm in RV.
  • 23.
    ….. Atrial systole JVP– ‘a’ wave  ECG – P wave preceeds the atrial systole. PR segment – depolarization proceeds to the AVN. The brief pause allows complete ventricular filling  Heart sounds - S 4 – pathological. Vibration of the ventricular wall during atrial contraction. Heard in ‘stiff’ ventricle like in hypertrophy and in elderly. Also heard in massive pulmonary embolism, cor pulmonale, TR
  • 24.
    ISOVOLUMETRIC CONTRACTION Increase inventricular pressure > atrial pressure → AV valves close Begins with the appearance of QRS Complex: Ventricular Depolarisation Period between AV valve closure and semilunar valve opening → contraction occurs without emptying Tension develops without change in muscle length
  • 25.
    AV Valves closeas IV pressure exceeds atrial pressure Early in this phase,rapid increase in !V pressure: maximal dP/dT Contraction of papillary muscles and chordae tendinae prevent AV valve leaflets from bulging back into atria & becoming incompetent Closure of AV Valves-First Heart Sound (S1);normally split (0.04s)
  • 26.
    … Isovolumetric contraction JVP– ‘c’ wave → due to the bulging of the Tricuspid valve into RA secondary to increased pressure in the ventricle. ‘x’ descent  ECG – Interval between QRS complex and T wave (QT interval) Heart Sounds – S1 : closure of the AV valves. Normally split as mitral closure preceeds tricuspid valve closure. valve
  • 27.
    EJECTION • When LVpres > 80 mm Hg RV pres > 8 mm Hg, The semilunar valves open. • Rapid Ejection – 70% emptying in first 1/3 • Slow Ejection – 30% in last 2/3 • The pressure in the ventricle keeps decreasing until it becomes lower than that of the great vessels
  • 28.
    EJECTION Ventricular pressure exceedsoutflow tract pressure by a few mm Hg.Pressure gradient across valve usually low,due to relatively large valve orifice ( Low resistance) LA pressure initially decreases as atrial base is pulled downwards Approximately 200 m sec after QRS and the beginning of ventricular contraction, ventricular repolarization occurs as shown by the T-wav of ECG. Repolarization leads to a decline in ventricular tension ,and t rate of ejection falls. Ventricular pressure falls slightly below outflow tra pressure; however, outward flow still occurs due to kinetic (or inertial) energy of the blood.
  • 29.
    …………. ejection  JVP– no waves  ECG – T wave  Heart sounds – none  Aortic pressure - Rapid rise in the pressure = 120 mm Hg Even at the end of systole pressure in the aorta is maintained at 90 mm Hg because of the elastic recoil
  • 30.
    ISOVOULUMETRIC RELAXATION • Whenventricle pressure < arterial pressure→ backflow of blood → forces semilunar valves to close. • For 0.03-0.06 s, ventricle relaxes despite no change in its volume • Meanwhile, atria fill up and atrial pressure gradually rises • Pressures in ventricle keep falling till it is < atrial pressure
  • 32.
    …… isovolumetric relaxation JVP – ‘v’ wave – due to venous return to the atria from SVC and IVC  ECG - no deflections Heart sounds – S2 : closure of the semilunar valves. Normally split because aortic valve closes slightly earlier than the pulmonary valve Aortic pressure curve – INCISURA - when the aortic valve closes. Caused by a short period of backflow before the valve closes followed by sudden cessation of the backflow when the valve closes.
  • 33.
    VENTRICULAR FILLING • Beginswith the opening of AV valves • Rapid filling – first 1/3 of diastole • Reduced filling (Diastasis) – middle 1/3 of diastole • Atrial contraction – last 1/3 of diastole • As the atrial pressures fall, the AV valves close and left ventricular volume is now maximum → EDV (120 ml in LV)
  • 35.
    ……… ventricular filling JVP – ‘y’ descent  ECG – no deflections Heart sounds - S3 - Pathological in adults. Seen in dilated congestive heart failure, MI, MR, severe hypertension. Normal in children.
  • 36.
    VARIOUS PRESSURE VALUES CHAMBERS RightAtrium Right Ventricle NORMAL RANGE (mm of Hg) 2–6 ( systolic) 15 – 25 (diastolic) 2 -8 Pulmonary Artery (systolic) (diastolic) Left Atrium Left Ventricle 15 – 25 8 - 15 6 - 12 (systolic) 100 – 140 (diastolic) 3 – 12
  • 37.
    SUMMARY The conduction systemand the atrial and ventricular muscle in the normal heart work in an extremely well coordinated manner to ensure correct opening and closure of the atrio - ventricular and semilunar valves and movement of the blood through the heart in an appropriate direction with minimal regurgitation.
  • 38.
    REFERENCES 1 . WilliamF. Ganong. The heart as a Pump. Review of Medical Physiology, Lange, 2010 2. Guyton and Hall. Heart Muscle, the heart as a Pump and function of the heart valves. Textbook of Medical Physiology.Philadelphia, Mosby Elsevier, 2006 3.Cardiovascular Physiology & Concepts 2nd Edition:Lippincott Williams & Wilkins 4 Ronald D. Miller. Cardiac Physiology.Miller’s Anaesthesia.Philadelphia, Mosby Elsevier, 2010