
Recommended
Recommended
More Related Content
Similar to Carbon Footprint Analysis EARTH5R PROJECTS .pdf
Similar to Carbon Footprint Analysis EARTH5R PROJECTS .pdf (20)
More from Alison Tutors
More from Alison Tutors (20)
Recently uploaded
Recently uploaded (20)
Carbon Footprint Analysis EARTH5R PROJECTS .pdf
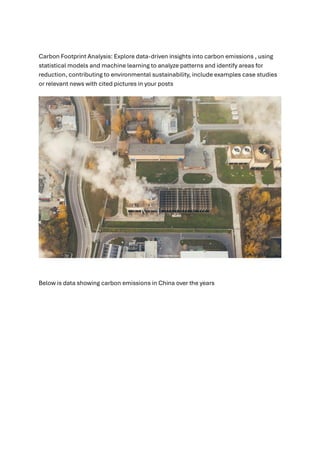
- 1. Carbon Footprint Analysis: Explore data-driven insights into carbon emissions , using statistical models and machine learning to analyze patterns and identify areas for reduction, contributing to environmental sustainability, include examples case studies or relevant news with cited pictures in your posts Below is data showing carbon emissions in China over the years
- 2. Various statistical tools can be used for analyzing data patterns from the past and forecasting future patterns , however in my case I didn’t have dependent and independent variables hence I decided to stick to the use of graphs to analyze trends in the past . Below is a scatter plot showing carbon emissions in China from 1990 to 2020
- 3. Over the years, there has been a steep increase in carbon emissions in China. China’s greenhouse gas emissions are the largest of any country in the world both in production and consumption terms, and this stems mainly from coal burning , including coal power, coal mining and blast furnaces producing iron and steel. When measuring production-based emissions , China emitted over 14 gigatonnes of greenhouse gases in 2019. These high levels of emissions are due to China’s large population. China can reduce carbon emissions by switching to renewable energy sources such as wind and solar power in place of coal. China has pledged to reduce its emissions by 60% to 65% as part of the Paris Agreement .