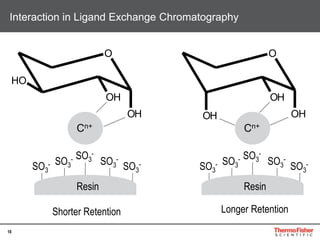
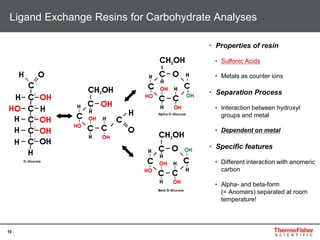
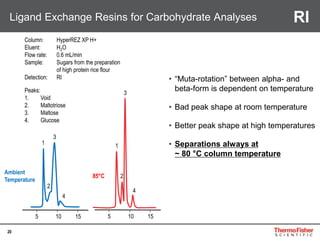
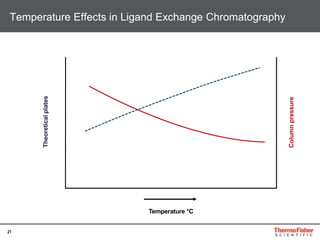
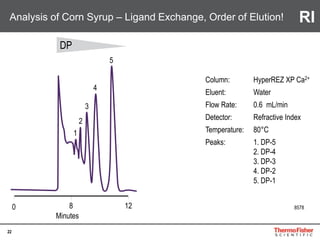
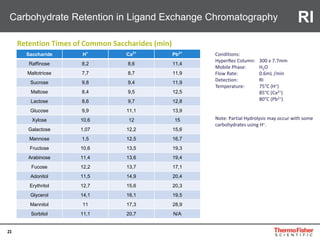
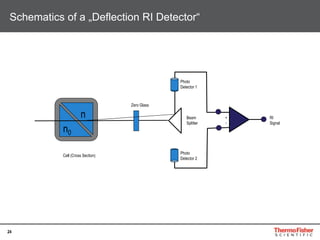
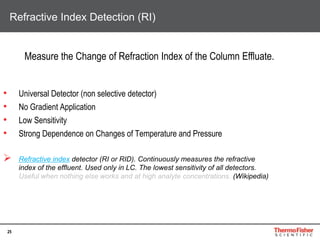
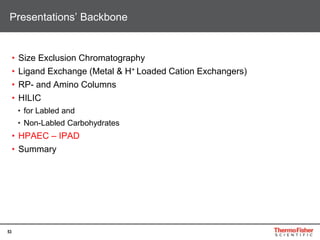
The world leader in serving science
Jan Pettersson
Nordic HPLC & Chromeleon Support
(The presentation is mainly done by Detlef Jensen)
Carbohydrate-Analysis – LC Approach, Separation and Detection
2
NP IC
Hydrophobic
ChargedHydrophilic
HILIC
HPLC
Adapted from: H. Hayen, Nachrichten aus der Chemie, 58, April 2010
Positioning Modern LC-Techniques
3
But… HOW?
Hydrophobic
ChargedHydrophilic
4
What detector to use?
5
• Extremely polar, partly ionic
• Many similar and complex structures
• Non-chromophoric
• Often present in complex matrices
• Often bonded to other molecules
(Glycoproteins, glycolipids)
Issues with Carbohydrate Analysis in LC
6
• Size Exclusion Chromatography
• Ligand Exchange (Metal & H+ Loaded Cation Exchangers)
• RP- and Amino Columns
• HILIC
• for Labled and
• Non-Labled Carbohydrates
• HPAEC – IPAD
• Summary
Presentations’ Backbone
7
• Size Exclusion Chromatography
• Ligand Exchange (Metal & H+ Loaded Cation Exchangers)
• RP- and Amino Columns
• HILIC
• for Labled and
• Non-Labled Carbohydrates
• HPAEC – IPAD
• Summary
Presentations’ Backbone
8
• Size Exclusion Chromatography
• Ligand Exchange (Metal & H+ Loaded Cation Exchangers)
• RP- and Amino Columns
• HILIC
• for Labled and
• Non-Labled Carbohydrates
• HPAEC – IPAD
• Summary
Presentations’ Backbone
9
• Separates molecules according to size (into bands)
(small molecules elute late, large molecules elute early, very large molecule come in void)
• Good separation of small oligo- and poly-saccharides consisting of simple, repeating units
• Difficult to separate larger oligo- and poly-saccharides
• Oligomers of same size co-elute
• Runs are slow
• Samples require de-salting
• Most packing material are not rigid
so cannot be run at high flow rate
Size-exclusion chromatography (SEC / GPC / GFC)
10
Size Exclusion Chromatography
Stationary Phase
Flow
11
2.00 3.00 4.00
Elution Volume (mL)
100000000
10000000
100000
10000
1000
100
10
1000000
SEC-300
SEC-1000
MolecularWeight(Da)
Calibration Curves in SEC
Elution Order: from High to Low Molecular Weight
12
Distribution of oligo sacarides
13
Distribution of oligo sacarides
14
Dextrans on Acclaim SEC-1000 column
0 5 10 15
0
50
µRIU
4
3
2
1
Column: Acclaim SEC-1000
4.6 x 300 mm
Eluent: 10 mM sodium perchlorate
Flow: 0.35 mL/min
Backpressure: 590 psi (4.07 Mpa)
Temperature: 30°C
Injection vol.: 5 L
Detection Refractive Index
Sample 5 mg/mL in mobile phase
1. Dextran, MW 580,000
2. Dextran, MW 200,000–300,000
3. Dextran, MW 35,000–50,000
4. Dextran, MW 10,000
RI
15
0 5 10 min 20
RIU
DP800
DP200
DP100
DP50
DP20
DP10
DP5
DP400
Size-Exclusion Chromatography of Pullulan Fractions
Column: Acclaim ™ SEC-300
Injection vol.: 50 µL
Eluent: 10 mmol/L Acetate buffer
Flow Rate: 1.0 mL/min
Backpressure: 600-900 psi
(4,1 – 6,2 MPa)
Postcolumn
Reagent: 300 mmol/L NaOH
Detection: Pulsed Amperomerty (Au)
Source: Von Klever - Eigenes Werk, Gemeinfrei, https://commons.wikimedia.org/w/index.php?curid=3825738
Maltotriose
IPAD
16
• Size Exclusion Chromatography
• Ligand Exchange (Metal & H+ Loaded Cation Exchangers)
• RP- and Amino Columns
• HILIC
• for Labled and
• Non-Labled Carbohydrates
• HPAEC – IPAD
• Summary
Presentations’ Backbone
17
• Size Exclusion Chromatography
• Ligand Exchange (Metal & H+ Loaded Cation Exchangers)
• RP- and Amino Columns
• HILIC
• for Labled and
• Non-Labled Carbohydrates
• HPAEC – IPAD
• Summary
Presentations’ Backbone
18
Interaction in Ligand Exchange Chromatography
O
OH
OH
OH
Cn+
SO3
-
SO3
-SO3
-
SO3
-SO3
-
O
OH
OH
OH
Cn+
SO3
-
SO3
-SO3
-
SO3
-SO3
-
Resin Resin
Shorter Retention Longer Retention
19
Ligand Exchange Resins for Carbohydrate Analyses
• Properties of resin
• Sulfonic Acids
• Metals as counter ions
• Separation Process
• Interaction between hydroxyl
groups and metal
• Dependent on metal
• Specific features
• Different interaction with anomeric
carbon
• Alpha- and beta-form
(= Anomers) separated at room
temperature!
20
Ligand Exchange Resins for Carbohydrate Analyses
• “Muta-rotation” between alpha- and
beta-form is dependent on temperature
• Bad peak shape at room temperature
• Better peak shape at high temperatures
• Separations always at
~ 80 °C column temperature
Peaks:
1. Void
2. Maltotriose
3. Maltose
4. Glucose
Column: HyperREZ XP H+
Eluent: H2O
Flow rate: 0.6 mL/min
Sample: Sugars from the preparation
of high protein rice flour
Detection: RI
105 15
1
3
3
1
2
2
4
4
Ambient
Temperature
85°C
105 15
RI
21
Temperature Effects in Ligand Exchange Chromatography
Temperature °C
Columnpressure
Theoreticalplates
22
Column: HyperREZ XP Ca2+
Eluent: Water
Flow Rate: 0.6 mL/min
Detector: Refractive Index
Temperature: 80°C
Peaks: 1. DP-5
2. DP-4
3. DP-3
4. DP-2
5. DP-1
8578
5
4
3
2
1
0 8 12
Minutes
Analysis of Corn Syrup – Ligand Exchange, Order of Elution!
DP
RI
23
Carbohydrate Retention in Ligand Exchange Chromatography
Saccharide H+
Ca2+
Pb2+
Raffinose 8,2 8,6 11,4
Maltotriose 7,7 8,7 11,9
Sucrose 9,8 9,4 11,9
Maltose 8,4 9,5 12,5
Lactose 8,6 9,7 12,8
Glucose 9,9 11,1 13,9
Xylose 10,6 12 15
Galactose 1,07 12,2 15,6
Mannose 1,5 12,5 16,7
Fructose 10,6 13,5 19,3
Arabinose 11,4 13,6 19,4
Fucose 12,2 13,7 17,1
Adonitol 11,5 14,9 20,4
Erythritol 12,7 15,6 20,3
Glycerol 14,1 16,1 19,5
Mannitol 11 17,3 28,9
Sorbitol 11,1 20,7 N/A
Conditions:
HyperRez Column: 300 x 7.7mm
Mobile Phase: H2O
Flow Rate: 0.6mL /min
Detection: RI
Temperature: 75°C (H+)
85°C (Ca2+)
80°C (Pb2+)
Note: Partial Hydrolysis may occur with some
carbohydrates using H+.
Retention Times of Common Saccharides (min)
RI
24
Schematics of a „Deflection RI Detector“
n
n0
Cell (Cross Section)
Zero Glass
Beam
Splitter
+
-
RI
Signal
Photo
Detector 1
Photo
Detector 2
25
Refractive Index Detection (RI)
• Universal Detector (non selective detector)
• No Gradient Application
• Low Sensitivity
• Strong Dependence on Changes of Temperature and Pressure
 Refractive index detector (RI or RID). Continuously measures the refractive
index of the effluent. Used only in LC. The lowest sensitivity of all detectors.
Useful when nothing else works and at high analyte concentrations. (Wikipedia)
Measure the Change of Refraction Index of the Column Effluate.
26
0.0 5.0 10.0 15.0 20.0 25.0
-0.00
5.00
µRIU
min
Lactate
Formate
Acetate
Propionate
Isobutyrate
Butyrate
Column: Thermo Scientific™ Dionex™
IonPac™ ICE-AS1 (4  250 mm)
Eluent: 5 mmol/L Heptafluorobutyric acid
Flow: 0.16 mL/min
Detection: Refractive Index
Temperature: 19°C
Injection vol.: 10 µL
Sample Prep.: The samples were diluted 1 : 5 and
1 : 10 with ultrapure water.
Concentrations: 0,2-2 g/L range
0.06 % < RSD < 0,6%
Organic Acids in Aqueous Samples RI
27
• Size Exclusion Chromatography
• Ligand Exchange (Metal & H+ Loaded Cation Exchangers)
• RP- and Amino Columns
• HILIC
• for Labled and
• Non-Labled Carbohydrates
• HPAEC – IPAD
• Summary
Presentations’ Backbone
28
• Size Exclusion Chromatography
• Ligand Exchange (Metal & H+ Loaded Cation Exchangers)
• RP- and Amino Columns
• HILIC
• for Labled and
• Non-Labled Carbohydrates
• HPAEC – IPAD
• Summary
Presentations’ Backbone
29
Carbohydrates from Corn-Syrup – RP-C18 Column
Column: Hypersil GOLD-C18
Eluent: Water
Flow: 0.5 mL/min
Detection: Refractive Index
Temperature: RT
Peaks: 1. DP-1
2. DP-2
3. DP-3
4. DP-4
5. DP-5
85760 20
Minutes
1
2
3
4
5
RIU
RI
30
Carbohydrates in Cider
0.0 2.0 4.0 6.0 8.0 10.0 12.0 14.0 16.0
0
20
40
60
80
100
µRIU
min
Fructose
Glucose
Sucrose
Maltose
Column: Hypersil GOLD Amino 5μm
(4.6  250 mm)
Eluent: Acetonitrile/Water (80/20, v/v)
Flow: 1.0 mL/min
Backpressure: 62 bar
Detection: RI
Temperature: 36°C
Injection vol.: 25 L
Sample Prep.: The samples were diluted
with Acetonitrile/Water (50/50,
v/v) and filtered (0.45 μm)
RI
31
• Amino groups bound to silica surface
• “Normal phase HPLC” – AKA: HILIC!
• Acetonitrile (about 70%) in water as eluent
• Oligosaccharides can precipitate at higher ACN-contents
• Amino groups sensitive to carbonyl compounds!
• Some Carbohydrates can react with the stationary phase.
• Formation of Schiff bases and enamines can lead to the loss of the reducing
sugars at higher temperatures or lower flow rates, resulting in inaccurate
quantitation and degraded columns.
Amino Phases for Carbohydrate Analyses
R2R2
R1
R1
H2N-R3
R3
NO +
R2R2
R1
R1
H2N-R3
R3
NO + (Formation of Schiff Base)
Larger Oligo- and Polysaccharides can precipitate at higher ACN-Concentrations
32
• Size Exclusion Chromatography
• Ligand Exchange (Metal & H+ Loaded Cation Exchangers)
• RP- and Amino Columns
• HILIC
• for Labled
• Non-Labled Carbohydrates
• HPAEC – IPAD
• Summary
Presentations’ Backbone
33
• Size Exclusion Chromatography
• Ligand Exchange (Metal & H+ Loaded Cation Exchangers)
• RP- and Amino Columns
• HILIC
• for Labled
• Non-Labled Carbohydrates
• HPAEC – IPAD
• Summary
Presentations’ Backbone
34
How Does HILIC Work?
● HILIC separates compounds by passing a hydrophobic or
mostly organic mobile phase across a neutral or charged
hydrophilic stationary phase, causing solutes to elute in order
of increasing hydrophilicity – the inverse of RPC.
Also called “reverse reversed-phase” or
“aqueous normal phase” chromatography
35
● “Neutral” surface
―Diol group
―Cyano group
● “Ion-Exchange” surface
―Silanol group
―Amino group
● “Zwitterionic” surface
NH2
OH
OH
CN
O
HO
HO
HILIC Types
N+
SO3
-
CH3
CH3
Silica
Silica Silica
SilicaSilica
Sulfobetaine Structure
36
Hypothetical Retention Mechanism in HILIC
(Reverse Reversed Phase)
Mobile Phase (mostly organic)
Mobile Phase („stagnant“, mostly aqueous)
AnalyteAnalyte (Eluite)
H Y D R O P H I L I C C O A T I N G
SILICA
WaterContent
Inspired by: D. Alpert;
http://www.silicol.co.il/WEB/8888/NSF/Web/1145/Israel%20lecture%20slides%2010-4-2010.pdf
37
Organic Solvent Elutropic Strength in HILIC
Solvent Elutropic
Strength in HILIC
Solvent ChemicalFormula
Aproticsolvents
Tetrahydrofuran(THF)
C4H8O
Acetone
C3H6O
Acetonitrile(ACN)
CH3CN
Proticsolvents
Iso-propanol(IPA)
CH3−CH(−OH)−CH3
Ethanol(EtOH) CH3−CH2−OH
Methanol(MeOH) CH3−OH
Water H−O−H
CH3 CH3
O
CH3 CH3
OH
38
HILIC Columns and Selection
TN 20741
39
2-AB and 2-AA – Fluorescent Labels
2-AB (2-aminobenzamide) is one of the most
widely used fluorescent labels for
glycosylation analysis.
2-AA (2-aminobenzoic acid) is considered by
many to be a superior replacement for 2-AB
(2-aminobenzamide) in most types of complex
glycan analysis. 2-AA is reported to have a
higher fluorescence and gives higher labelling
efficiencies than 2-AB.
R2R2
R1
R1
H2N-R3
R3
NO +
R2R2
R1
R1
H2N-R3
R3
NO + (Formation of Schiff Base)
Important: Requires Reducing Sugars!!
40
HILIC – Separations of 2-AB-labled Glycanes
Column: Accucore Amide HILIC (2.6 µm, 2.1 x 150 mm)
Eluent: A: 50 mmol/LAmmonium formate (pH 4.3)
B: Acetonitrile
Gradient: 35 Minutes from 75 to 35% B
Flow rate: 0.22 mL/min
Temp.: 50°C
Detection: FLU (λexc.= 360 nm; λemm.= 425 nm)
Injection vol.: 2 µL (~ 300 fmol for GU3)
Chromatogram courtesy of K. Darsow, S.Bartel & H. Lange,
University of Erlangen-Nuremberg, Germany
Larger Oligo- and Polysaccharides can precipitate at higher ACN-Concentrations
FLU
41
Dextran Ladder
Column: Accucore 150 Amide-HILIC
Dimensions: 2.6 µm, 100 x 2.1 mm
Mobile Phases: A: Acetonitrile
B: 50mM Ammonium Formate (pH 4.5)
Gradient: Time (min) %B
0 20
40 50
45 50
45.5 20
50 20
Flow: 500 µL/min
Backpressure: 110 bar
Temperature: 60 °C
Injection: 2 µL
5 µL
Detector: FL Em: 330 nm, Em: 420 nm
Sample: 2-AB labeled Dextran Ladder
Courtesy Ludger Ltd.
2 µL
5 µL
Separation and detection of at least 21
glycans
5.0 10.0 15.0 20.0 25.0 30.0 35.0 40.0 45.0
0
100000
200000
300000
400000
500000
600000
700000
800000
900000
1
2
3
4
5
6
7
8 9 1011
min
30.00 35.00 40.00 45.00
0
50000
100000
150000
200000
250000
300000
350000
400000
10
11
12
13
14
15 16
17
18192021
min
FLU
42
• Silica Based
• HILIC
• Weak Anion Exchanger
• Separation
• Size
• Charge
• Polarity
• Selectivity
• Navite
• Labeled Glycans
GlycanPac AHX-1
43
1 2 3
4
5
6
7
8
11
12
13
14
15
16
17
18
19
20
21
22
23
24
25 26
FluorescenceCounts
9,10
Neutral
Mono-Sialylated
Di-Sialylated
Tri-Sialylated
Tetra-Sialylated
Penta-Sialylated
Minutes
40
0
7E5
20 30100
Column: GlycanPac AXH-1 (1.9 µm)
Dimension: 2.1x150 mm
Mobile phase: A: Acetonitrile (100 %)
B: water
C: Ammonium formate
(100 mM, pH =4.4)
Flow: 0.4 mL/min
Temp: 30 oC
Injection: 50 Pmoles
Detection: Fluroscence (FLD3400)
Sample: 2AB-N-glycan from Bovine Fetuin
Time
(min)
% A %B %C Flow
(mL/min)
Curve
-10 78 20 2 0.4 5
0 78 20 2 0.4 5
30 70 20 10 0.4 5
35 60 20 20 0.4 5
40 50 20 30 0.4 5
2AB-N-glycans from Bovine Fetuin
– Charge, Size and Polarity. FLU
44
• Size Exclusion Chromatography
• Ligand Exchange (Metal & H+ Loaded Cation Exchangers)
• RP- and Amino Columns
• HILIC
• for Labled and
• Non-Labled Carbohydrates
• HPAEC – IPAD
• Summary
Presentations’ Backbone
45
• Size Exclusion Chromatography
• Ligand Exchange (Metal & H+ Loaded Cation Exchangers)
• RP- and Amino Columns
• HILIC
• for Labled and
• Non-Labled Carbohydrates
• HPAEC – IPAD
• Summary
Presentations’ Backbone
46
Sugar Alcohols
Column: Thermo Scientific™
Acclaim™ HILIC 10, 3 µm
Dimensions: 4.6 x 150 mm
Mobile Phase: 90/10 v/v CH3CN/10 mM (total) NH4OAc, pH5
Temperature: 60 °C
Flow Rate: 1 mL/min
Inj. Volume: 5 µL
Detection: CAD
Peaks: (0.2 mg/mL in mobile phase)
1. Xylitol
2. Sorbitol
3. Inositol
0 4 862 10
Minutes
mV
0
300
1
2
3
CAD
49
Analysis of Simple Carbohydrates
0.0 5.0 10.0 15.0
0.0
10.0
20.0
30.0
pA
min
Fructose
Glucose
Sucrose
Lactose
Maltose
Standards 5 - 200 mg/L
Column: Shodex Asahipak NH2P-50 4E
250 × 4.6 mm, 5 µm
Mobile Phase: 78% Acetonitrile, 22% Water
Flow Rate: 1.4 mL/min
Column Temp.: 55 ºC
Post Col..Temp: 30 ºC
Injection: 5 µL
Detector: CAD
Nitrogen: 35 psi
CAD
50
Oligosaccharide Analysis
Corn Syrup
36/43 DE Corn Syrup (100µg on column). 43/43 Syrup (100µg on column).
Mobile Phase: 45:55; water:acetonitrile
Flow Rate: 1.1mL/min
Column: Shodex Asahipak NH2P-50 4E; 4.6 x 250mm; 5µm
Column Temperature: 40oC
Injection Volume: 10µL
0 2 4 6 8 10 12 14 16 18 20
0.00
0.05
0.10
0.15
0.20
0.25
Minutes
Response
0 2 4 6 8 10 12 14 16 18 20
0.00
0.05
0.10
0.15
0.20
0.25
Minutes
Response
0 2 4 6 8 10 12 14 16 18 20
0.00
0.05
0.10
0.15
0.20
0.25
0.30
0.35
Minutes
Response
0 2 4 6 8 10 12 14 16 18 20
0.00
0.05
0.10
0.15
0.20
0.25
0.30
0.35
Minutes
Response
DPDP
CAD
51
Maltodextrins on Acclaim SEC-1000 column
MALTRIN M040
MALTRIN M200
MALTRIN M150
MALTRIN M100
0 3 6 9 12 15
0
100
pA
Glucose
Column: Acclaim SEC-1000
4.6 x 300 mm
Eluent: 100 mM NH4OAc
Flow: 0.35 mL/min
Temperature: 30°C
Injection vol.: 5 L
Detection CAD
Sample 5 mg/mL in mobile phase each.
CAD
52
• Size Exclusion Chromatography
• Ligand Exchange (Metal & H+ Loaded Cation Exchangers)
• RP- and Amino Columns
• HILIC
• for Labled and
• Non-Labled Carbohydrates
• HPAEC – IPAD
• Summary
Presentations’ Backbone
53
• Size Exclusion Chromatography
• Ligand Exchange (Metal & H+ Loaded Cation Exchangers)
• RP- and Amino Columns
• HILIC
• for Labled and
• Non-Labled Carbohydrates
• HPAEC – IPAD
• Summary
Presentations’ Backbone
54
Dissociation Constants of Common Carbohydrates
(in water at 25°C)
Sugar pKa
Fructose 12.03
Mannose 12.08
Xylose 12.15
Glucose 12.28
Galactose 12.39
Dulcitol 13.43
Sorbitol 13.60
a-Methyl glucoside 13.71
pH 13
CH2OH
~OHO
H
H
O
CH2OH
~OH
O
O
O
O
J.A. Rendleman. Ionization of Carbohydrates, American Chemical Society,
Washington D.C., 1973, p. 51.
55
Pellicular Anion-Exchange Beads (Latex)
3183-02
SO–
3
SO–
3
SO–
3
SO–
3
SO–
3
SO–
3
SO–
3
~ 0.1 m-Diameter Latex Core
Ion-Exchange
Surface
R3N+
R3N+
N+
R3
N+
R3
N+
R3
R3N+
R3N+
N+
R3
N+
R3
R3N+
R3N+
N+
R3
N+
R3
R3N+
R3N+
N+
R3
N+
R3
Highly efficient chromatographic separations, due to the small, chromatographically
relevant Latex-beads
56
Quadruple Potential Waveform for Carbohydrates
Waveform A, TN21
13450-01
–2
0
0.8
0.0 0.1 0.2 0.3 0.4 0.5
Time (seconds)
Potential(Vvs.Ag/AgCl)
Electrode Cleaning
Au Oxide Reduction,
Electrode Activation
Au Oxide Formation
Integrate
Time Pot. Integ.
0.00 +0.1
0.20 +0.1 Begin
0.40 +0.1 End
0.41 –2.0
0.42 –2.0
0.43 +0.6
0.44 –0.1
0.50 –0.1
IPAD: Integrated Pulsed Amperometric Detection
57
Fast Determination of Lactose
Column: CarboPac PA20-Fast-4µm 2mm
Eluent: NaOH / NaOAc-Gradient
Temp.: 30 °C
Flow Rate: 0.2 mL/min
Inj Volume: 2.5 µL
Detection: Integrated Amperometry
quadruple-pulse waveform
Electrodes
Working: Au (Carbohydrate-Disposable)
Reference: Ag/AgCl
0 2 4 6 8 10 12 14
Time (min)
0
20
40
60
80
100
120
Lactose
Fructose
Galactose / Glucose
Response(nC)
IPAD
58
Determination of Lactose trace levels
Column: CarboPac PA20-3mm
Eluent: NaOH
Temp.: 30 °C
Flow Rate: 0.5 mL/min / 0,1 mL/min
Inj Volume: 30 µL
Detection: Integrated Amperometry
quadruple-pulse waveform
Electrodes
Working: Au (Carbohydrate-Disposable)
Reference: Ag/AgCl
IPAD
59
Determination of Lactose trace levels IPAD
From 0,05 ppm
to 25 ppm
60
Wood Sugars IPAD
Column: CarboPac PA1 -4mm
Eluent: NaOH/NaAc
Temp.: 30 °C
Flow Rate: 1 mL/min
Inj Volume: 30 µL
Detection: Integrated Amperometry
quadruple-pulse waveform
Electrodes
Working: Au (Carbohydrate-Disposable)
Reference: Ag/AgCl
62
Improved Chain-Length Resolution of Inulin Polymers
Columns: Thermo Scientific™ Dionex™
CarboPac™
PA200 (3 x 250 mm)
PA100 (4 x 250 mm)
Gradient: 120- to 320-mM NaOAc
in 100 mM NaOH
over 40 min
Flow Rate: PA200: 0.5 mL/min
PA100: 1.0 mL/min
Detection: Pulsed amperometry,
quadruple waveform,
gold electrode
180
0 10 20 30 40 50 60
–20
nC
Minutes
PA200
PA100
0
IPAD
63
Suppressor Technology Enables the Successful Coupling of IC to
Mass Spectrometry
Sample acetate-, succinate2-, citrate3-
Ion exchange
separation column
K-acetate, K2-succinate, K3-citrate
Injection valve
Eluent (KOH)
Analytes in KOH
Thermo Scientific™ DionexTM
AERS anion electrolytically
Regenerating
suppressor Acetic acid, succinic acid, citric acid
Analytes in water
To waste
K+
64
Schematics for HPAEC-PAD/MS
DP
Eluent
Pump
Auto
Sampler
SeparatorGuard Desalter
ISQ EC
Electrochemical
Detector
Data system
Signals
0.31 nC
Flow 0.50
Splitter
cell
0.5 mM LiCl
Pump
Flow 0.0 5
65
Detection of DP3 in Inuline
65
–10
100
250
nC
0 10 20 30 40 50
–25 000
200 000
400 000
counts
Minutes
510.50–511.50 m/z
GF2 F3
673 GF3
835 GF4
0
50
120
150 200 250 300 350 400 450 500 550 600
DP3a AV: 8.18-8.53 min (11) SB: 5.91-6.74 (25) NL: 2.64E5 T: {0,0} + c ESI corona sid=100.00 det=1129.00 Full ms ...
511
331
349
169
205 253
%
[Hex3+Li]+
[Hex2 + Li]+
[Hex2 – H2O + Li]+
[Hex1 – H2O + Li]+
187
[Hex1 + Li]+
[Hex1 + H2O Li]+
Extracted Ion Chromatogram
IPAD Trace
20907a
MS
66
• Size Exclusion Chromatography
• Ligand Exchange (Metal & H+ Loaded Cation Exchangers)
• RP- and Amino Columns
• HILIC
• for Labled and
• Non-Labled Carbohydrates
• HPAEC – IPAD
• Summary
Presentations’ Backbone
67
• Size Exclusion Chromatography
• Ligand Exchange (Metal & H+ Loaded Cation Exchangers)
• RP- and Amino Columns
• HILIC
• for Labled and
• Non-Labled Carbohydrates
• HPAEC – IPAD
• Summary
Presentations’ Backbone
68
• Different Chromatographic Solutions
• From RP and Ligand Exchange via HILIC to Anion Exchange
• Adjustable Sensitivity and Selectivity
• RI
• CAD
• FLU, IPAD
• MS
• Solutions to fit the Analytical Demand
Summary – Carbohydrate LC Solutions
69
Thank you for your Attention!

Carbohydrate solutions 40 min

  • 1.
    The world leaderin serving science Jan Pettersson Nordic HPLC & Chromeleon Support (The presentation is mainly done by Detlef Jensen) Carbohydrate-Analysis – LC Approach, Separation and Detection
  • 2.
    2 NP IC Hydrophobic ChargedHydrophilic HILIC HPLC Adapted from:H. Hayen, Nachrichten aus der Chemie, 58, April 2010 Positioning Modern LC-Techniques
  • 3.
  • 4.
  • 5.
    5 • Extremely polar,partly ionic • Many similar and complex structures • Non-chromophoric • Often present in complex matrices • Often bonded to other molecules (Glycoproteins, glycolipids) Issues with Carbohydrate Analysis in LC
  • 6.
    6 • Size ExclusionChromatography • Ligand Exchange (Metal & H+ Loaded Cation Exchangers) • RP- and Amino Columns • HILIC • for Labled and • Non-Labled Carbohydrates • HPAEC – IPAD • Summary Presentations’ Backbone
  • 7.
    7 • Size ExclusionChromatography • Ligand Exchange (Metal & H+ Loaded Cation Exchangers) • RP- and Amino Columns • HILIC • for Labled and • Non-Labled Carbohydrates • HPAEC – IPAD • Summary Presentations’ Backbone
  • 8.
    8 • Size ExclusionChromatography • Ligand Exchange (Metal & H+ Loaded Cation Exchangers) • RP- and Amino Columns • HILIC • for Labled and • Non-Labled Carbohydrates • HPAEC – IPAD • Summary Presentations’ Backbone
  • 9.
    9 • Separates moleculesaccording to size (into bands) (small molecules elute late, large molecules elute early, very large molecule come in void) • Good separation of small oligo- and poly-saccharides consisting of simple, repeating units • Difficult to separate larger oligo- and poly-saccharides • Oligomers of same size co-elute • Runs are slow • Samples require de-salting • Most packing material are not rigid so cannot be run at high flow rate Size-exclusion chromatography (SEC / GPC / GFC)
  • 10.
  • 11.
    11 2.00 3.00 4.00 ElutionVolume (mL) 100000000 10000000 100000 10000 1000 100 10 1000000 SEC-300 SEC-1000 MolecularWeight(Da) Calibration Curves in SEC Elution Order: from High to Low Molecular Weight
  • 12.
  • 13.
  • 14.
    14 Dextrans on AcclaimSEC-1000 column 0 5 10 15 0 50 µRIU 4 3 2 1 Column: Acclaim SEC-1000 4.6 x 300 mm Eluent: 10 mM sodium perchlorate Flow: 0.35 mL/min Backpressure: 590 psi (4.07 Mpa) Temperature: 30°C Injection vol.: 5 L Detection Refractive Index Sample 5 mg/mL in mobile phase 1. Dextran, MW 580,000 2. Dextran, MW 200,000–300,000 3. Dextran, MW 35,000–50,000 4. Dextran, MW 10,000 RI
  • 15.
    15 0 5 10min 20 RIU DP800 DP200 DP100 DP50 DP20 DP10 DP5 DP400 Size-Exclusion Chromatography of Pullulan Fractions Column: Acclaim ™ SEC-300 Injection vol.: 50 µL Eluent: 10 mmol/L Acetate buffer Flow Rate: 1.0 mL/min Backpressure: 600-900 psi (4,1 – 6,2 MPa) Postcolumn Reagent: 300 mmol/L NaOH Detection: Pulsed Amperomerty (Au) Source: Von Klever - Eigenes Werk, Gemeinfrei, https://commons.wikimedia.org/w/index.php?curid=3825738 Maltotriose IPAD
  • 16.
    16 • Size ExclusionChromatography • Ligand Exchange (Metal & H+ Loaded Cation Exchangers) • RP- and Amino Columns • HILIC • for Labled and • Non-Labled Carbohydrates • HPAEC – IPAD • Summary Presentations’ Backbone
  • 17.
    17 • Size ExclusionChromatography • Ligand Exchange (Metal & H+ Loaded Cation Exchangers) • RP- and Amino Columns • HILIC • for Labled and • Non-Labled Carbohydrates • HPAEC – IPAD • Summary Presentations’ Backbone
  • 18.
    18 Interaction in LigandExchange Chromatography O OH OH OH Cn+ SO3 - SO3 -SO3 - SO3 -SO3 - O OH OH OH Cn+ SO3 - SO3 -SO3 - SO3 -SO3 - Resin Resin Shorter Retention Longer Retention
  • 19.
    19 Ligand Exchange Resinsfor Carbohydrate Analyses • Properties of resin • Sulfonic Acids • Metals as counter ions • Separation Process • Interaction between hydroxyl groups and metal • Dependent on metal • Specific features • Different interaction with anomeric carbon • Alpha- and beta-form (= Anomers) separated at room temperature!
  • 20.
    20 Ligand Exchange Resinsfor Carbohydrate Analyses • “Muta-rotation” between alpha- and beta-form is dependent on temperature • Bad peak shape at room temperature • Better peak shape at high temperatures • Separations always at ~ 80 °C column temperature Peaks: 1. Void 2. Maltotriose 3. Maltose 4. Glucose Column: HyperREZ XP H+ Eluent: H2O Flow rate: 0.6 mL/min Sample: Sugars from the preparation of high protein rice flour Detection: RI 105 15 1 3 3 1 2 2 4 4 Ambient Temperature 85°C 105 15 RI
  • 21.
    21 Temperature Effects inLigand Exchange Chromatography Temperature °C Columnpressure Theoreticalplates
  • 22.
    22 Column: HyperREZ XPCa2+ Eluent: Water Flow Rate: 0.6 mL/min Detector: Refractive Index Temperature: 80°C Peaks: 1. DP-5 2. DP-4 3. DP-3 4. DP-2 5. DP-1 8578 5 4 3 2 1 0 8 12 Minutes Analysis of Corn Syrup – Ligand Exchange, Order of Elution! DP RI
  • 23.
    23 Carbohydrate Retention inLigand Exchange Chromatography Saccharide H+ Ca2+ Pb2+ Raffinose 8,2 8,6 11,4 Maltotriose 7,7 8,7 11,9 Sucrose 9,8 9,4 11,9 Maltose 8,4 9,5 12,5 Lactose 8,6 9,7 12,8 Glucose 9,9 11,1 13,9 Xylose 10,6 12 15 Galactose 1,07 12,2 15,6 Mannose 1,5 12,5 16,7 Fructose 10,6 13,5 19,3 Arabinose 11,4 13,6 19,4 Fucose 12,2 13,7 17,1 Adonitol 11,5 14,9 20,4 Erythritol 12,7 15,6 20,3 Glycerol 14,1 16,1 19,5 Mannitol 11 17,3 28,9 Sorbitol 11,1 20,7 N/A Conditions: HyperRez Column: 300 x 7.7mm Mobile Phase: H2O Flow Rate: 0.6mL /min Detection: RI Temperature: 75°C (H+) 85°C (Ca2+) 80°C (Pb2+) Note: Partial Hydrolysis may occur with some carbohydrates using H+. Retention Times of Common Saccharides (min) RI
  • 24.
    24 Schematics of a„Deflection RI Detector“ n n0 Cell (Cross Section) Zero Glass Beam Splitter + - RI Signal Photo Detector 1 Photo Detector 2
  • 25.
    25 Refractive Index Detection(RI) • Universal Detector (non selective detector) • No Gradient Application • Low Sensitivity • Strong Dependence on Changes of Temperature and Pressure  Refractive index detector (RI or RID). Continuously measures the refractive index of the effluent. Used only in LC. The lowest sensitivity of all detectors. Useful when nothing else works and at high analyte concentrations. (Wikipedia) Measure the Change of Refraction Index of the Column Effluate.
  • 26.
    26 0.0 5.0 10.015.0 20.0 25.0 -0.00 5.00 µRIU min Lactate Formate Acetate Propionate Isobutyrate Butyrate Column: Thermo Scientific™ Dionex™ IonPac™ ICE-AS1 (4  250 mm) Eluent: 5 mmol/L Heptafluorobutyric acid Flow: 0.16 mL/min Detection: Refractive Index Temperature: 19°C Injection vol.: 10 µL Sample Prep.: The samples were diluted 1 : 5 and 1 : 10 with ultrapure water. Concentrations: 0,2-2 g/L range 0.06 % < RSD < 0,6% Organic Acids in Aqueous Samples RI
  • 27.
    27 • Size ExclusionChromatography • Ligand Exchange (Metal & H+ Loaded Cation Exchangers) • RP- and Amino Columns • HILIC • for Labled and • Non-Labled Carbohydrates • HPAEC – IPAD • Summary Presentations’ Backbone
  • 28.
    28 • Size ExclusionChromatography • Ligand Exchange (Metal & H+ Loaded Cation Exchangers) • RP- and Amino Columns • HILIC • for Labled and • Non-Labled Carbohydrates • HPAEC – IPAD • Summary Presentations’ Backbone
  • 29.
    29 Carbohydrates from Corn-Syrup– RP-C18 Column Column: Hypersil GOLD-C18 Eluent: Water Flow: 0.5 mL/min Detection: Refractive Index Temperature: RT Peaks: 1. DP-1 2. DP-2 3. DP-3 4. DP-4 5. DP-5 85760 20 Minutes 1 2 3 4 5 RIU RI
  • 30.
    30 Carbohydrates in Cider 0.02.0 4.0 6.0 8.0 10.0 12.0 14.0 16.0 0 20 40 60 80 100 µRIU min Fructose Glucose Sucrose Maltose Column: Hypersil GOLD Amino 5μm (4.6  250 mm) Eluent: Acetonitrile/Water (80/20, v/v) Flow: 1.0 mL/min Backpressure: 62 bar Detection: RI Temperature: 36°C Injection vol.: 25 L Sample Prep.: The samples were diluted with Acetonitrile/Water (50/50, v/v) and filtered (0.45 μm) RI
  • 31.
    31 • Amino groupsbound to silica surface • “Normal phase HPLC” – AKA: HILIC! • Acetonitrile (about 70%) in water as eluent • Oligosaccharides can precipitate at higher ACN-contents • Amino groups sensitive to carbonyl compounds! • Some Carbohydrates can react with the stationary phase. • Formation of Schiff bases and enamines can lead to the loss of the reducing sugars at higher temperatures or lower flow rates, resulting in inaccurate quantitation and degraded columns. Amino Phases for Carbohydrate Analyses R2R2 R1 R1 H2N-R3 R3 NO + R2R2 R1 R1 H2N-R3 R3 NO + (Formation of Schiff Base) Larger Oligo- and Polysaccharides can precipitate at higher ACN-Concentrations
  • 32.
    32 • Size ExclusionChromatography • Ligand Exchange (Metal & H+ Loaded Cation Exchangers) • RP- and Amino Columns • HILIC • for Labled • Non-Labled Carbohydrates • HPAEC – IPAD • Summary Presentations’ Backbone
  • 33.
    33 • Size ExclusionChromatography • Ligand Exchange (Metal & H+ Loaded Cation Exchangers) • RP- and Amino Columns • HILIC • for Labled • Non-Labled Carbohydrates • HPAEC – IPAD • Summary Presentations’ Backbone
  • 34.
    34 How Does HILICWork? ● HILIC separates compounds by passing a hydrophobic or mostly organic mobile phase across a neutral or charged hydrophilic stationary phase, causing solutes to elute in order of increasing hydrophilicity – the inverse of RPC. Also called “reverse reversed-phase” or “aqueous normal phase” chromatography
  • 35.
    35 ● “Neutral” surface ―Diolgroup ―Cyano group ● “Ion-Exchange” surface ―Silanol group ―Amino group ● “Zwitterionic” surface NH2 OH OH CN O HO HO HILIC Types N+ SO3 - CH3 CH3 Silica Silica Silica SilicaSilica Sulfobetaine Structure
  • 36.
    36 Hypothetical Retention Mechanismin HILIC (Reverse Reversed Phase) Mobile Phase (mostly organic) Mobile Phase („stagnant“, mostly aqueous) AnalyteAnalyte (Eluite) H Y D R O P H I L I C C O A T I N G SILICA WaterContent Inspired by: D. Alpert; http://www.silicol.co.il/WEB/8888/NSF/Web/1145/Israel%20lecture%20slides%2010-4-2010.pdf
  • 37.
    37 Organic Solvent ElutropicStrength in HILIC Solvent Elutropic Strength in HILIC Solvent ChemicalFormula Aproticsolvents Tetrahydrofuran(THF) C4H8O Acetone C3H6O Acetonitrile(ACN) CH3CN Proticsolvents Iso-propanol(IPA) CH3−CH(−OH)−CH3 Ethanol(EtOH) CH3−CH2−OH Methanol(MeOH) CH3−OH Water H−O−H CH3 CH3 O CH3 CH3 OH
  • 38.
    38 HILIC Columns andSelection TN 20741
  • 39.
    39 2-AB and 2-AA– Fluorescent Labels 2-AB (2-aminobenzamide) is one of the most widely used fluorescent labels for glycosylation analysis. 2-AA (2-aminobenzoic acid) is considered by many to be a superior replacement for 2-AB (2-aminobenzamide) in most types of complex glycan analysis. 2-AA is reported to have a higher fluorescence and gives higher labelling efficiencies than 2-AB. R2R2 R1 R1 H2N-R3 R3 NO + R2R2 R1 R1 H2N-R3 R3 NO + (Formation of Schiff Base) Important: Requires Reducing Sugars!!
  • 40.
    40 HILIC – Separationsof 2-AB-labled Glycanes Column: Accucore Amide HILIC (2.6 µm, 2.1 x 150 mm) Eluent: A: 50 mmol/LAmmonium formate (pH 4.3) B: Acetonitrile Gradient: 35 Minutes from 75 to 35% B Flow rate: 0.22 mL/min Temp.: 50°C Detection: FLU (λexc.= 360 nm; λemm.= 425 nm) Injection vol.: 2 µL (~ 300 fmol for GU3) Chromatogram courtesy of K. Darsow, S.Bartel & H. Lange, University of Erlangen-Nuremberg, Germany Larger Oligo- and Polysaccharides can precipitate at higher ACN-Concentrations FLU
  • 41.
    41 Dextran Ladder Column: Accucore150 Amide-HILIC Dimensions: 2.6 µm, 100 x 2.1 mm Mobile Phases: A: Acetonitrile B: 50mM Ammonium Formate (pH 4.5) Gradient: Time (min) %B 0 20 40 50 45 50 45.5 20 50 20 Flow: 500 µL/min Backpressure: 110 bar Temperature: 60 °C Injection: 2 µL 5 µL Detector: FL Em: 330 nm, Em: 420 nm Sample: 2-AB labeled Dextran Ladder Courtesy Ludger Ltd. 2 µL 5 µL Separation and detection of at least 21 glycans 5.0 10.0 15.0 20.0 25.0 30.0 35.0 40.0 45.0 0 100000 200000 300000 400000 500000 600000 700000 800000 900000 1 2 3 4 5 6 7 8 9 1011 min 30.00 35.00 40.00 45.00 0 50000 100000 150000 200000 250000 300000 350000 400000 10 11 12 13 14 15 16 17 18192021 min FLU
  • 42.
    42 • Silica Based •HILIC • Weak Anion Exchanger • Separation • Size • Charge • Polarity • Selectivity • Navite • Labeled Glycans GlycanPac AHX-1
  • 43.
    43 1 2 3 4 5 6 7 8 11 12 13 14 15 16 17 18 19 20 21 22 23 24 2526 FluorescenceCounts 9,10 Neutral Mono-Sialylated Di-Sialylated Tri-Sialylated Tetra-Sialylated Penta-Sialylated Minutes 40 0 7E5 20 30100 Column: GlycanPac AXH-1 (1.9 µm) Dimension: 2.1x150 mm Mobile phase: A: Acetonitrile (100 %) B: water C: Ammonium formate (100 mM, pH =4.4) Flow: 0.4 mL/min Temp: 30 oC Injection: 50 Pmoles Detection: Fluroscence (FLD3400) Sample: 2AB-N-glycan from Bovine Fetuin Time (min) % A %B %C Flow (mL/min) Curve -10 78 20 2 0.4 5 0 78 20 2 0.4 5 30 70 20 10 0.4 5 35 60 20 20 0.4 5 40 50 20 30 0.4 5 2AB-N-glycans from Bovine Fetuin – Charge, Size and Polarity. FLU
  • 44.
    44 • Size ExclusionChromatography • Ligand Exchange (Metal & H+ Loaded Cation Exchangers) • RP- and Amino Columns • HILIC • for Labled and • Non-Labled Carbohydrates • HPAEC – IPAD • Summary Presentations’ Backbone
  • 45.
    45 • Size ExclusionChromatography • Ligand Exchange (Metal & H+ Loaded Cation Exchangers) • RP- and Amino Columns • HILIC • for Labled and • Non-Labled Carbohydrates • HPAEC – IPAD • Summary Presentations’ Backbone
  • 46.
    46 Sugar Alcohols Column: ThermoScientific™ Acclaim™ HILIC 10, 3 µm Dimensions: 4.6 x 150 mm Mobile Phase: 90/10 v/v CH3CN/10 mM (total) NH4OAc, pH5 Temperature: 60 °C Flow Rate: 1 mL/min Inj. Volume: 5 µL Detection: CAD Peaks: (0.2 mg/mL in mobile phase) 1. Xylitol 2. Sorbitol 3. Inositol 0 4 862 10 Minutes mV 0 300 1 2 3 CAD
  • 47.
    49 Analysis of SimpleCarbohydrates 0.0 5.0 10.0 15.0 0.0 10.0 20.0 30.0 pA min Fructose Glucose Sucrose Lactose Maltose Standards 5 - 200 mg/L Column: Shodex Asahipak NH2P-50 4E 250 × 4.6 mm, 5 µm Mobile Phase: 78% Acetonitrile, 22% Water Flow Rate: 1.4 mL/min Column Temp.: 55 ºC Post Col..Temp: 30 ºC Injection: 5 µL Detector: CAD Nitrogen: 35 psi CAD
  • 48.
    50 Oligosaccharide Analysis Corn Syrup 36/43DE Corn Syrup (100µg on column). 43/43 Syrup (100µg on column). Mobile Phase: 45:55; water:acetonitrile Flow Rate: 1.1mL/min Column: Shodex Asahipak NH2P-50 4E; 4.6 x 250mm; 5µm Column Temperature: 40oC Injection Volume: 10µL 0 2 4 6 8 10 12 14 16 18 20 0.00 0.05 0.10 0.15 0.20 0.25 Minutes Response 0 2 4 6 8 10 12 14 16 18 20 0.00 0.05 0.10 0.15 0.20 0.25 Minutes Response 0 2 4 6 8 10 12 14 16 18 20 0.00 0.05 0.10 0.15 0.20 0.25 0.30 0.35 Minutes Response 0 2 4 6 8 10 12 14 16 18 20 0.00 0.05 0.10 0.15 0.20 0.25 0.30 0.35 Minutes Response DPDP CAD
  • 49.
    51 Maltodextrins on AcclaimSEC-1000 column MALTRIN M040 MALTRIN M200 MALTRIN M150 MALTRIN M100 0 3 6 9 12 15 0 100 pA Glucose Column: Acclaim SEC-1000 4.6 x 300 mm Eluent: 100 mM NH4OAc Flow: 0.35 mL/min Temperature: 30°C Injection vol.: 5 L Detection CAD Sample 5 mg/mL in mobile phase each. CAD
  • 50.
    52 • Size ExclusionChromatography • Ligand Exchange (Metal & H+ Loaded Cation Exchangers) • RP- and Amino Columns • HILIC • for Labled and • Non-Labled Carbohydrates • HPAEC – IPAD • Summary Presentations’ Backbone
  • 51.
    53 • Size ExclusionChromatography • Ligand Exchange (Metal & H+ Loaded Cation Exchangers) • RP- and Amino Columns • HILIC • for Labled and • Non-Labled Carbohydrates • HPAEC – IPAD • Summary Presentations’ Backbone
  • 52.
    54 Dissociation Constants ofCommon Carbohydrates (in water at 25°C) Sugar pKa Fructose 12.03 Mannose 12.08 Xylose 12.15 Glucose 12.28 Galactose 12.39 Dulcitol 13.43 Sorbitol 13.60 a-Methyl glucoside 13.71 pH 13 CH2OH ~OHO H H O CH2OH ~OH O O O O J.A. Rendleman. Ionization of Carbohydrates, American Chemical Society, Washington D.C., 1973, p. 51.
  • 53.
    55 Pellicular Anion-Exchange Beads(Latex) 3183-02 SO– 3 SO– 3 SO– 3 SO– 3 SO– 3 SO– 3 SO– 3 ~ 0.1 m-Diameter Latex Core Ion-Exchange Surface R3N+ R3N+ N+ R3 N+ R3 N+ R3 R3N+ R3N+ N+ R3 N+ R3 R3N+ R3N+ N+ R3 N+ R3 R3N+ R3N+ N+ R3 N+ R3 Highly efficient chromatographic separations, due to the small, chromatographically relevant Latex-beads
  • 54.
    56 Quadruple Potential Waveformfor Carbohydrates Waveform A, TN21 13450-01 –2 0 0.8 0.0 0.1 0.2 0.3 0.4 0.5 Time (seconds) Potential(Vvs.Ag/AgCl) Electrode Cleaning Au Oxide Reduction, Electrode Activation Au Oxide Formation Integrate Time Pot. Integ. 0.00 +0.1 0.20 +0.1 Begin 0.40 +0.1 End 0.41 –2.0 0.42 –2.0 0.43 +0.6 0.44 –0.1 0.50 –0.1 IPAD: Integrated Pulsed Amperometric Detection
  • 55.
    57 Fast Determination ofLactose Column: CarboPac PA20-Fast-4µm 2mm Eluent: NaOH / NaOAc-Gradient Temp.: 30 °C Flow Rate: 0.2 mL/min Inj Volume: 2.5 µL Detection: Integrated Amperometry quadruple-pulse waveform Electrodes Working: Au (Carbohydrate-Disposable) Reference: Ag/AgCl 0 2 4 6 8 10 12 14 Time (min) 0 20 40 60 80 100 120 Lactose Fructose Galactose / Glucose Response(nC) IPAD
  • 56.
    58 Determination of Lactosetrace levels Column: CarboPac PA20-3mm Eluent: NaOH Temp.: 30 °C Flow Rate: 0.5 mL/min / 0,1 mL/min Inj Volume: 30 µL Detection: Integrated Amperometry quadruple-pulse waveform Electrodes Working: Au (Carbohydrate-Disposable) Reference: Ag/AgCl IPAD
  • 57.
    59 Determination of Lactosetrace levels IPAD From 0,05 ppm to 25 ppm
  • 58.
    60 Wood Sugars IPAD Column:CarboPac PA1 -4mm Eluent: NaOH/NaAc Temp.: 30 °C Flow Rate: 1 mL/min Inj Volume: 30 µL Detection: Integrated Amperometry quadruple-pulse waveform Electrodes Working: Au (Carbohydrate-Disposable) Reference: Ag/AgCl
  • 59.
    62 Improved Chain-Length Resolutionof Inulin Polymers Columns: Thermo Scientific™ Dionex™ CarboPac™ PA200 (3 x 250 mm) PA100 (4 x 250 mm) Gradient: 120- to 320-mM NaOAc in 100 mM NaOH over 40 min Flow Rate: PA200: 0.5 mL/min PA100: 1.0 mL/min Detection: Pulsed amperometry, quadruple waveform, gold electrode 180 0 10 20 30 40 50 60 –20 nC Minutes PA200 PA100 0 IPAD
  • 60.
    63 Suppressor Technology Enablesthe Successful Coupling of IC to Mass Spectrometry Sample acetate-, succinate2-, citrate3- Ion exchange separation column K-acetate, K2-succinate, K3-citrate Injection valve Eluent (KOH) Analytes in KOH Thermo Scientific™ DionexTM AERS anion electrolytically Regenerating suppressor Acetic acid, succinic acid, citric acid Analytes in water To waste K+
  • 61.
    64 Schematics for HPAEC-PAD/MS DP Eluent Pump Auto Sampler SeparatorGuardDesalter ISQ EC Electrochemical Detector Data system Signals 0.31 nC Flow 0.50 Splitter cell 0.5 mM LiCl Pump Flow 0.0 5
  • 62.
    65 Detection of DP3in Inuline 65 –10 100 250 nC 0 10 20 30 40 50 –25 000 200 000 400 000 counts Minutes 510.50–511.50 m/z GF2 F3 673 GF3 835 GF4 0 50 120 150 200 250 300 350 400 450 500 550 600 DP3a AV: 8.18-8.53 min (11) SB: 5.91-6.74 (25) NL: 2.64E5 T: {0,0} + c ESI corona sid=100.00 det=1129.00 Full ms ... 511 331 349 169 205 253 % [Hex3+Li]+ [Hex2 + Li]+ [Hex2 – H2O + Li]+ [Hex1 – H2O + Li]+ 187 [Hex1 + Li]+ [Hex1 + H2O Li]+ Extracted Ion Chromatogram IPAD Trace 20907a MS
  • 63.
    66 • Size ExclusionChromatography • Ligand Exchange (Metal & H+ Loaded Cation Exchangers) • RP- and Amino Columns • HILIC • for Labled and • Non-Labled Carbohydrates • HPAEC – IPAD • Summary Presentations’ Backbone
  • 64.
    67 • Size ExclusionChromatography • Ligand Exchange (Metal & H+ Loaded Cation Exchangers) • RP- and Amino Columns • HILIC • for Labled and • Non-Labled Carbohydrates • HPAEC – IPAD • Summary Presentations’ Backbone
  • 65.
    68 • Different ChromatographicSolutions • From RP and Ligand Exchange via HILIC to Anion Exchange • Adjustable Sensitivity and Selectivity • RI • CAD • FLU, IPAD • MS • Solutions to fit the Analytical Demand Summary – Carbohydrate LC Solutions
  • 66.
    69 Thank you foryour Attention!