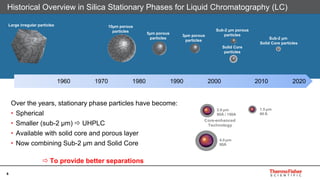
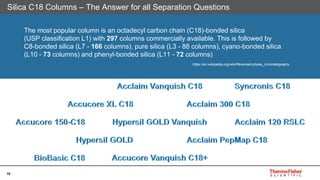
The world leader in serving science
Column Selectivity
Naghmeh Berglund
February 2019
Finland
2
Overview
• When selecting a column
• Solid Core Enhanced Technology
• Why C18
3
What are we Looking for when Selecting a Column
C18 C8
C4
C30
HilicIEX
PFP SEC
Mixed
Mode
• Need retention between analyte and column
• Reverse phase, hydrophobic interactions
• Polar compounds – HILIC, Ion exchange
• Column needs to differentiate between similar molecules
• Look to the differences in the analyte’s to help with the choice of
separation column
• Column needs to be stable in conditions being used
• Overloading
• pH effects
 Remember: Silica dissolves above pH 7
• Temperature effects
4
What are we Looking for when Selecting a Column (ii)
• Resolution
• The degree of separation between
two adjacent peaks
• Higher R, better separation
• Resolution ≥ 1.50
• Separation quality good enough to
accurately measue peak area or
peak height of each peak
• Key-factors in resolution
• Retention
• Efficiency
• Selectivity
5
What are we Looking for when Selecting a Column (iii)
• Retention or capacity factor(k)
• Amount of time spend by an analyte interacting with the stationary
phase
• High k value indicates more retention
• Selectivity or separation factor (α)
• Ability to ‘chemically’ distinguish between sample components
• Greatest impact on resolution
• Efficiency (N)
• The efficiency of a chromatographic peak is a measure of the
dispersion of the analyte band as it travels through the HPLC
system
and column
• The plate number is a measure of the peak dispersion on the
HPLC column, which reflects the column performance
6
Historical Overview in Silica Stationary Phases for Liquid Chromatography (LC)
https://www.youtube.com/watch?v=efUrl_djzQ0
Large irregular particles 10µm porous
particles
5µm porous
particles
3µm porous
particles
Sub-2 µm porous
particles
Solid Core
particles
Sub-2 µm
Solid Core particles
1960 1970 1980 1990 2000 2010 2020
Over the years, stationary phase particles have become:
• Spherical
• Smaller (sub-2 µm)  UHPLC
• Available with solid core and porous layer
• Now combining Sub-2 µm and Solid Core
 To provide better separations
Core-enhanced
Technology
2.6 µm
80Å / 150A
1.5 µm
80 Å
4.0 µm
80Å
7
Effect of particle size distribution
Fully Porous Particles D90/10 ~ 1.5
Core Enhanced Technology D90/10 ~ 1.1
8
Speed, Sensitivity, Peak Capacity, Low Backpressure
9
1.5µm Accucore Vanquish Column Technology
• Increasing efficiency = Better separations
40% efficiency gain
10
The most popular column is an octadecyl carbon chain (C18)-bonded silica
(USP classification L1) with 297 columns commercially available. This is followed by
C8-bonded silica (L7 - 166 columns), pure silica (L3 - 88 columns), cyano-bonded silica
(L10 - 73 columns) and phenyl-bonded silica (L11 - 72 columns)
https://en.wikipedia.org/wiki/Reversed-phase_chromatography
Silica C18 Columns – The Answer for all Separation Questions
https://www.youtube.com/watch?v=efUrl_djzQ0
11
• Reversed Phase is the most popular mode of liquid chromatography
• C18 covers 80-90% of Reversed Phase
• Your trustworthy C18 columns is typically the first choice to target new analytes
• Retention is primarily based on the analyte’s hydrophobicity
So, is C18 Really the only Answer
Phenyl
12
Phase Charactarisation
Hydrophobic retention (HR)
Hydrophobic selectivity (HS)
Steric Selectivity (SS)
Hydrogen bonding capacity (HBC) - Good measure of degree of
endcapping/ indicative of available surface area
Activity towards bases - Indicator of free silanols
Activity towards chelators - Indicator of silica metal content
Ion Exchange Capacity (pH 7.6) - Indicator of total silanol activity
Activity towards acids - Indicator of interactions with acidic
compounds
Ion Exchange Capacity (pH 2.7) - Indicator of acidic silanol activity
Hydrophobic
Interactions
Secondary
Interactions
Acidic Interactions
Hydrophobic
retention
Base activity Acid interaction
HR BA AI
Hydrophobic
selectivity
Chelation Ion exchange
capacity pH 2.6
HS C IEX (2.6)
Steric selectivity Ion exchange
capacity (pH 7.6)
SS IEX (7.6)
Hydrogen bonding
capacity
HBC
13
Phase Characterization
RP-MS
Optimized for MS
detection, excellent
combination of
speed and quality
of separation
Phenyl-Hexyl
Unique selectivity
for aromatic and
moderately polar
analytes
C18
Optimum retention
for non-polar
analytes
PFP
Alternative
selectivity to C18,
particularly for
halogenated
analytes
aQ
Compatible with
100% aqueous
mobile phases,
special selectivity
for polar analytes
HILIC
Enhanced
Retention of polar
and hydrophilic
analytes
14
Bonded Phase:
• Encapped
• Embedded
Silica Support:
• Type I or Type II silica
• Silica metal ion content
• Fully porous, polymeric or superficially porous support
• Pure Silica or organic/inorganic hybrid
• Particle size and particle size distribution
• Pore size, surface area
Column selectivity
15
Wide range of Accucore separation functionalities
• Accucore RP-MS
• Accucore Polar Premium
• Accucore C18
• Accucore Phenyl-X
• Accucore C8
• Accucore C30
• Accucore aQ
• Accucore HILIC
• Accucore Urea-HILIC
• Accucore Phenyl-Hexyl
• Accucore PFP
2.6µm
Accucore 150-C18
Accucore 150-C4
Accucore 150-Amide-HILIC
4µm
Accucore XL C18
Accucore XL C8
1.5µm
Accucore Vanquish C18
New
Accucore
Biphenyl
16
Structural isomers on C18 and Biphenyl column
Molar mass 346.467g/mol
17
New Accucore Biphenyl Column Robustness
18
Accucore Biphenyl Lot-to-Lot Consistency
19
Different Selectivity can Provide a More Complete Picture
20
Accucore C18 vs Accucore Phenyl-X
Columns: Accucore Phenyl-X
Accucore C18
Dimensions: 2.6 µm, 100 x 2.1 mm
Mobile Phases: A: Acetonitrile
B: Methanol
C: Water
Isocratic: 15% A, 40% B, 45% C
Flow: 400 µL/min
Temperature: 40 °C
Injection: 1 µL
Detector: UV 220 nm
mAU
0
20
40
60
80
1.47
Minutes
0.0 0.5 1.0 1.5 2.0 2.5 3.0 3.5 4.0 4.5 5.0
mAU
0
20
40
60
80
100
1
1
2
3
2
4
34
Rs 1.25
Rs 2.04
1. Estriol (E3)
2. Estradiol ( E2)
3. Estrone (E1)
4. Ethynylestradiol
Accucore Phenyl-X
Accucore C18
Phenyl-X shows
different
selectivity and
better resolution
21
Accucore C18 vs Accucore C30
Columns: Accucore C30
Accucore C18
Kinetex C18
Dimensions: 2.6µm , 100 x 3.0 mm
Mobile Phases: Methanol:buffer, 98:2
Buffer = 2 mM ammonium acetate
Flow: 650 µL/min
Temperature: 20 ºC
Injection: 5 µL
Detector: UV 250 nm
Peaks: 1. Vitamin K2, 50 µg/mL
2. Vitamin K1, 50 µg/mL
Other peaks formed by UV irradiation
Vitamin K2 Vitamin K1
1
2+2’
2
1
2’
Different selectivity for K2 isomers
C30 shows better
separation for K1
isomers
Kinetex C18
Accucore C30
0.00 1.25 2.50 3.75 5.00 6.25 8.00
-25
50
100
150
200
250
300
350 mAU
min
Accucore C18
2+2’
0
Kinetex® is a registered trademark of Phenomenex Inc., USA
22
Summary
C18 is typically an excellent general purpose column
https://www.youtube.com/watch?v=efUrl_djzQ0
• Look beyond the C18
• Ask for required application or analytes
• Also as a complementary column for confimation of results
• And do not forget alternative column vendor selection
• Especially for C18
23
Thank You For Your Attention

Column selectivity HPLC Vanquish

  • 1.
    The world leaderin serving science Column Selectivity Naghmeh Berglund February 2019 Finland
  • 2.
    2 Overview • When selectinga column • Solid Core Enhanced Technology • Why C18
  • 3.
    3 What are weLooking for when Selecting a Column C18 C8 C4 C30 HilicIEX PFP SEC Mixed Mode • Need retention between analyte and column • Reverse phase, hydrophobic interactions • Polar compounds – HILIC, Ion exchange • Column needs to differentiate between similar molecules • Look to the differences in the analyte’s to help with the choice of separation column • Column needs to be stable in conditions being used • Overloading • pH effects  Remember: Silica dissolves above pH 7 • Temperature effects
  • 4.
    4 What are weLooking for when Selecting a Column (ii) • Resolution • The degree of separation between two adjacent peaks • Higher R, better separation • Resolution ≥ 1.50 • Separation quality good enough to accurately measue peak area or peak height of each peak • Key-factors in resolution • Retention • Efficiency • Selectivity
  • 5.
    5 What are weLooking for when Selecting a Column (iii) • Retention or capacity factor(k) • Amount of time spend by an analyte interacting with the stationary phase • High k value indicates more retention • Selectivity or separation factor (α) • Ability to ‘chemically’ distinguish between sample components • Greatest impact on resolution • Efficiency (N) • The efficiency of a chromatographic peak is a measure of the dispersion of the analyte band as it travels through the HPLC system and column • The plate number is a measure of the peak dispersion on the HPLC column, which reflects the column performance
  • 6.
    6 Historical Overview inSilica Stationary Phases for Liquid Chromatography (LC) https://www.youtube.com/watch?v=efUrl_djzQ0 Large irregular particles 10µm porous particles 5µm porous particles 3µm porous particles Sub-2 µm porous particles Solid Core particles Sub-2 µm Solid Core particles 1960 1970 1980 1990 2000 2010 2020 Over the years, stationary phase particles have become: • Spherical • Smaller (sub-2 µm)  UHPLC • Available with solid core and porous layer • Now combining Sub-2 µm and Solid Core  To provide better separations Core-enhanced Technology 2.6 µm 80Å / 150A 1.5 µm 80 Å 4.0 µm 80Å
  • 7.
    7 Effect of particlesize distribution Fully Porous Particles D90/10 ~ 1.5 Core Enhanced Technology D90/10 ~ 1.1
  • 8.
    8 Speed, Sensitivity, PeakCapacity, Low Backpressure
  • 9.
    9 1.5µm Accucore VanquishColumn Technology • Increasing efficiency = Better separations 40% efficiency gain
  • 10.
    10 The most popularcolumn is an octadecyl carbon chain (C18)-bonded silica (USP classification L1) with 297 columns commercially available. This is followed by C8-bonded silica (L7 - 166 columns), pure silica (L3 - 88 columns), cyano-bonded silica (L10 - 73 columns) and phenyl-bonded silica (L11 - 72 columns) https://en.wikipedia.org/wiki/Reversed-phase_chromatography Silica C18 Columns – The Answer for all Separation Questions https://www.youtube.com/watch?v=efUrl_djzQ0
  • 11.
    11 • Reversed Phaseis the most popular mode of liquid chromatography • C18 covers 80-90% of Reversed Phase • Your trustworthy C18 columns is typically the first choice to target new analytes • Retention is primarily based on the analyte’s hydrophobicity So, is C18 Really the only Answer Phenyl
  • 12.
    12 Phase Charactarisation Hydrophobic retention(HR) Hydrophobic selectivity (HS) Steric Selectivity (SS) Hydrogen bonding capacity (HBC) - Good measure of degree of endcapping/ indicative of available surface area Activity towards bases - Indicator of free silanols Activity towards chelators - Indicator of silica metal content Ion Exchange Capacity (pH 7.6) - Indicator of total silanol activity Activity towards acids - Indicator of interactions with acidic compounds Ion Exchange Capacity (pH 2.7) - Indicator of acidic silanol activity Hydrophobic Interactions Secondary Interactions Acidic Interactions Hydrophobic retention Base activity Acid interaction HR BA AI Hydrophobic selectivity Chelation Ion exchange capacity pH 2.6 HS C IEX (2.6) Steric selectivity Ion exchange capacity (pH 7.6) SS IEX (7.6) Hydrogen bonding capacity HBC
  • 13.
    13 Phase Characterization RP-MS Optimized forMS detection, excellent combination of speed and quality of separation Phenyl-Hexyl Unique selectivity for aromatic and moderately polar analytes C18 Optimum retention for non-polar analytes PFP Alternative selectivity to C18, particularly for halogenated analytes aQ Compatible with 100% aqueous mobile phases, special selectivity for polar analytes HILIC Enhanced Retention of polar and hydrophilic analytes
  • 14.
    14 Bonded Phase: • Encapped •Embedded Silica Support: • Type I or Type II silica • Silica metal ion content • Fully porous, polymeric or superficially porous support • Pure Silica or organic/inorganic hybrid • Particle size and particle size distribution • Pore size, surface area Column selectivity
  • 15.
    15 Wide range ofAccucore separation functionalities • Accucore RP-MS • Accucore Polar Premium • Accucore C18 • Accucore Phenyl-X • Accucore C8 • Accucore C30 • Accucore aQ • Accucore HILIC • Accucore Urea-HILIC • Accucore Phenyl-Hexyl • Accucore PFP 2.6µm Accucore 150-C18 Accucore 150-C4 Accucore 150-Amide-HILIC 4µm Accucore XL C18 Accucore XL C8 1.5µm Accucore Vanquish C18 New Accucore Biphenyl
  • 16.
    16 Structural isomers onC18 and Biphenyl column Molar mass 346.467g/mol
  • 17.
    17 New Accucore BiphenylColumn Robustness
  • 18.
  • 19.
    19 Different Selectivity canProvide a More Complete Picture
  • 20.
    20 Accucore C18 vsAccucore Phenyl-X Columns: Accucore Phenyl-X Accucore C18 Dimensions: 2.6 µm, 100 x 2.1 mm Mobile Phases: A: Acetonitrile B: Methanol C: Water Isocratic: 15% A, 40% B, 45% C Flow: 400 µL/min Temperature: 40 °C Injection: 1 µL Detector: UV 220 nm mAU 0 20 40 60 80 1.47 Minutes 0.0 0.5 1.0 1.5 2.0 2.5 3.0 3.5 4.0 4.5 5.0 mAU 0 20 40 60 80 100 1 1 2 3 2 4 34 Rs 1.25 Rs 2.04 1. Estriol (E3) 2. Estradiol ( E2) 3. Estrone (E1) 4. Ethynylestradiol Accucore Phenyl-X Accucore C18 Phenyl-X shows different selectivity and better resolution
  • 21.
    21 Accucore C18 vsAccucore C30 Columns: Accucore C30 Accucore C18 Kinetex C18 Dimensions: 2.6µm , 100 x 3.0 mm Mobile Phases: Methanol:buffer, 98:2 Buffer = 2 mM ammonium acetate Flow: 650 µL/min Temperature: 20 ºC Injection: 5 µL Detector: UV 250 nm Peaks: 1. Vitamin K2, 50 µg/mL 2. Vitamin K1, 50 µg/mL Other peaks formed by UV irradiation Vitamin K2 Vitamin K1 1 2+2’ 2 1 2’ Different selectivity for K2 isomers C30 shows better separation for K1 isomers Kinetex C18 Accucore C30 0.00 1.25 2.50 3.75 5.00 6.25 8.00 -25 50 100 150 200 250 300 350 mAU min Accucore C18 2+2’ 0 Kinetex® is a registered trademark of Phenomenex Inc., USA
  • 22.
    22 Summary C18 is typicallyan excellent general purpose column https://www.youtube.com/watch?v=efUrl_djzQ0 • Look beyond the C18 • Ask for required application or analytes • Also as a complementary column for confimation of results • And do not forget alternative column vendor selection • Especially for C18
  • 23.
    23 Thank You ForYour Attention