cafe24 042000 Algorithm Investment Report
•
0 likes•76 views

This document provides a performance analysis of an algorithm company over several periods from 2015-2019. It includes key financial metrics such as sales, operating profit, net income, debt ratios, and earnings per share. It also evaluates the company's current stock price compared to different price ranges and provides a stock purchase recommendation based on the company's probability score. Two sectors, A and B, are analyzed and charts show their historical probability scores and rate of stock price increases. The document concludes with compliance notices regarding the use of the analysis.
![[Price for scheduled purchasing]
Arbitrarily made
Algorithm stocks Trading Strategies (consolidated) 042000 Date
Period
Gap
(Indication /
stock)
Color
2019-05-13
3 months
Current stock price Evaluation
Stock price rise
probability score
Investment opinion Prospective purchase amount
74,800 W High price 27.1 Sell 3,000,000 W
Suggested Purchase
Amount 411,653 W
Number of stocks
purchased 6
Indication price Range Buying / Selling Buying / Selling [Stocks]
High price 64,966 W 64,966 W~ ~ 55,900 W -13 % 54,121 W 1
High mid 55,900 W 55,900 W ~ 46,835 W -25 % 104,012 W 2
Mid 46,835 W 46,835 W ~ 37,769 W -37 % 153,903 W 3
Low mid 37,769 W 37,769 W ~ 28,704 W -50 % 203,794 W 5
low price 28,704 W 28,704 W ~ 0 W -62 % 253,686 W 9
Stock price rise
probability score
A Sector 44.8 47.9 50.2 40.4 47.6 45.5
27.1B Sector 38.8 36.7 64.6 40.4 56.3 42.1
Total average
2018.12.10 2019.01.10 2019.02.12 2019.03.13 2019.04.10 2019.05.10
41.8 42.3 57.4 24.6 51.9 43.8
53 % -19 %
2019.01.10 2019.02.12 2019.03.13 2019.04.10 2019.05.10
Total of
increase rate
Total score
A Sector 6 % 5 % -24 % 15 % -5 %
-14 % 47.0B Sector -6 % 43 % -60 % 28 % -34 %
Total average 1 % 26 % -133 %
45 48 50
40
48 46
39 37
65
40
56
4242 42
57
25
52
44
0
10
20
30
40
50
60
70
2018.12.10 2019.01.10 2019.02.12 2019.03.13 2019.04.10 2019.05.10
Stock price rise probability score
A sector
B sector
Total average
6% 5%
-24%
15%
-5%-6%
43%
-60%
28%
-34%
1%
26%
-133%
53%
-19%
-150%
-100%
-50%
0%
50%
100%
2019.01.10 2019.02.12 2019.03.13 2019.04.10 2019.05.10
Increase rate of stock price rise
A sector
B sector
Total average
cafe24](data:image/gif;base64,R0lGODlhAQABAIAAAAAAAP///yH5BAEAAAAALAAAAAABAAEAAAIBRAA7)
Recommended
Recommended
More Related Content
What's hot
What's hot (20)
Similar to cafe24 042000 Algorithm Investment Report
Similar to cafe24 042000 Algorithm Investment Report (20)
More from 알고리즘 기업분석 컨설팅-알기컨,algikeon
More from 알고리즘 기업분석 컨설팅-알기컨,algikeon (20)
Recently uploaded
Recently uploaded (8)
cafe24 042000 Algorithm Investment Report
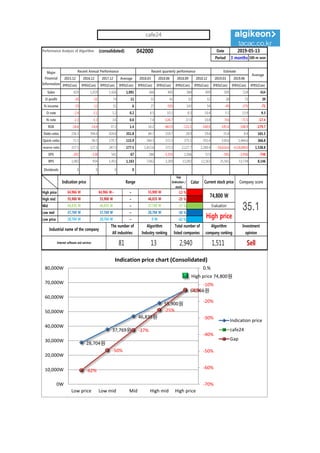
- 1. Performance Analysis of Algorithm (consolidated) 042000 Date Period 3 months 100-m won 2015.12 2016.12 2017.12 Average 2018.03 2018.06 2018.09 2018.12 2019.03 2019.06 IFRS(Con) IFRS(Con) IFRS(Con) IFRS(Con) IFRS(Con) IFRS(Con) IFRS(Con) IFRS(Con) IFRS(Con) IFRS(Con) IFRS(Con) Sales 829 1,019 1,426 1,091 366 405 384 499 509 524 414 O-profit -20 -21 74 11 31 41 32 52 28 73 39 N-income -19 -13 51 6 27 -505 142 54 -49 -375 -71 O-rate -2.4 -2.1 5.2 0.2 8.5 10.1 8.3 10.4 5.5 13.9 9.3 N-rate -2.3 -1.3 3.6 0.0 7.4 -124.7 37.0 10.8 -9.6 -71.5 -17.4 ROE -18.6 -14.4 37.2 1.4 16.2 -463.9 -131.1 -140.0 -145.4 -148.9 -179.7 Debt-ratio 236.3 394.4 424.8 351.8 84.7 518.7 28.9 29.6 15.8 8.4 165.5 Quick-ratio 71.5 96.5 179.7 115.9 364.3 372.3 375.1 355.4 530.6 1,444.6 366.8 reserve-ratio 157.5 127.5 247.5 177.5 1,413.6 373.3 2,127.7 2,240.4 -50,616.6 -4,526,888.0 1,538.8 EPS -201 -138 541 67 286 -5,355 1,506 573 -545 -3,956 -748 BPS 1,082 954 1,453 1,163 7,062 2,269 11,092 12,163 25,565 53,734 8,146 Dividends 0 0 0 0 2019-05-13 Major Financial Information Recent Annual Performance Recent quarterly performance Estimate Average Gap (Indication / stock) Color High price ~ -13 % High mid ~ -25 % Mid ~ -37 % Low mid ~ -50 % Low price ~ -62 % Indication price Range Current stock price Company score 55,900 W 55,900 W 46,835 W 46,835 W 46,835 W 37,769 W Evaluation 64,966 W 64,966 W~ 55,900 W 74,800 W 35.137,769 W 37,769 W 28,704 W High price Sell 28,704 W 28,704 W 0 W Industrial name of the company The number of All industries Algorithm Industry ranking Total number of listed companies Algorithm company ranking Investment opinion Internet software and services 81 13 2,940 1,511 28,704원 37,769원 46,835원 55,900원 64,966원 High price 74,800원 -62% -50% -37% -25% -13% -70% -60% -50% -40% -30% -20% -10% 0.% 0W 10,000W 20,000W 30,000W 40,000W 50,000W 60,000W 70,000W 80,000W Low price Low mid Mid High mid High price Indication price chart (Consolidated) Indication price cafe24 Gap cafe24
- 2. [Price for scheduled purchasing] Arbitrarily made Algorithm stocks Trading Strategies (consolidated) 042000 Date Period Gap (Indication / stock) Color 2019-05-13 3 months Current stock price Evaluation Stock price rise probability score Investment opinion Prospective purchase amount 74,800 W High price 27.1 Sell 3,000,000 W Suggested Purchase Amount 411,653 W Number of stocks purchased 6 Indication price Range Buying / Selling Buying / Selling [Stocks] High price 64,966 W 64,966 W~ ~ 55,900 W -13 % 54,121 W 1 High mid 55,900 W 55,900 W ~ 46,835 W -25 % 104,012 W 2 Mid 46,835 W 46,835 W ~ 37,769 W -37 % 153,903 W 3 Low mid 37,769 W 37,769 W ~ 28,704 W -50 % 203,794 W 5 low price 28,704 W 28,704 W ~ 0 W -62 % 253,686 W 9 Stock price rise probability score A Sector 44.8 47.9 50.2 40.4 47.6 45.5 27.1B Sector 38.8 36.7 64.6 40.4 56.3 42.1 Total average 2018.12.10 2019.01.10 2019.02.12 2019.03.13 2019.04.10 2019.05.10 41.8 42.3 57.4 24.6 51.9 43.8 53 % -19 % 2019.01.10 2019.02.12 2019.03.13 2019.04.10 2019.05.10 Total of increase rate Total score A Sector 6 % 5 % -24 % 15 % -5 % -14 % 47.0B Sector -6 % 43 % -60 % 28 % -34 % Total average 1 % 26 % -133 % 45 48 50 40 48 46 39 37 65 40 56 4242 42 57 25 52 44 0 10 20 30 40 50 60 70 2018.12.10 2019.01.10 2019.02.12 2019.03.13 2019.04.10 2019.05.10 Stock price rise probability score A sector B sector Total average 6% 5% -24% 15% -5%-6% 43% -60% 28% -34% 1% 26% -133% 53% -19% -150% -100% -50% 0% 50% 100% 2019.01.10 2019.02.12 2019.03.13 2019.04.10 2019.05.10 Increase rate of stock price rise A sector B sector Total average cafe24
- 3. 정보와 완전 정보 결 투자판단 있습니 위배 무단으 숙지하 Compliance notice ① The information provided by The Algorithm Company Analysis Consulting is obtained through reliable data and information and The Algorithm Company Analysis Program (TACAP), but its accuracy or completeness are not guaranteed. Furthermore, it may change over time.Therefore, we are not legally responsible for the results of the data provided by The Algorithm Company Analysis Consulting because of information errors or omissions. ② The Algorithm Company Analysis Consulting and all the information provided on it site are reference materials for investment decisions and the final responsibility of investment is up to users utilizing this information. ③ The Algorithm Company Analysis Consulting and its site do not do anything that violates the related laws such as discretionary transaction. ④ Users can not reallocate and recycle the information provided by The Algorithm Company Analysis Consulting firm let alone the information provided by its Site. ⑤ Be sure to know about application period of this algorithm analysis report in order to improve its accuracy. Tel : 070 - 4667 - 5009 Email : tacac@tacac.co.kr Homepage : tacac.co.kr Blog : tacac.blog.me SERVICES EDUCATION, M&A, IPO, RECOVER, CORPORATE RESTRUCTURING, MANAGEMENT OF TECHNOLOGY, BUSINESS STRATEGY, FAMILY BUSINESS Request : http://tacac.co.kr/?page_id=1374 ① Consulting The Algori accuracy o change ove results of Consulting ② informatio investmen up ③ do anythin transaction ④ The Algori informatio ⑤ analysis re