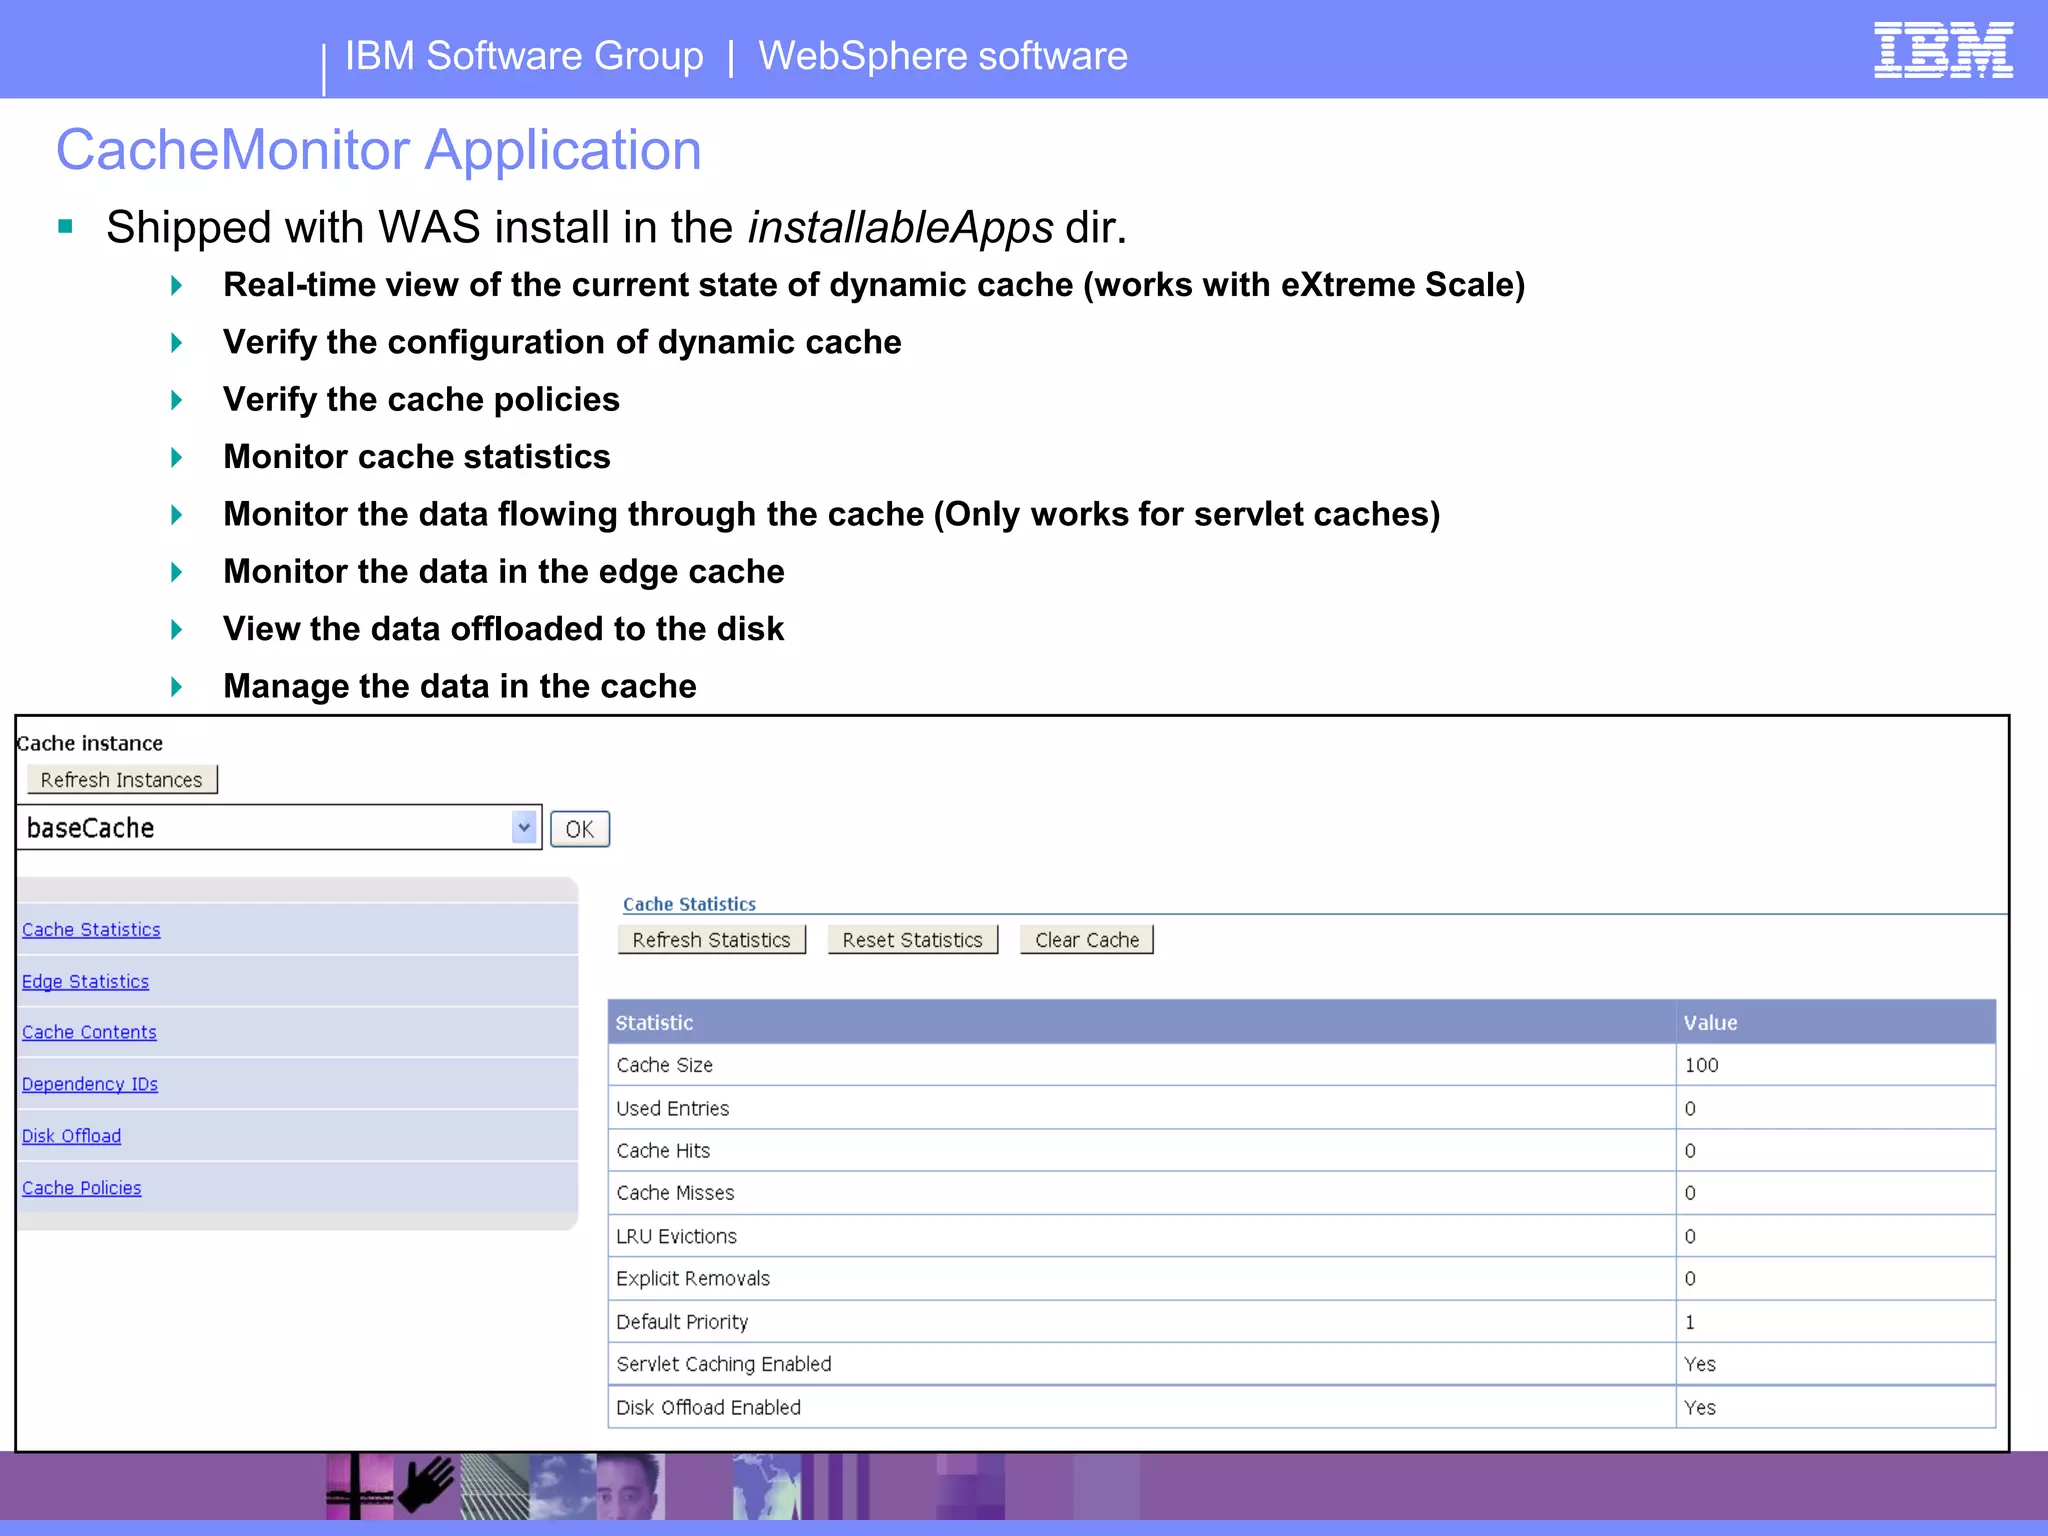
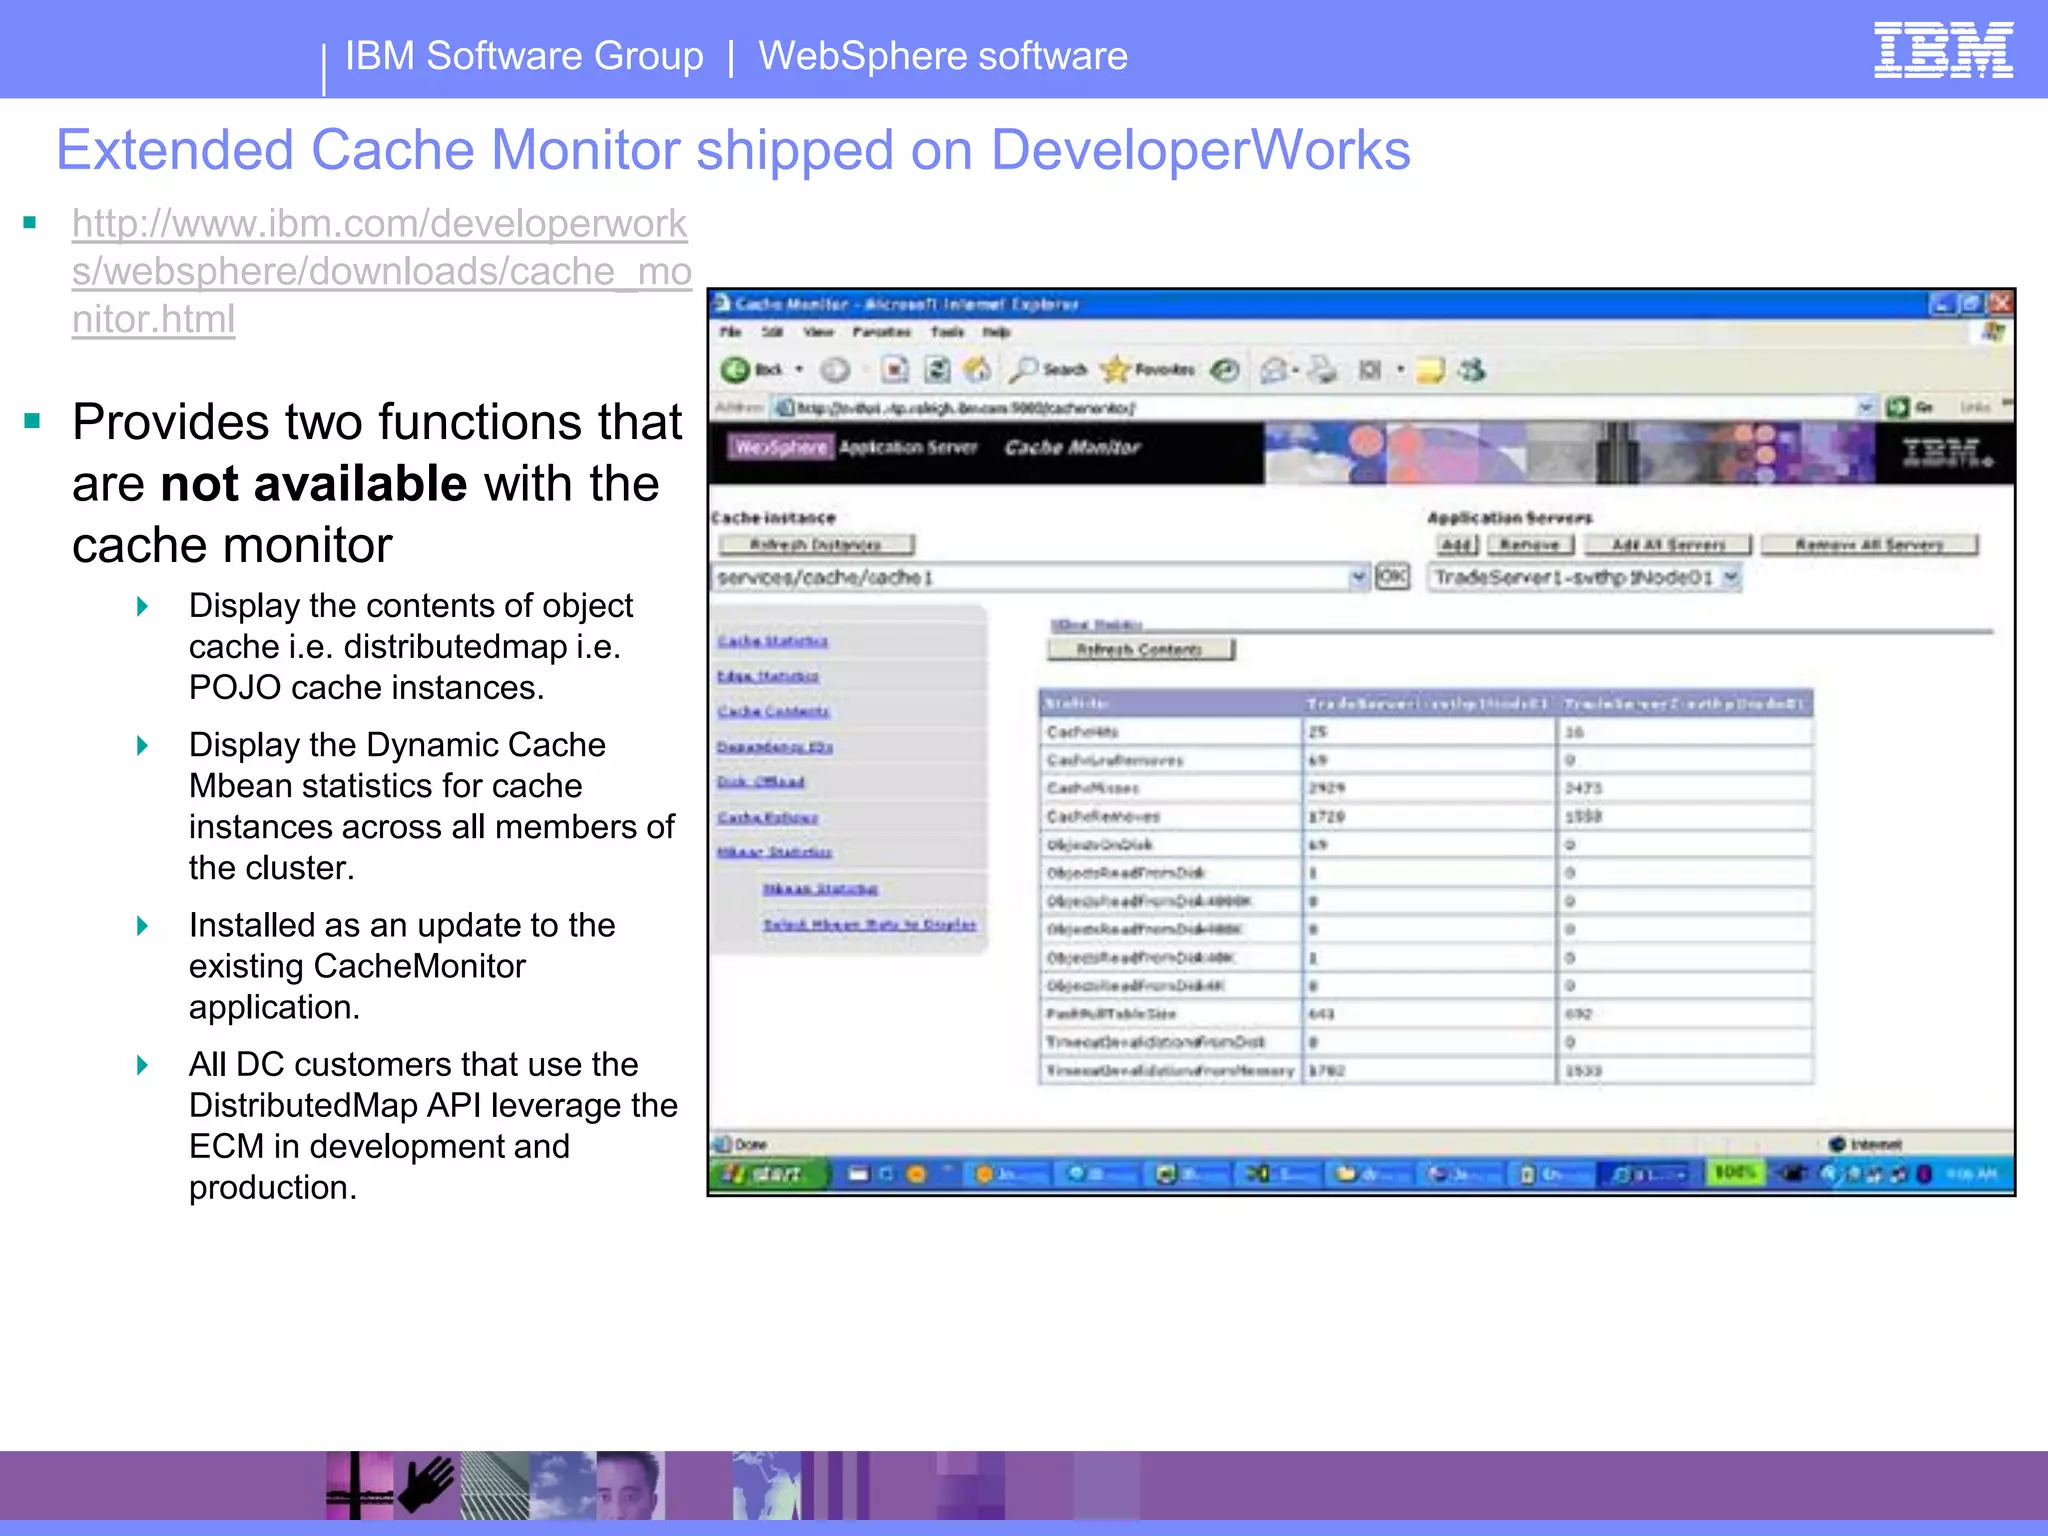
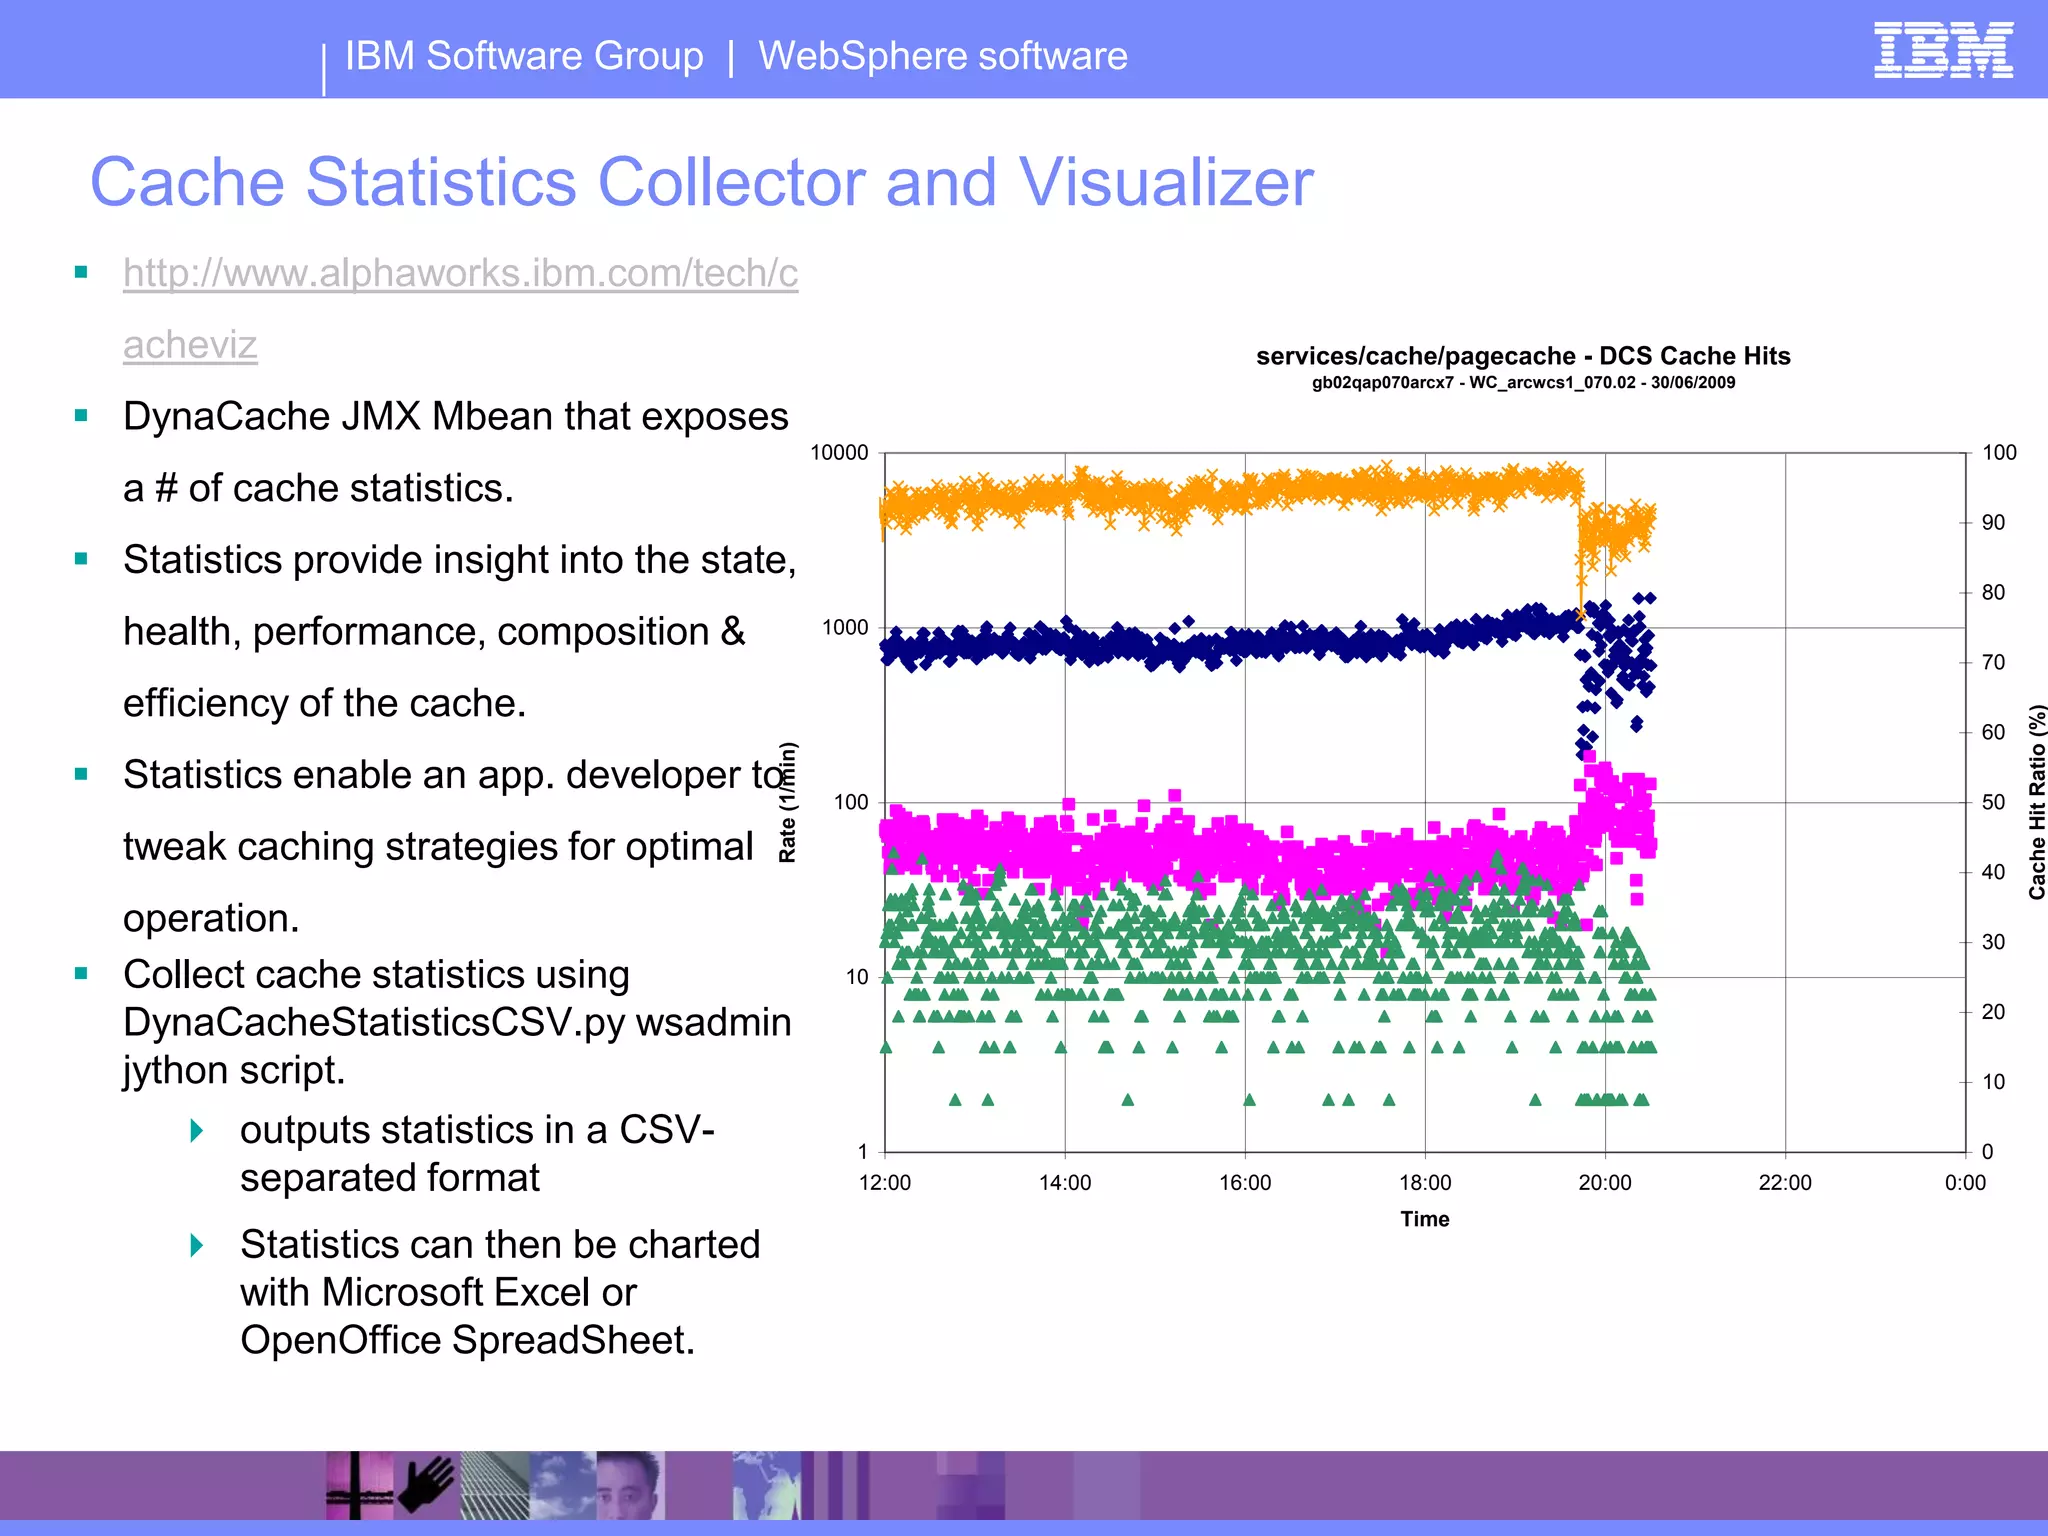
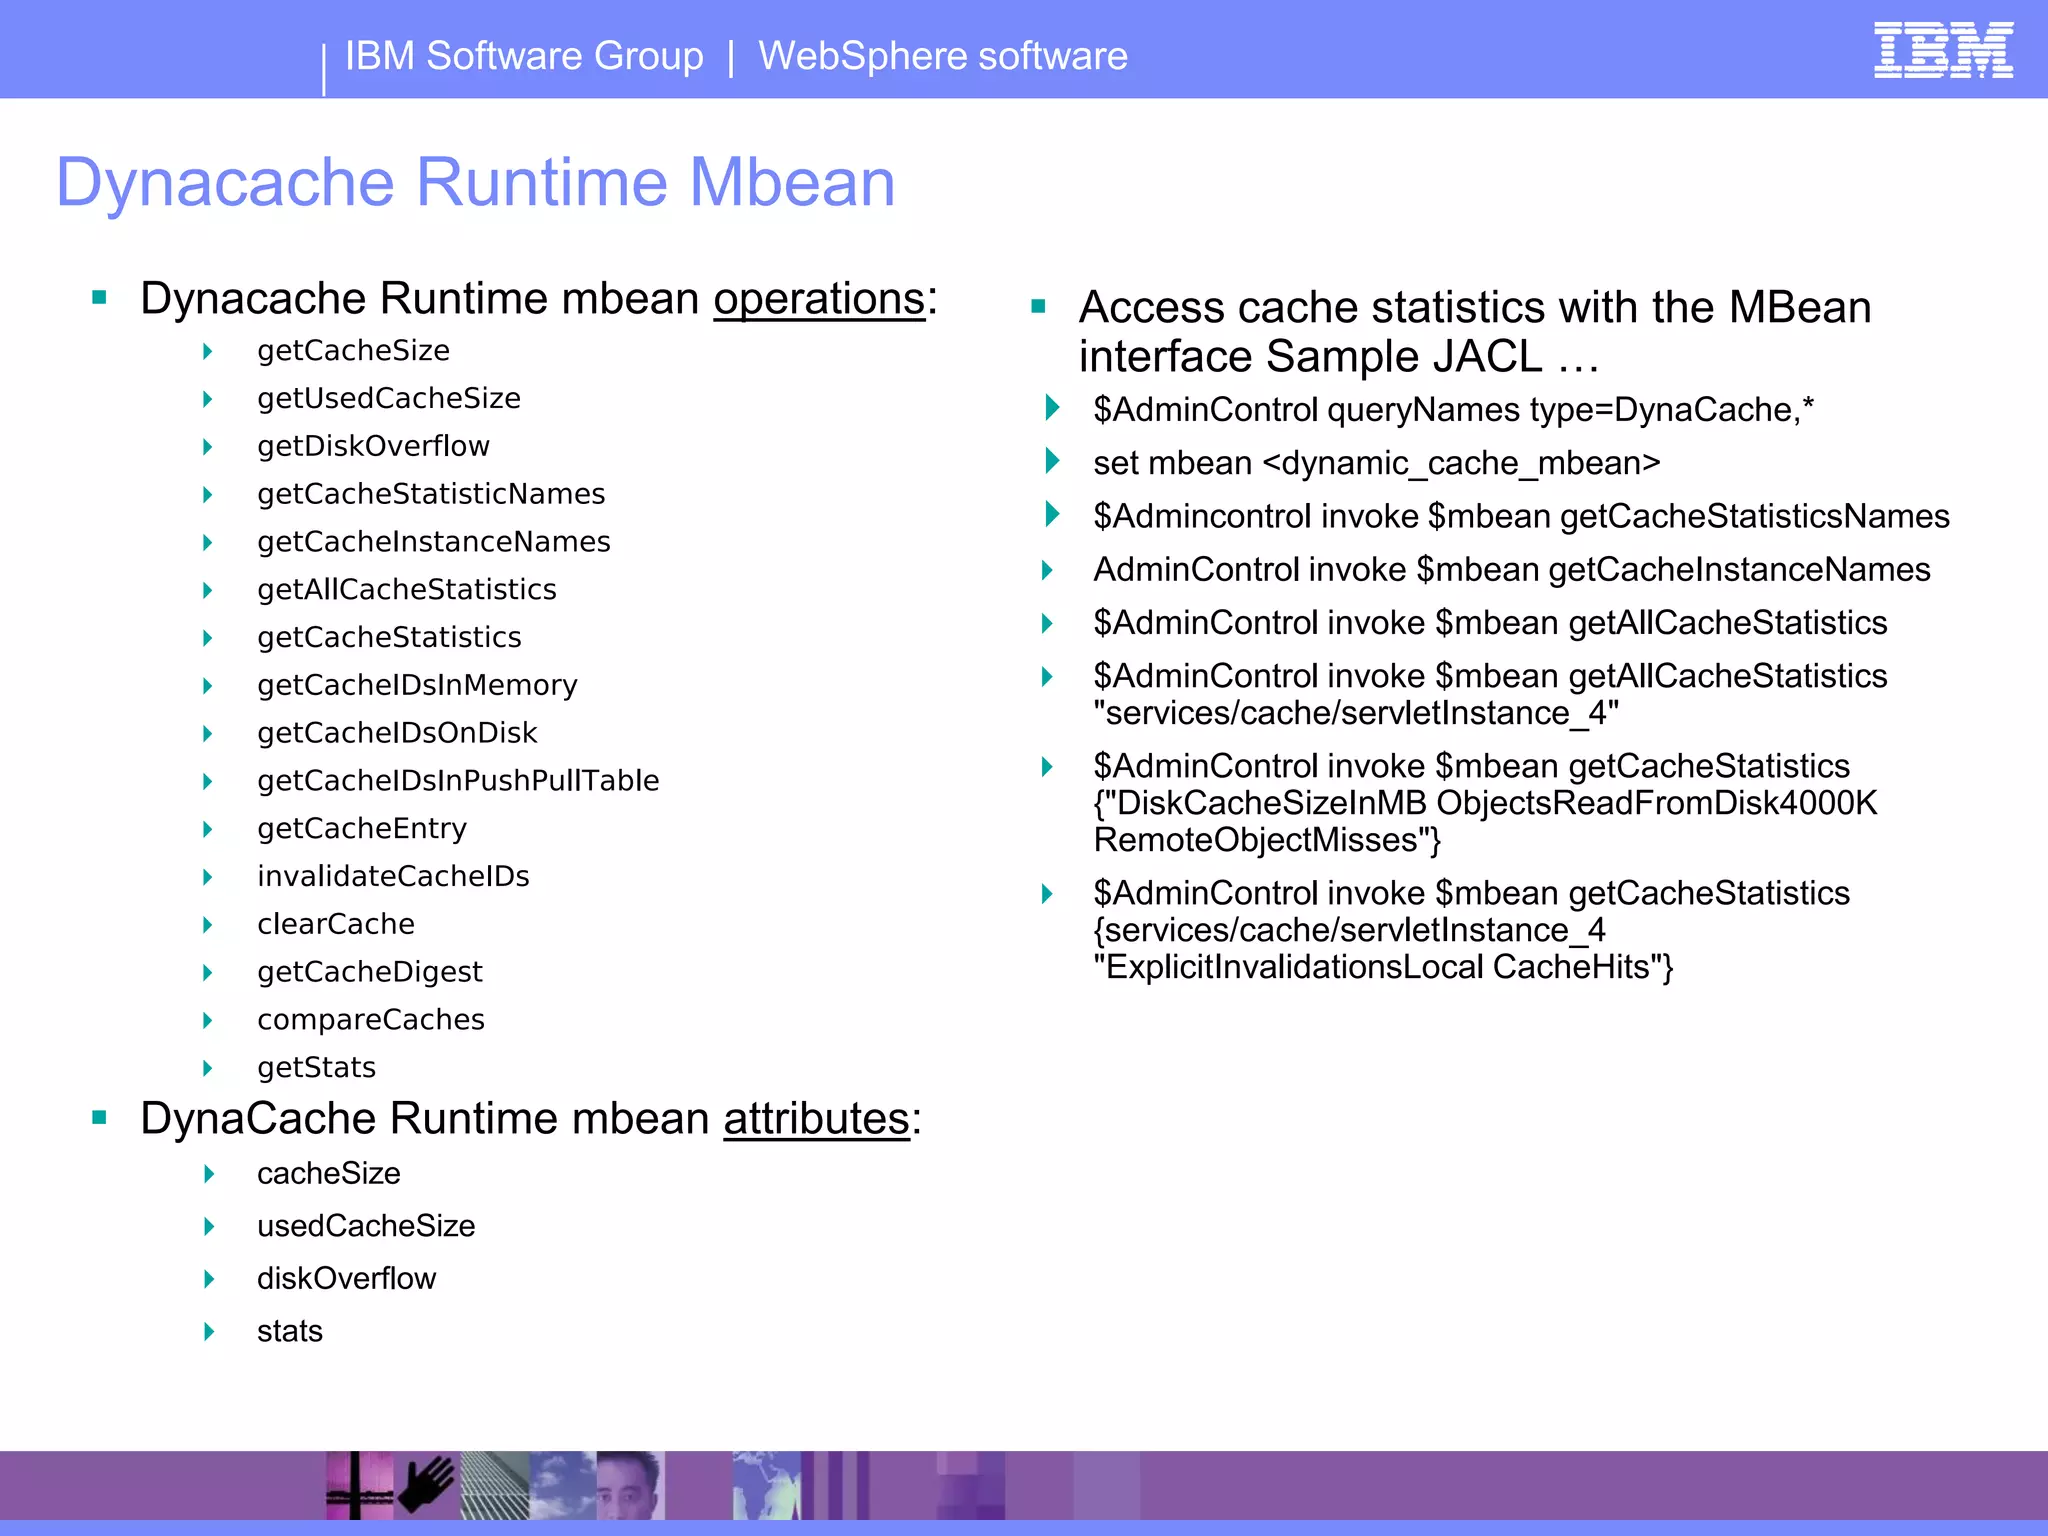
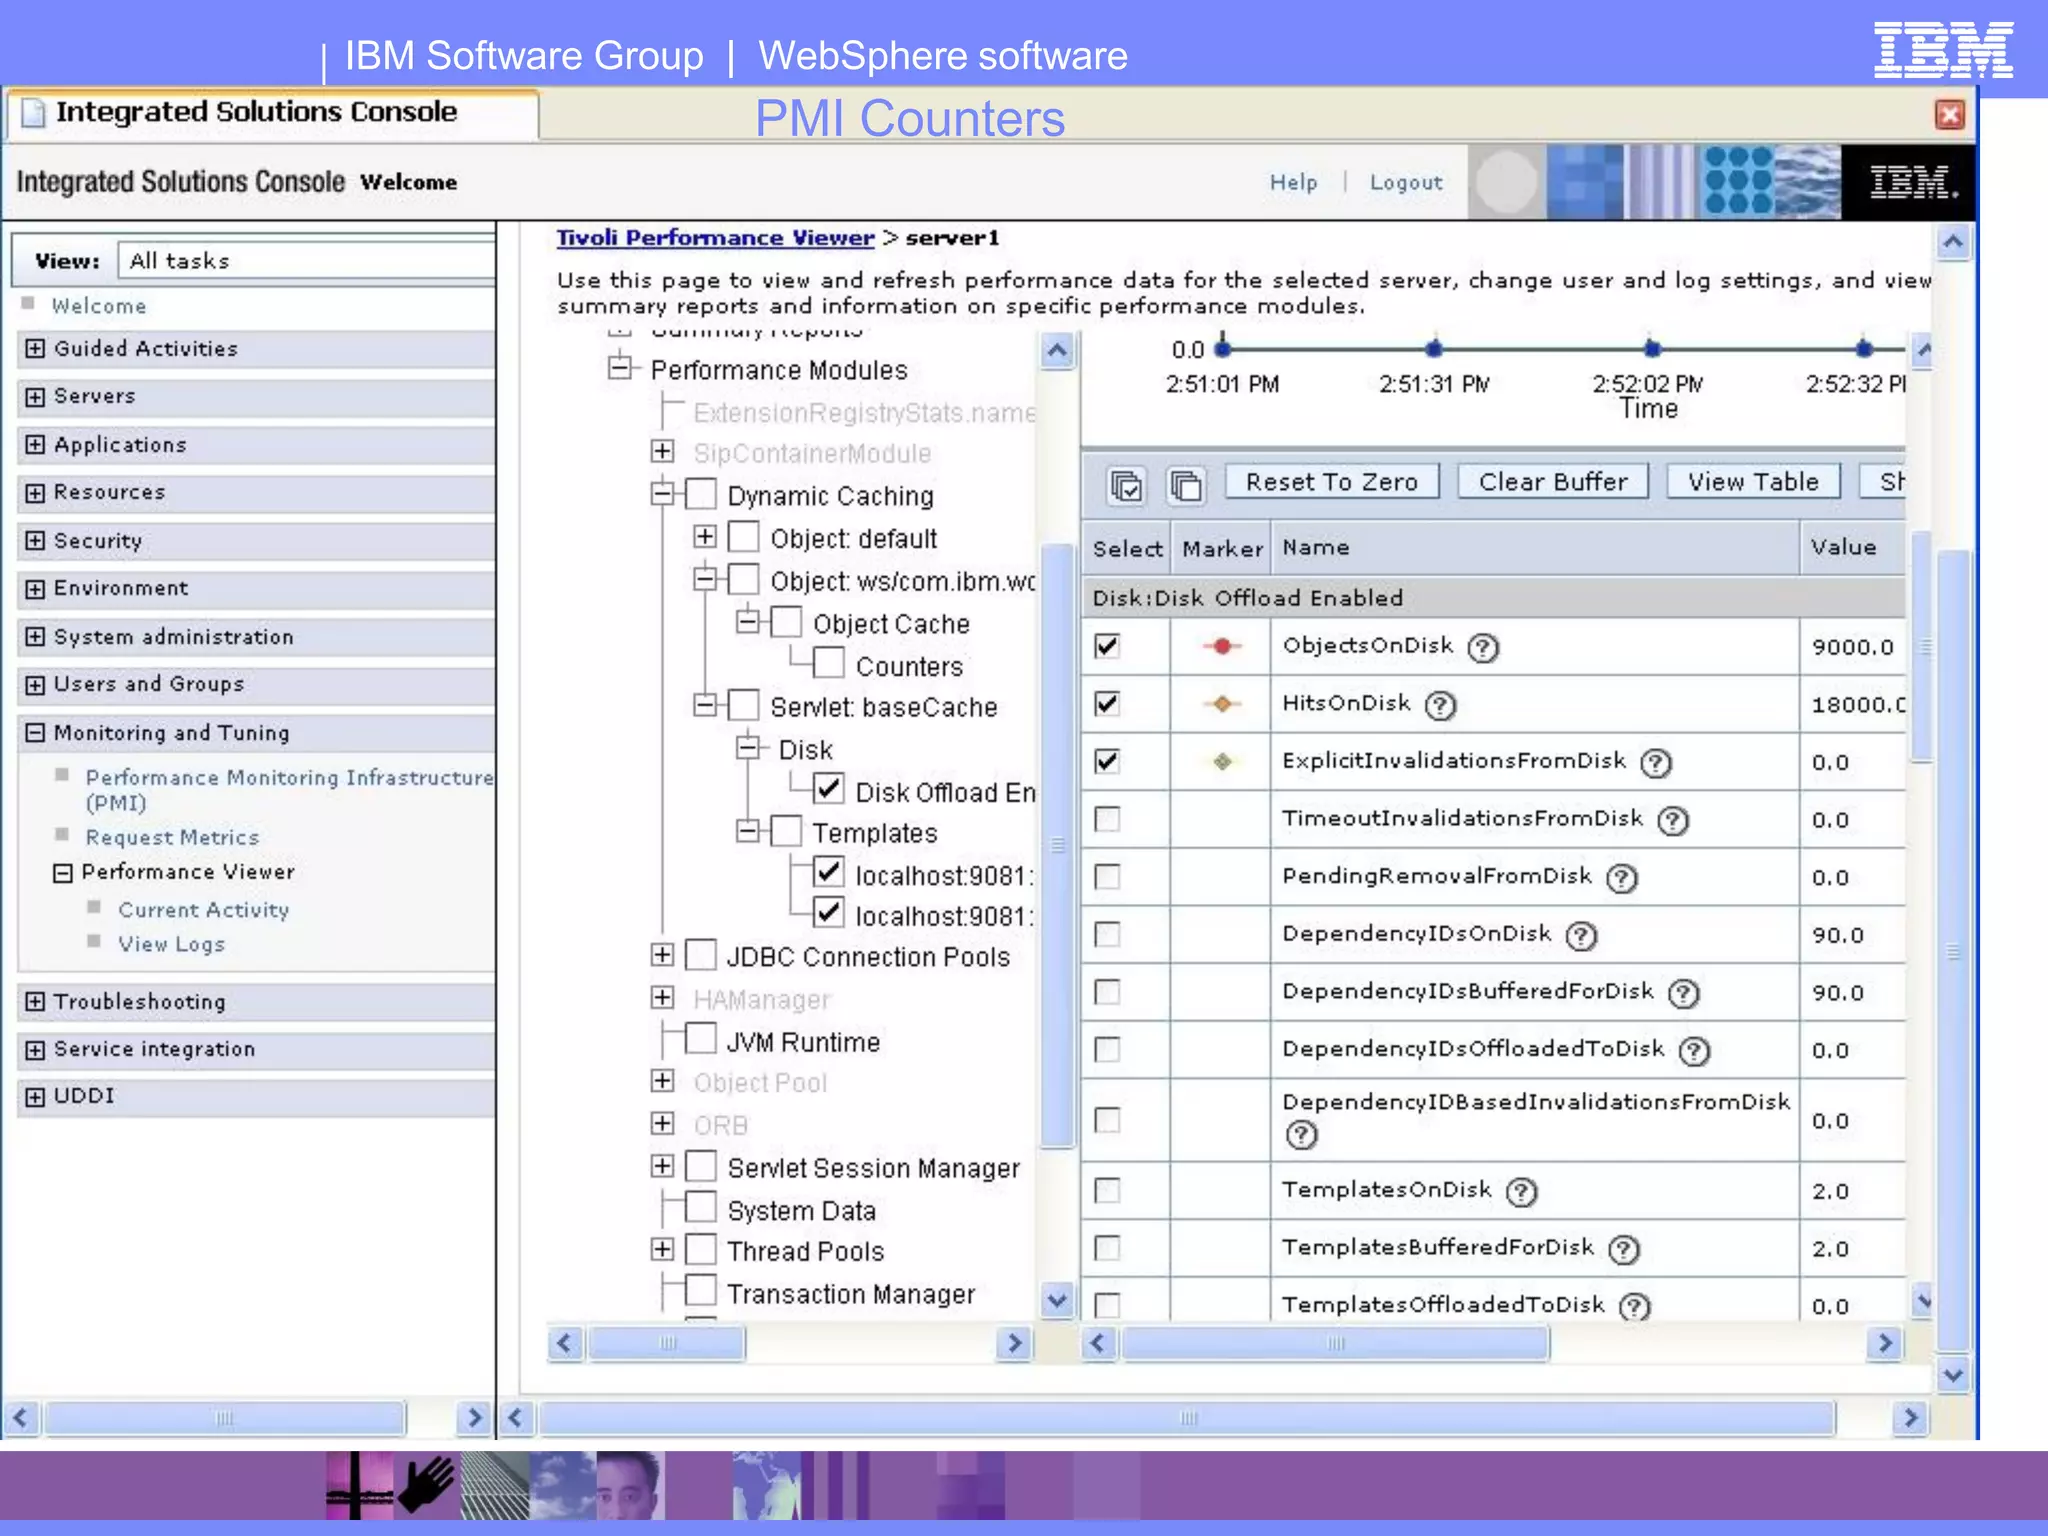
IBM Software Group | WebSphere software


Key Tools used for debugging Dynacache Issues
  Published
       Cache Monitor
       Extended Cache Monitor
       Cache Statistics Collector
       Dynacache Mbean
       PMI Counters
  Unpublished (Will be available on cattail soon)
       Cache Portlet Viewer
       Dynacache Probe to inspect the outcome of the caching action
       Script to parse out trace logs to determine the cacheability of a fragment
  Generic PD tools (available on the web)
       Eclipse Memory Analyzer Tool
       Heapdump Analyzer
       Thread and Monitor Dump Analyzer for Java
       PMAT & EVTK tools for verbose GC log analysis
IBM Software Group | WebSphere software

CacheMonitor Application
 Shipped with WAS install in the installableApps dir.
      Real-time view of the current state of dynamic cache (works with eXtreme Scale)
      Verify the configuration of dynamic cache
      Verify the cache policies
      Monitor cache statistics
      Monitor the data flowing through the cache (Only works for servlet caches)
      Monitor the data in the edge cache
      View the data offloaded to the disk
      Manage the data in the cache
IBM Software Group | WebSphere software

 Extended Cache Monitor shipped on DeveloperWorks
 http://www.ibm.com/developerwork
  s/websphere/downloads/cache_mo
  nitor.html

 Provides two functions that
  are not available with the
  cache monitor
      Display the contents of object
       cache i.e. distributedmap i.e.
       POJO cache instances.
      Display the Dynamic Cache
       Mbean statistics for cache
       instances across all members of
       the cluster.
      Installed as an update to the
       existing CacheMonitor
       application.
      All DC customers that use the
       DistributedMap API leverage the
       ECM in development and
       production.
IBM Software Group | WebSphere software


 Cache Statistics Collector and Visualizer
 http://www.alphaworks.ibm.com/tech/c
   acheviz                                                                      services/cache/pagecache - DCS Cache Hits
                                                                                     gb02qap070arcx7 - WC_arcwcs1_070.02 - 30/06/2009

 DynaCache JMX Mbean that exposes
                                                         10000                                                                                     100
   a # of cache statistics.
                                                                                                                                                   90

 Statistics provide insight into the state,
                                                                                                                                                   80

   health, performance, composition &                     1000
                                                                                                                                                   70

   efficiency of the cache.


                                                                                                                                                         Cache Hit Ratio (%)
                                                                                                                                                   60

 Statistics enable an app. developer to  Rate (1/min)
                                                           100                                                                                     50

   tweak caching strategies for optimal                                                                                                            40

  operation.                                                                                                                                       30
 Collect cache statistics using                            10
                                                                                                                                                   20
  DynaCacheStatisticsCSV.py wsadmin
  jython script.                                                                                                                                   10

       outputs statistics in a CSV-                         1                                                                                      0
         separated format                                    12:00   14:00   16:00            18:00                20:00                22:00   0:00
                                                                                               Time
       Statistics can then be charted
        with Microsoft Excel or
        OpenOffice SpreadSheet.
IBM Software Group | WebSphere software


Dynacache Runtime Mbean
 Dynacache Runtime mbean operations:             Access cache statistics with the MBean
       getCacheSize                               interface Sample JACL …
       getUsedCacheSize                          $AdminControl queryNames type=DynaCache,*
       getDiskOverflow
                                                  set mbean <dynamic_cache_mbean>
       getCacheStatisticNames
                                                  $Admincontrol invoke $mbean getCacheStatisticsNames
       getCacheInstanceNames
                                                   AdminControl invoke $mbean getCacheInstanceNames
       getAllCacheStatistics
       getCacheStatistics                         $AdminControl invoke $mbean getAllCacheStatistics
       getCacheIDsInMemory                        $AdminControl invoke $mbean getAllCacheStatistics
                                                    "services/cache/servletInstance_4"
       getCacheIDsOnDisk
       getCacheIDsInPushPullTable                 $AdminControl invoke $mbean getCacheStatistics
                                                    {"DiskCacheSizeInMB ObjectsReadFromDisk4000K
       getCacheEntry                               RemoteObjectMisses"}
       invalidateCacheIDs
                                                   $AdminControl invoke $mbean getCacheStatistics
       clearCache                                  {services/cache/servletInstance_4
       getCacheDigest                              "ExplicitInvalidationsLocal CacheHits"}
       compareCaches
       getStats
 DynaCache Runtime mbean attributes:
       cacheSize
       usedCacheSize
       diskOverflow
       stats
IBM Software Group | WebSphere software
                    PMI Counters

Cache Tooling

  • 1.
    IBM Software Group| WebSphere software Key Tools used for debugging Dynacache Issues  Published  Cache Monitor  Extended Cache Monitor  Cache Statistics Collector  Dynacache Mbean  PMI Counters  Unpublished (Will be available on cattail soon)  Cache Portlet Viewer  Dynacache Probe to inspect the outcome of the caching action  Script to parse out trace logs to determine the cacheability of a fragment  Generic PD tools (available on the web)  Eclipse Memory Analyzer Tool  Heapdump Analyzer  Thread and Monitor Dump Analyzer for Java  PMAT & EVTK tools for verbose GC log analysis
  • 2.
    IBM Software Group| WebSphere software CacheMonitor Application  Shipped with WAS install in the installableApps dir.  Real-time view of the current state of dynamic cache (works with eXtreme Scale)  Verify the configuration of dynamic cache  Verify the cache policies  Monitor cache statistics  Monitor the data flowing through the cache (Only works for servlet caches)  Monitor the data in the edge cache  View the data offloaded to the disk  Manage the data in the cache
  • 3.
    IBM Software Group| WebSphere software Extended Cache Monitor shipped on DeveloperWorks  http://www.ibm.com/developerwork s/websphere/downloads/cache_mo nitor.html  Provides two functions that are not available with the cache monitor  Display the contents of object cache i.e. distributedmap i.e. POJO cache instances.  Display the Dynamic Cache Mbean statistics for cache instances across all members of the cluster.  Installed as an update to the existing CacheMonitor application.  All DC customers that use the DistributedMap API leverage the ECM in development and production.
  • 4.
    IBM Software Group| WebSphere software Cache Statistics Collector and Visualizer  http://www.alphaworks.ibm.com/tech/c acheviz services/cache/pagecache - DCS Cache Hits gb02qap070arcx7 - WC_arcwcs1_070.02 - 30/06/2009  DynaCache JMX Mbean that exposes 10000 100 a # of cache statistics. 90  Statistics provide insight into the state, 80 health, performance, composition & 1000 70 efficiency of the cache. Cache Hit Ratio (%) 60  Statistics enable an app. developer to Rate (1/min) 100 50 tweak caching strategies for optimal 40 operation. 30  Collect cache statistics using 10 20 DynaCacheStatisticsCSV.py wsadmin jython script. 10  outputs statistics in a CSV- 1 0 separated format 12:00 14:00 16:00 18:00 20:00 22:00 0:00 Time  Statistics can then be charted with Microsoft Excel or OpenOffice SpreadSheet.
  • 5.
    IBM Software Group| WebSphere software Dynacache Runtime Mbean  Dynacache Runtime mbean operations:  Access cache statistics with the MBean  getCacheSize interface Sample JACL …  getUsedCacheSize  $AdminControl queryNames type=DynaCache,*  getDiskOverflow  set mbean <dynamic_cache_mbean>  getCacheStatisticNames  $Admincontrol invoke $mbean getCacheStatisticsNames  getCacheInstanceNames  AdminControl invoke $mbean getCacheInstanceNames  getAllCacheStatistics  getCacheStatistics  $AdminControl invoke $mbean getAllCacheStatistics  getCacheIDsInMemory  $AdminControl invoke $mbean getAllCacheStatistics "services/cache/servletInstance_4"  getCacheIDsOnDisk  getCacheIDsInPushPullTable  $AdminControl invoke $mbean getCacheStatistics {"DiskCacheSizeInMB ObjectsReadFromDisk4000K  getCacheEntry RemoteObjectMisses"}  invalidateCacheIDs  $AdminControl invoke $mbean getCacheStatistics  clearCache {services/cache/servletInstance_4  getCacheDigest "ExplicitInvalidationsLocal CacheHits"}  compareCaches  getStats  DynaCache Runtime mbean attributes:  cacheSize  usedCacheSize  diskOverflow  stats
  • 6.
    IBM Software Group| WebSphere software PMI Counters