Downloaded 220 times


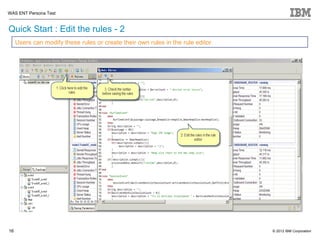
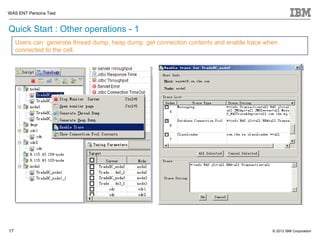
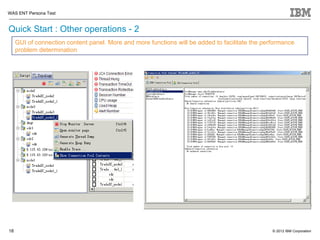
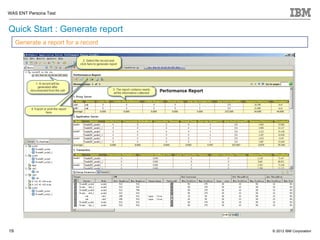
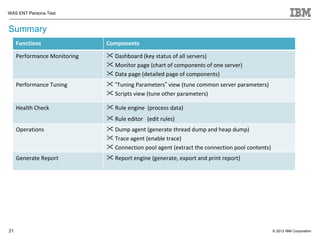

The WebSphere Application Server Performance Tuning Toolkit provides a three-pronged approach to performance monitoring and tuning: it monitors servers for errors and potential problems, accelerates performance tuning by centralizing monitoring and tuning scripts, and facilitates problem determination through features like thread dumps, heap dumps, and runtime tracing. The toolkit offers a friendly UI and requires no additional installation or configuration. It provides reports to analyze monitoring data both online and offline.