Downloaded 346 times
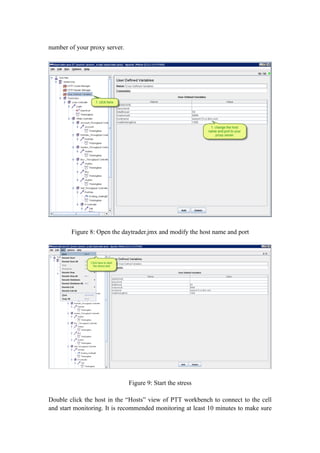
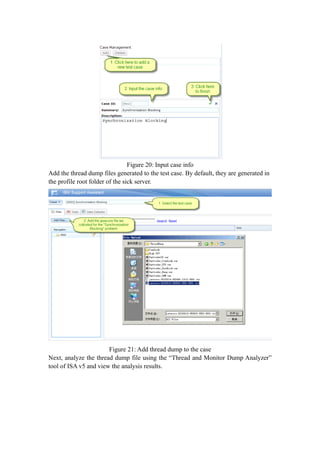
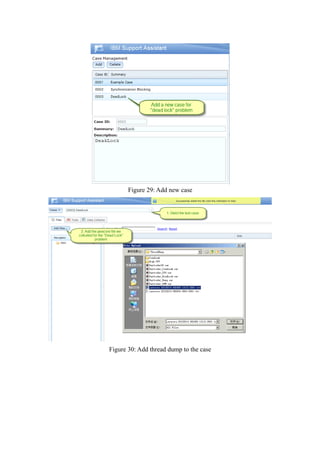
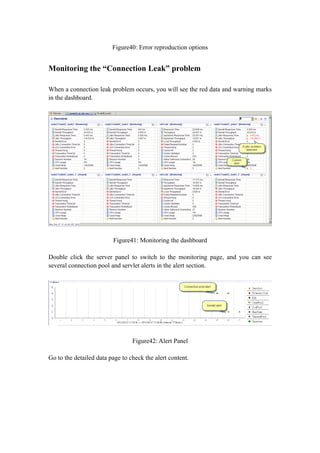
![Figure39: Alert detailed content
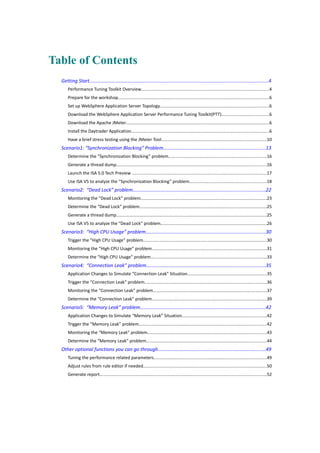
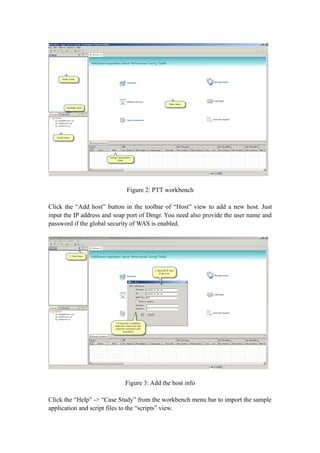
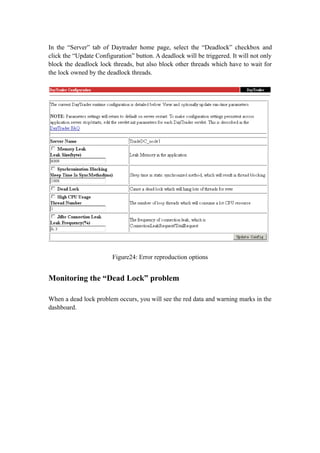
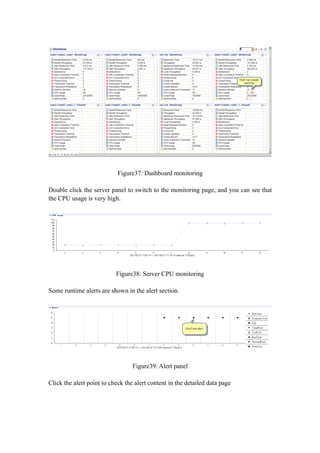
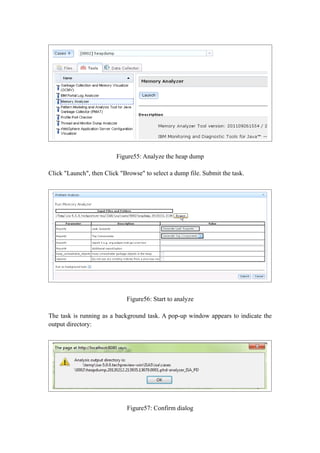
Determine the “High CPU Usage” problem
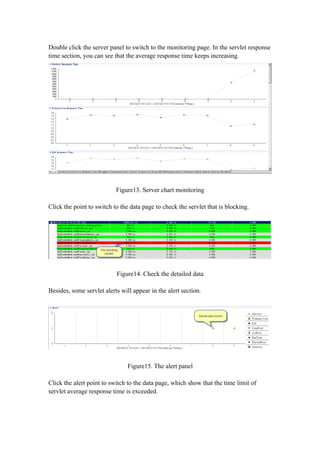
In order to determine the High CPU Usage problem, we need to collect the CPU
usage info from the command line. But the command differs from OS to OS; here we
will take the Linux for example. Change the node name and server name of the sick
server and run the shell file with the following content and content.
node="node1"
server="TradeDC_node1"
echo Start get cpuInof on `date` >> cpuInfo.txt
echo
===================================================================
================================= >> cpuInfo.txt
pid=`ps -ef |grep java | grep com.ibm.ws.runtime.WsServer | grep -w "$node $server" |
awk '{print $2}'`
echo "$pid" >> cpuInfo.txt
if [ -n "$pid" ]
then](https://image.slidesharecdn.com/websphereapplicationserverperformancetuningworkshop-120402145009-phpapp02/85/Web-sphere-application-server-performance-tuning-workshop-33-320.jpg)
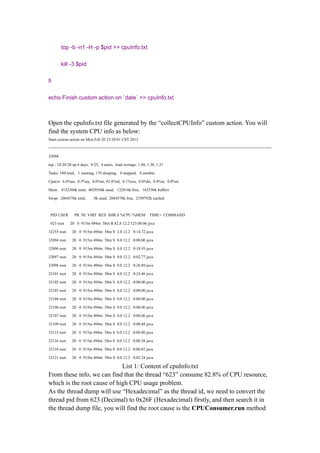
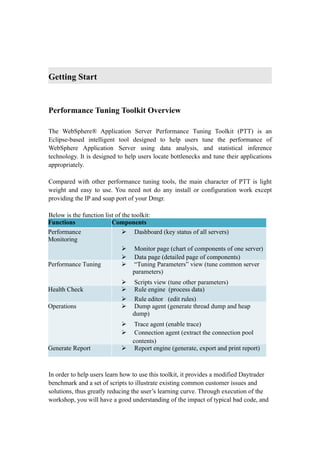
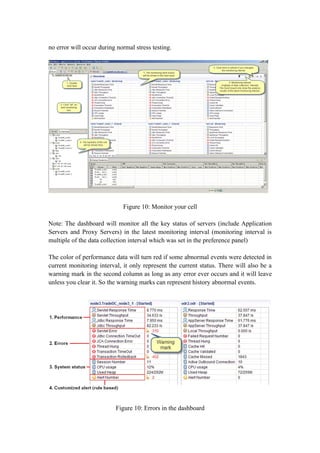
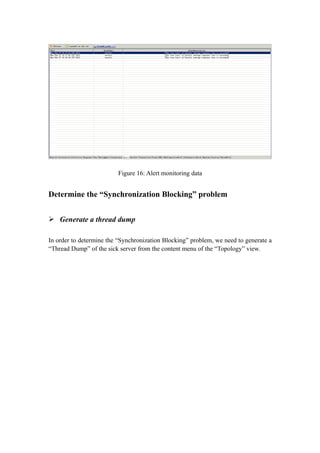
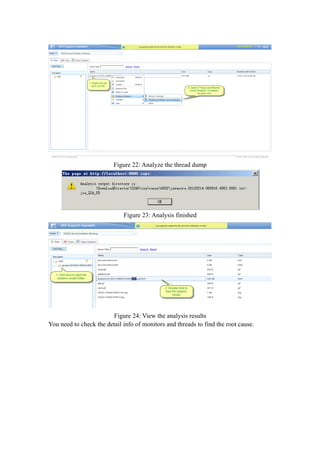
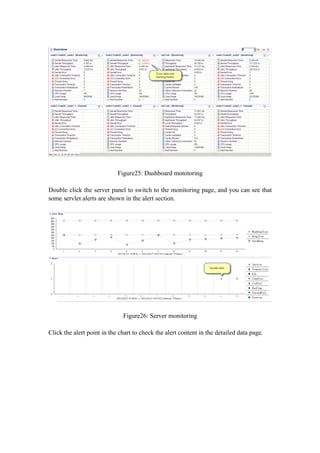
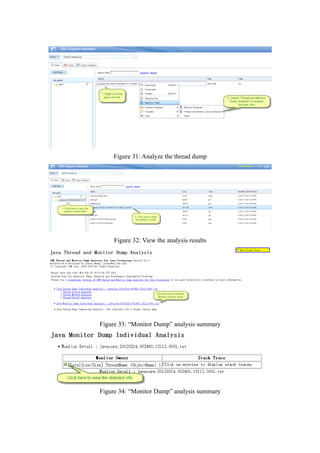
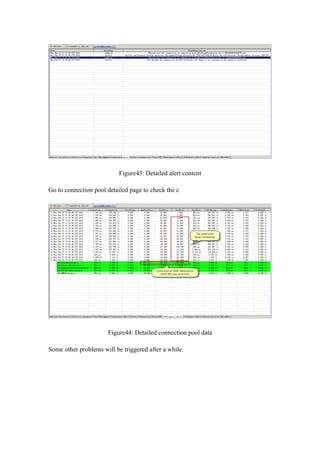
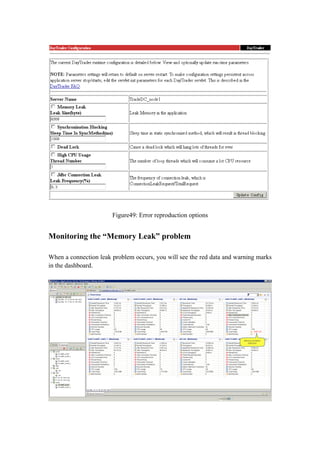
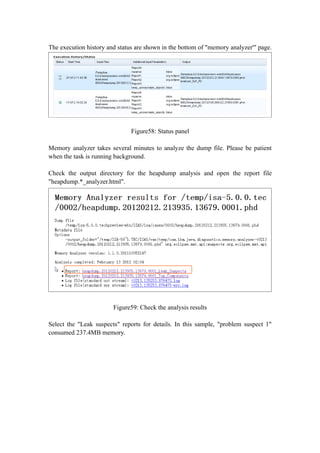
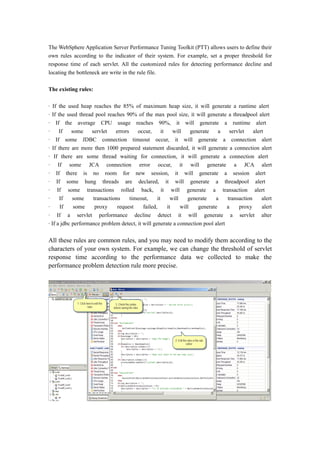
![in TradeAppServlet. Below is the stack trace:
3XMTHREADINFO "Thread-95" J9VMThread:0x0C0EFE00, j9thread_t:0x8D15AFA8, java/lang/Thread:0x9B2C2FC0, state:CW,
prio=5
3XMTHREADINFO1 (native thread ID:0x26F, native priority:0x5, native policy:UNKNOWN)
3XMTHREADINFO2 (native stack address range from:0x02B87000, to:0x02BC8000, size:0x41000)
3XMTHREADINFO3 Java callstack:
4XESTACKTRACE at
org/apache/geronimo/samples/daytrader/web/TradeAppServlet$CPUConsumer.run(TradeAppServlet.java:120)
3XMTHREADINFO3 Native callstack:
4XENATIVESTACK (0x00CA1752 [libj9prt24.so+0xb752])
4XENATIVESTACK (0x00CACF60 [libj9prt24.so+0x16f60])
4XENATIVESTACK (0x00CA17E5 [libj9prt24.so+0xb7e5])
4XENATIVESTACK (0x00CA1908 [libj9prt24.so+0xb908])
4XENATIVESTACK (0x00CA1584 [libj9prt24.so+0xb584])
4XENATIVESTACK (0x00CACF60 [libj9prt24.so+0x16f60])
4XENATIVESTACK (0x00CA15F8 [libj9prt24.so+0xb5f8])
4XENATIVESTACK (0x00C9D500 [libj9prt24.so+0x7500])
4XENATIVESTACK (0x0099740C)
List 2: Content of thread dump
From the content of cpuInfo.txt and the thread dumps, we can find the threads
consuming lots of CPU resources and their stack trace, so we will be able to fix the
problem accordingly.
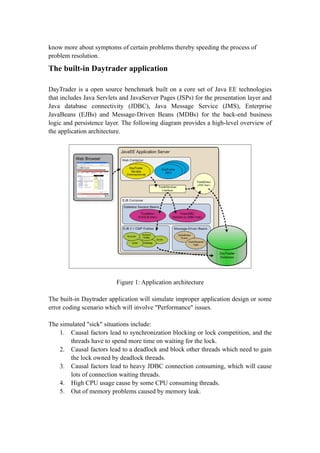
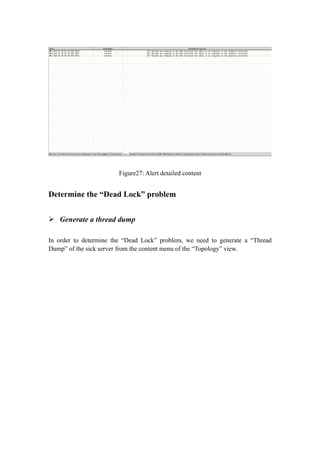
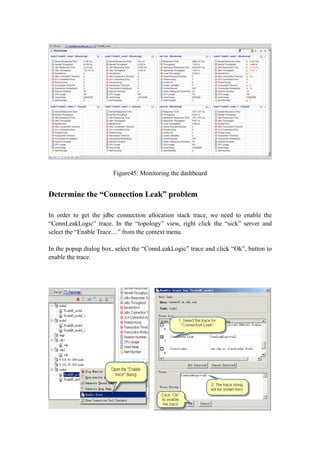
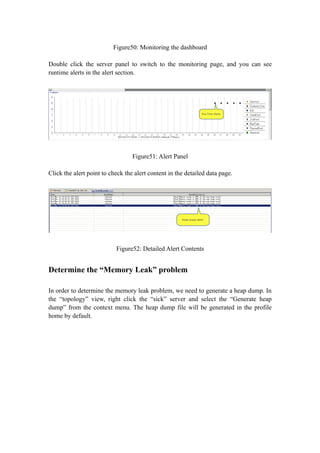
Scenario4: “Connection Leak” problem
Application Changes to Simulate “Connection Leak” Situation
In this scenario, some requests will invoke a ConnectionConsumer thread in which it
will get a connection from the connection pool and never close it. You can adjust the
“Leak Frequency” to control the leak rate.
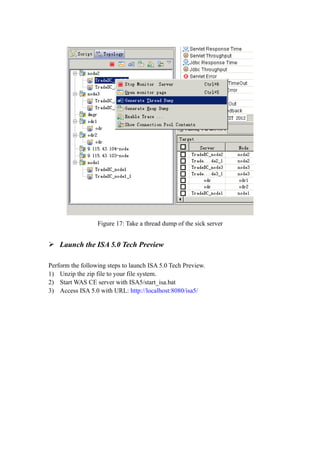
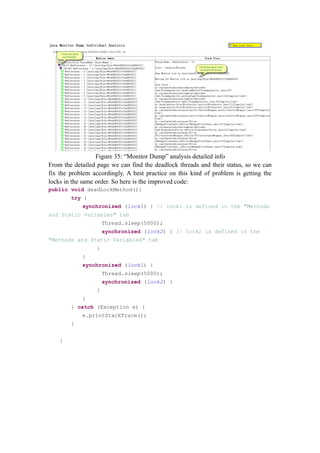
Code changes in the TradeAppServlet
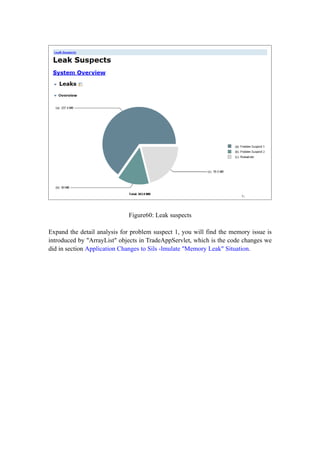
//For Connection Consuming
if(TradeConfig.isConnectionLeak()){
if(triggerByFrequency(TradeConfig.getLeakFrequency())){
ConnectionConsumer cc = new ConnectionConsumer();
cc.start();
}](https://image.slidesharecdn.com/websphereapplicationserverperformancetuningworkshop-120402145009-phpapp02/85/Web-sphere-application-server-performance-tuning-workshop-35-320.jpg)
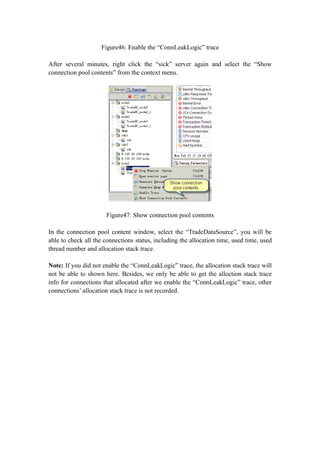
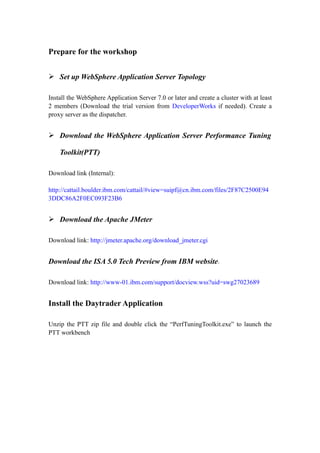
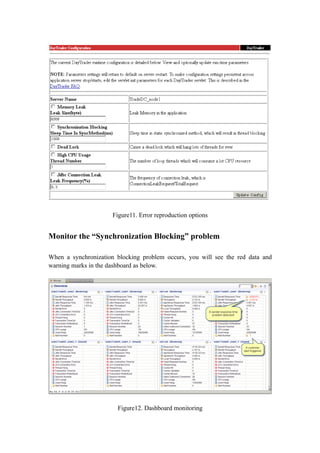
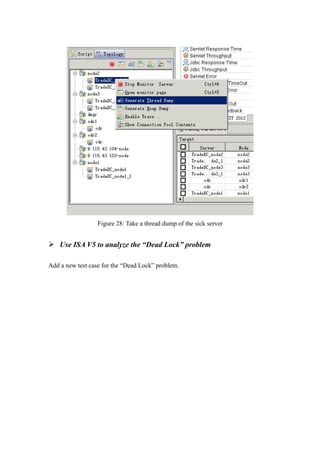
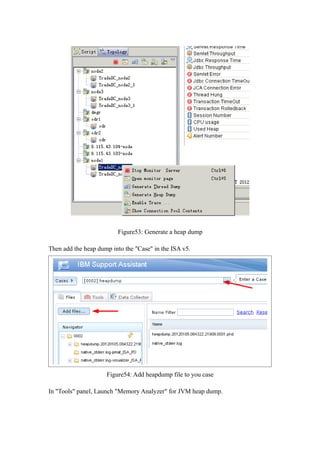
![Scenario5: “Memory Leak” problem
Application Changes to Simulate “Memory Leak” Situation
In this scenario, some requests will put some byte[] to the static ArrayList which will
never be released. You can adjust the “Leak Size” to control the leak rate.
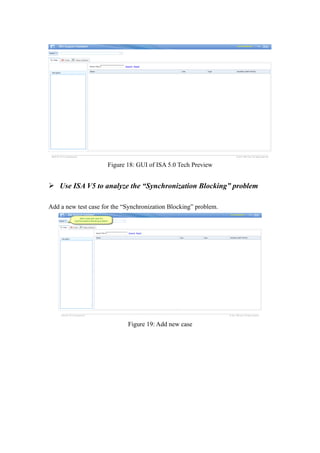
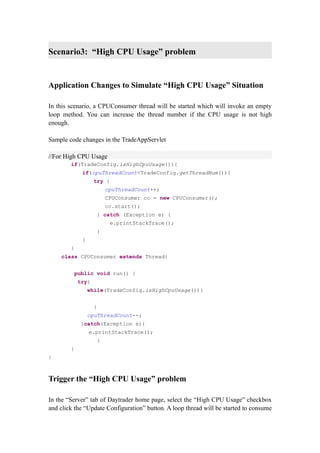
Code changes in the TradeAppServlet
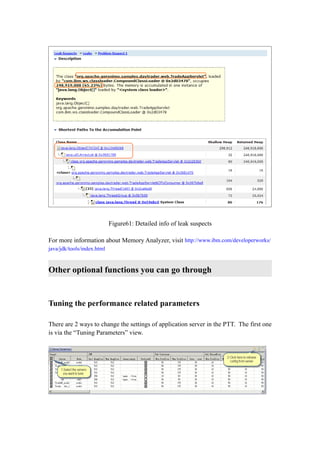
//For Memory Leak
public static ArrayList leakContainer = new ArrayList();
if(TradeConfig.isMemeoryLeak()){
leakContainer.add(new byte[TradeConfig.getLeakSize()]);
}
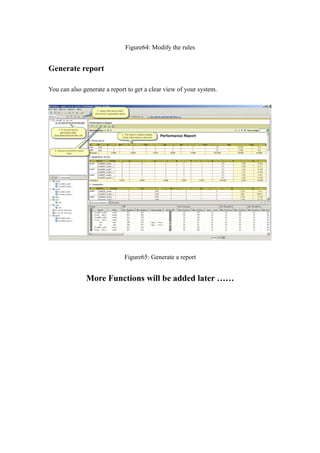
Trigger the “Memory Leak” problem
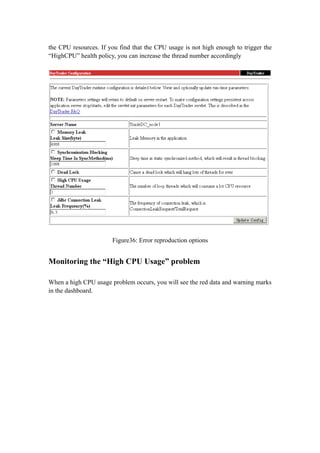
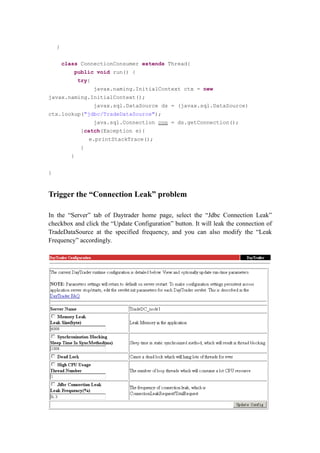
In the “Server” tab of Daytrader home page, select the “Memory Leak” checkbox and
click the “Update Configuration” button. It will leak the heap memory at the specified
rate.](https://image.slidesharecdn.com/websphereapplicationserverperformancetuningworkshop-120402145009-phpapp02/85/Web-sphere-application-server-performance-tuning-workshop-42-320.jpg)

The document describes a workshop on using the WebSphere Application Server Performance Tuning Toolkit (PTT) to analyze performance issues in the Daytrader application. It includes instructions on setting up the environment, installing Daytrader, and walking through 5 scenarios that simulate different types of performance problems: synchronization blocking, deadlock, high CPU usage, connection leak, and memory leak. For each scenario, it describes how to trigger the problem, monitor it using the PTT, and analyze the issue using thread dumps and the ISA V5 tool. The goal is to help users understand common performance issues and how to diagnose them.