Downloaded 111 times
![Out Of Memory Errors ?JVM Heap sized incorrectlyGC adapts heap size to keep occupancy [40, 70]%Determine heap occupancy of the app. under loadXmx = 43% larger than max. occupancy of app.For 700MB occupancy , 1000MB Max. heap is reqd. (700 +43% of 700)Analyze heapdumps & system dumps with tools like Eclipse Memory AnalyzerLack of Java heap or Native heapEclipse Memory Analyzer and IBM extensions Finding which methods allocated large objectsPrints stacktrace for all objects above 1KEnable Java Heap and Native heap monitoring JMX and metrics output by JVMClassloader exhaustion25October 4, 2011](https://image.slidesharecdn.com/debuggingjavadeployments2-111005134828-phpapp02/75/Debugging-java-deployments_2-25-2048.jpg)
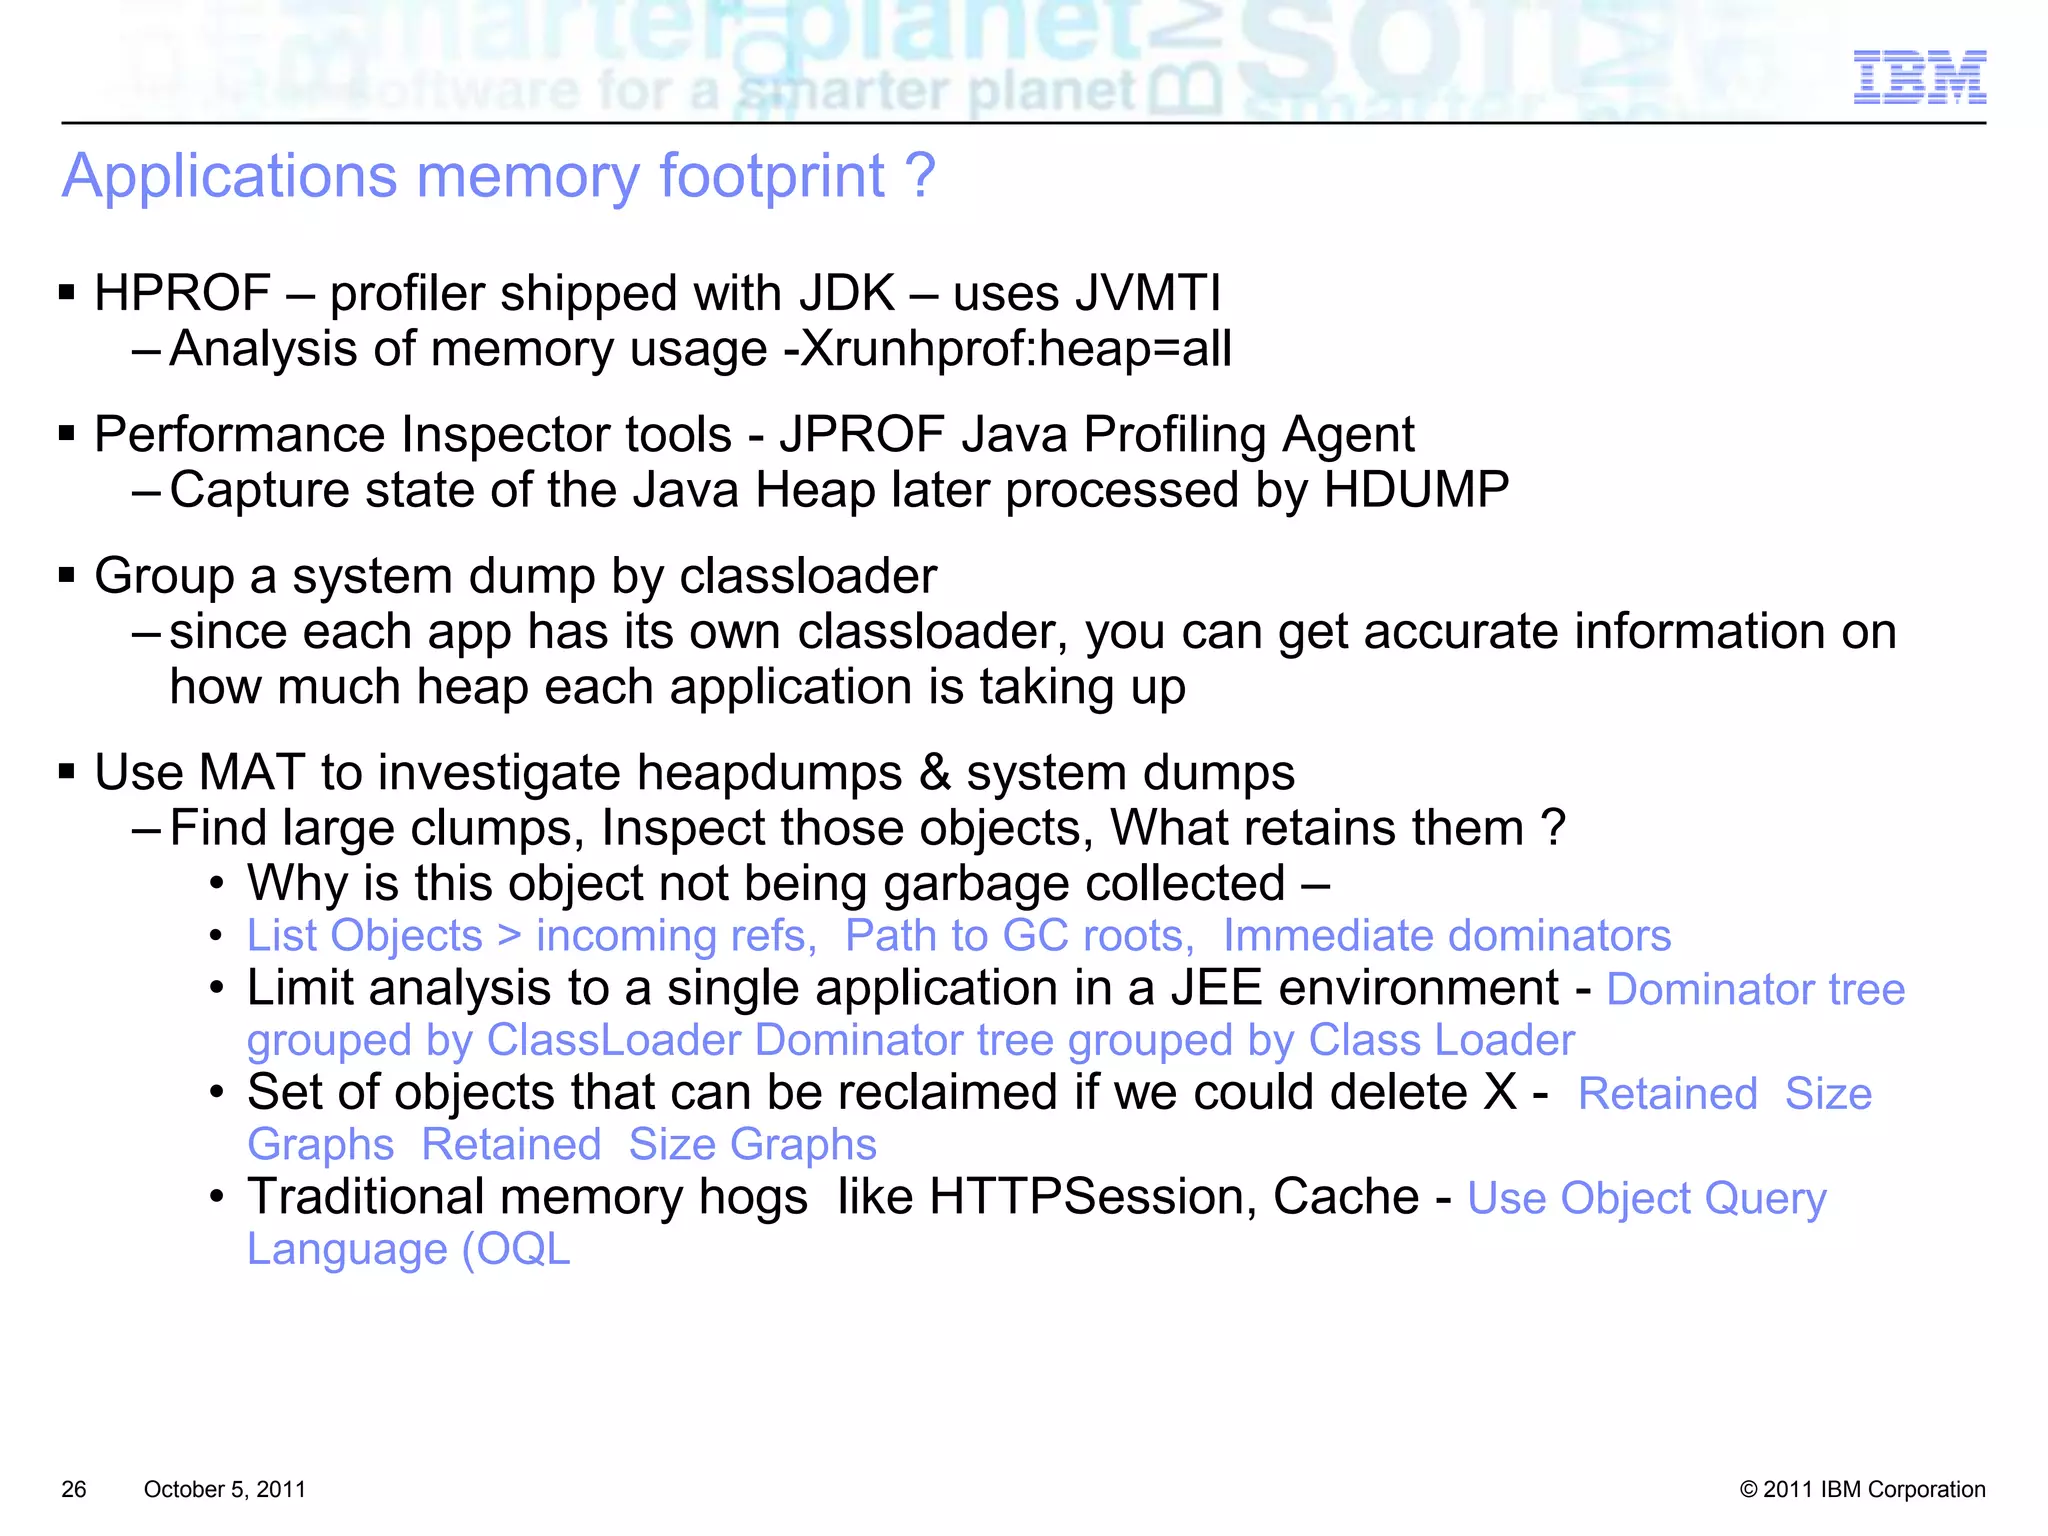
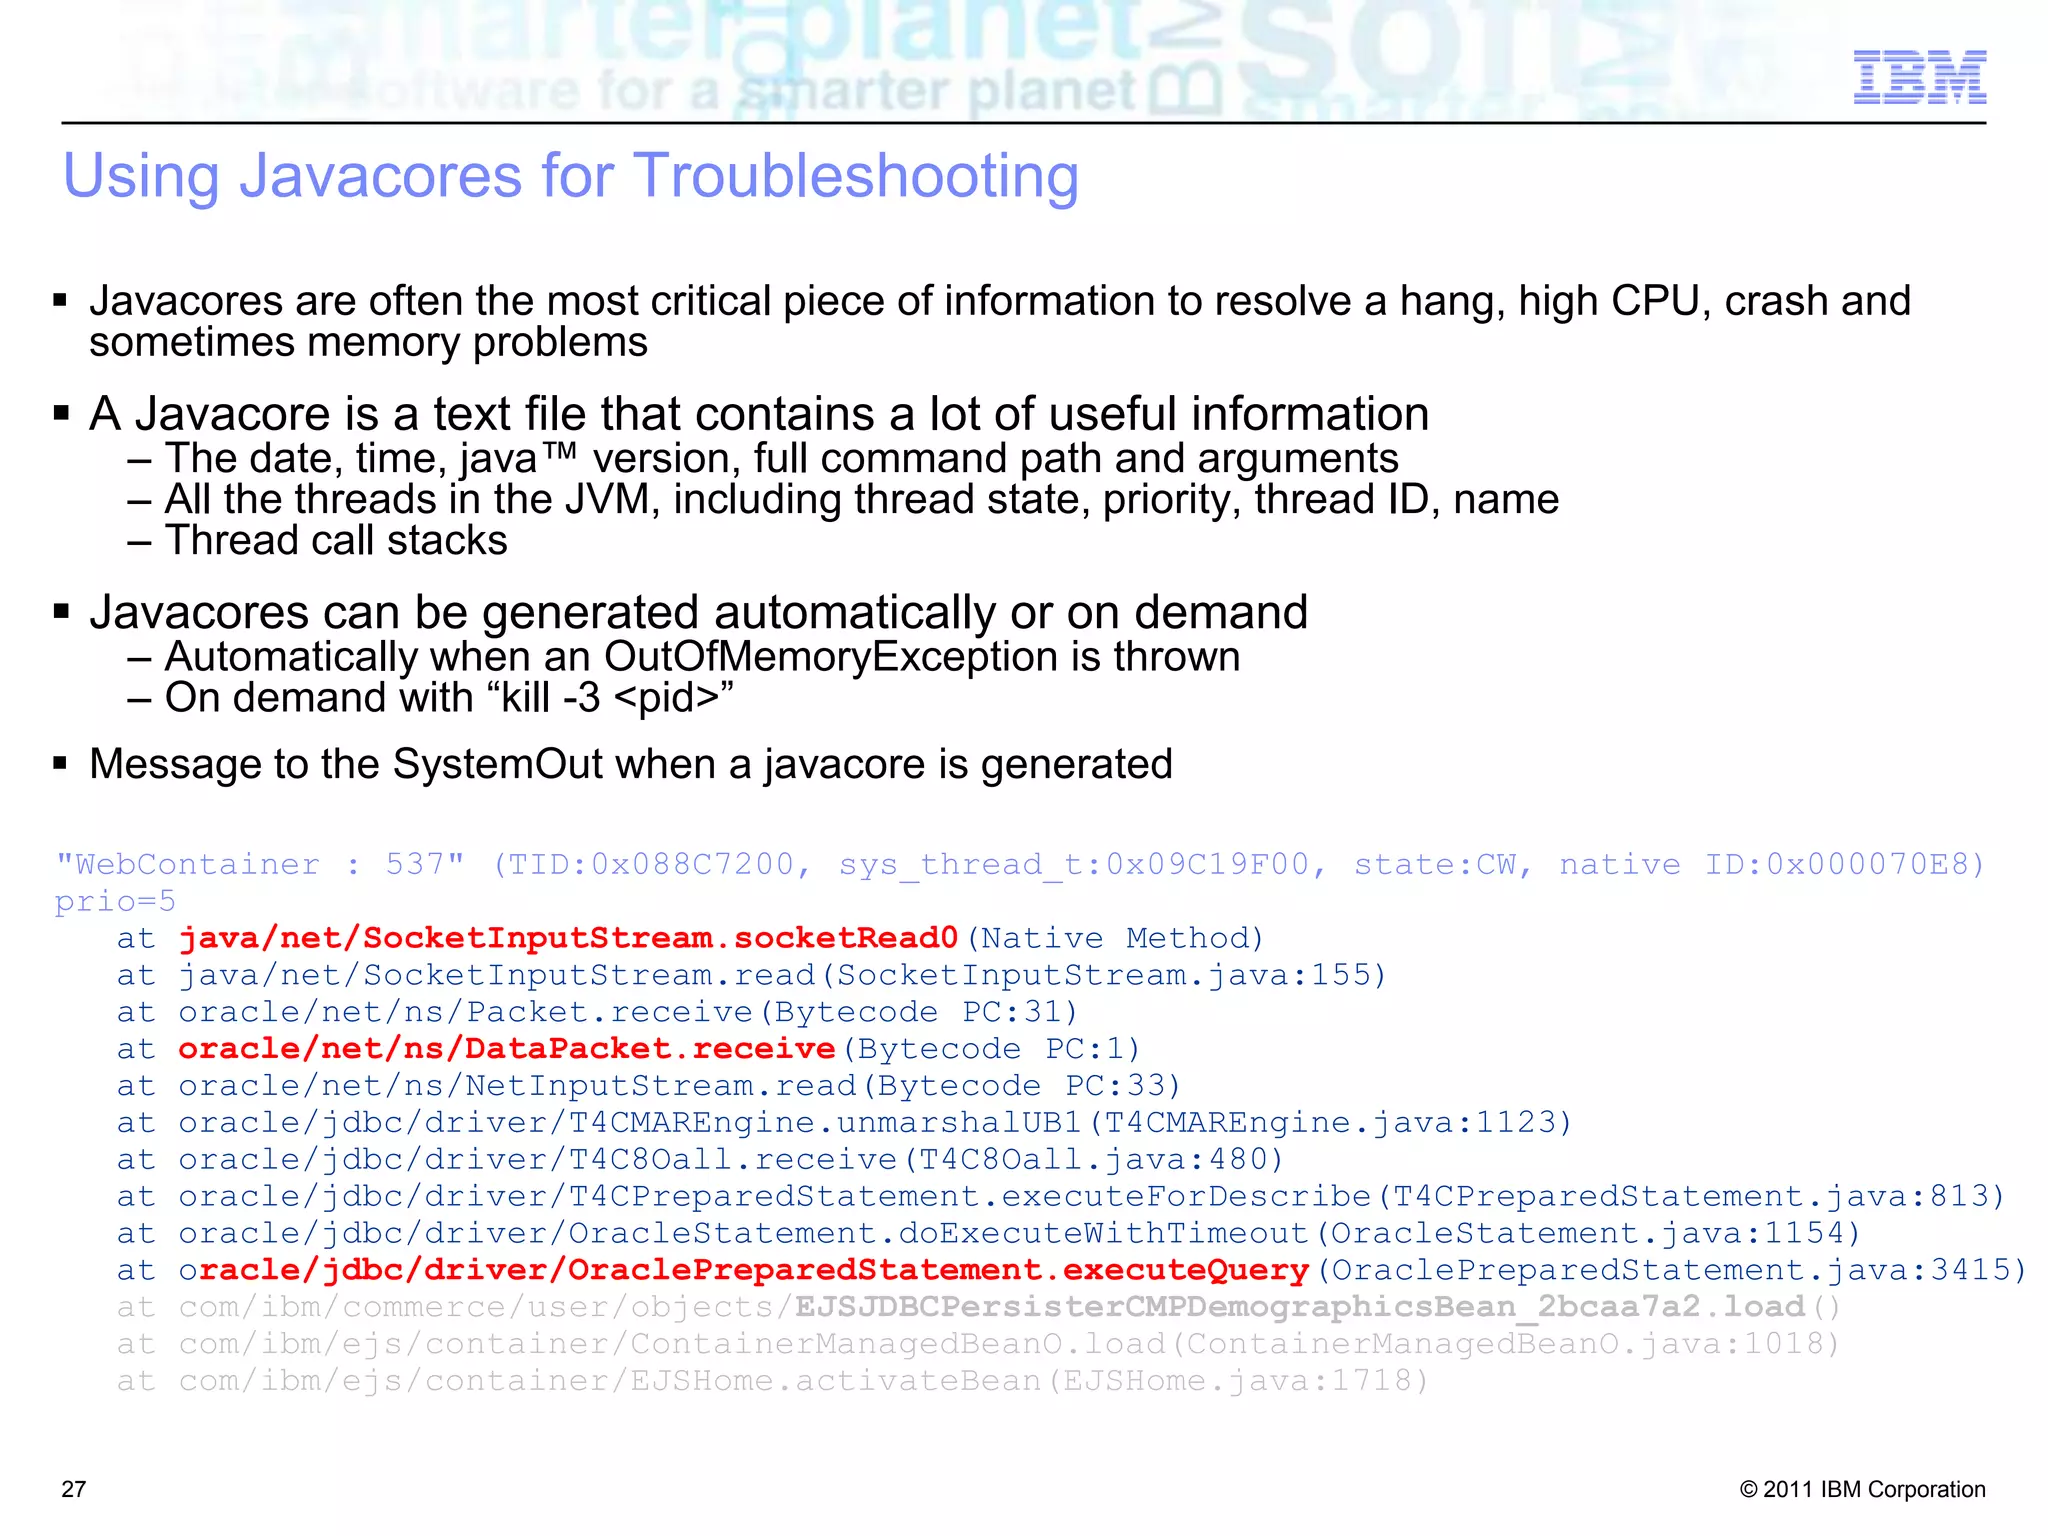
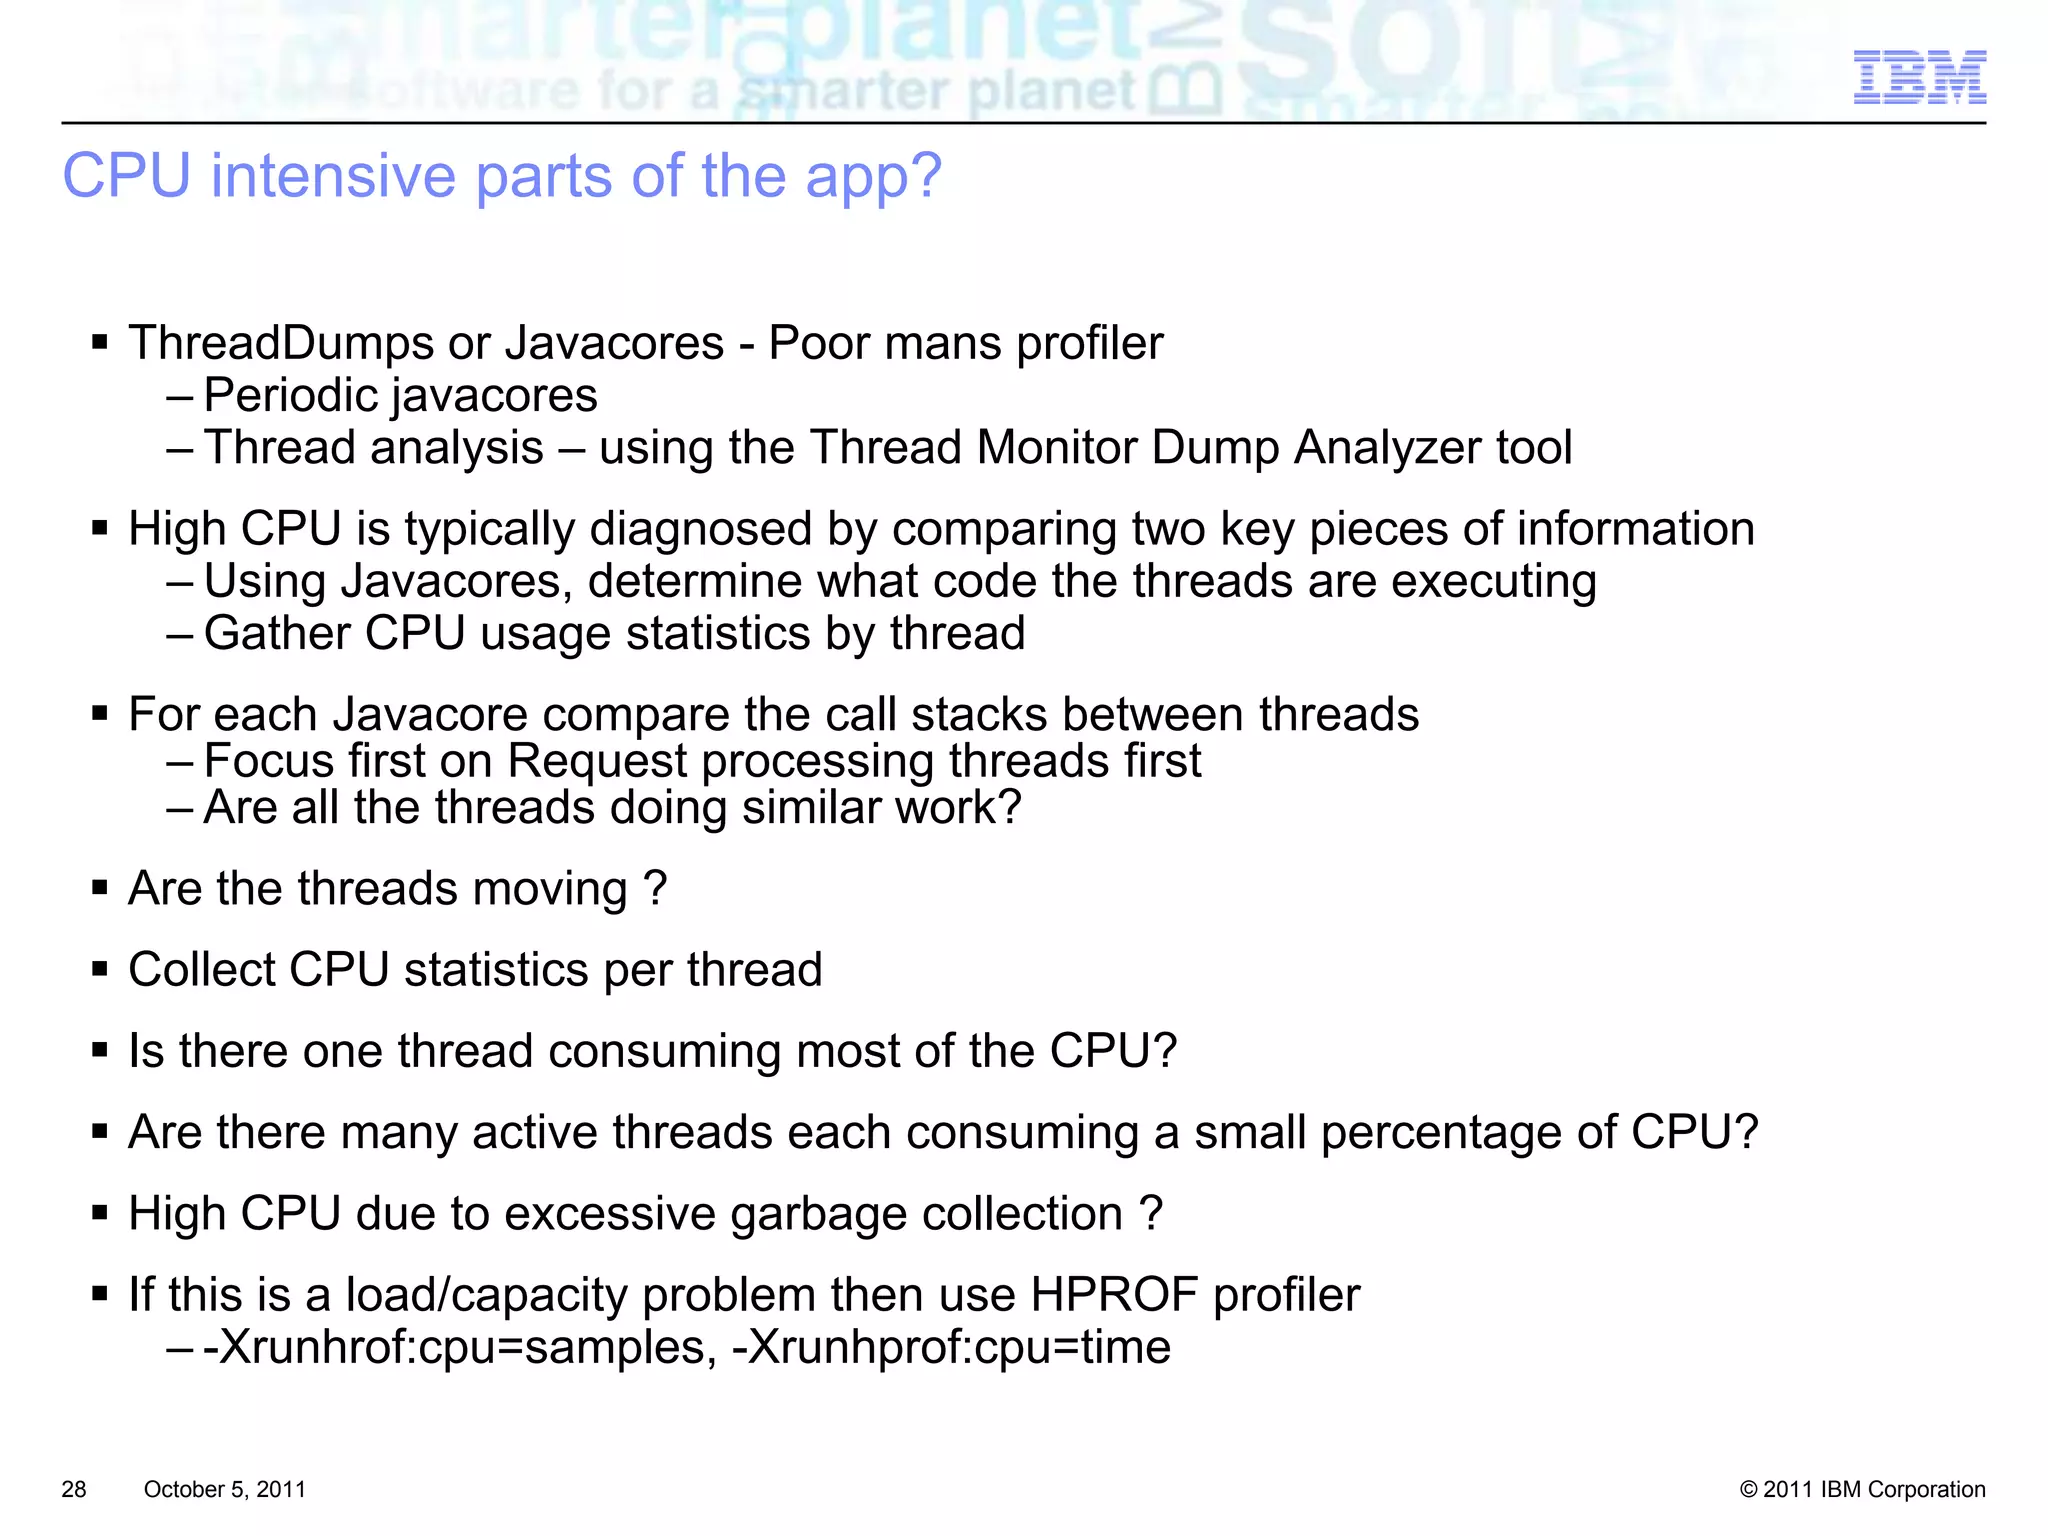
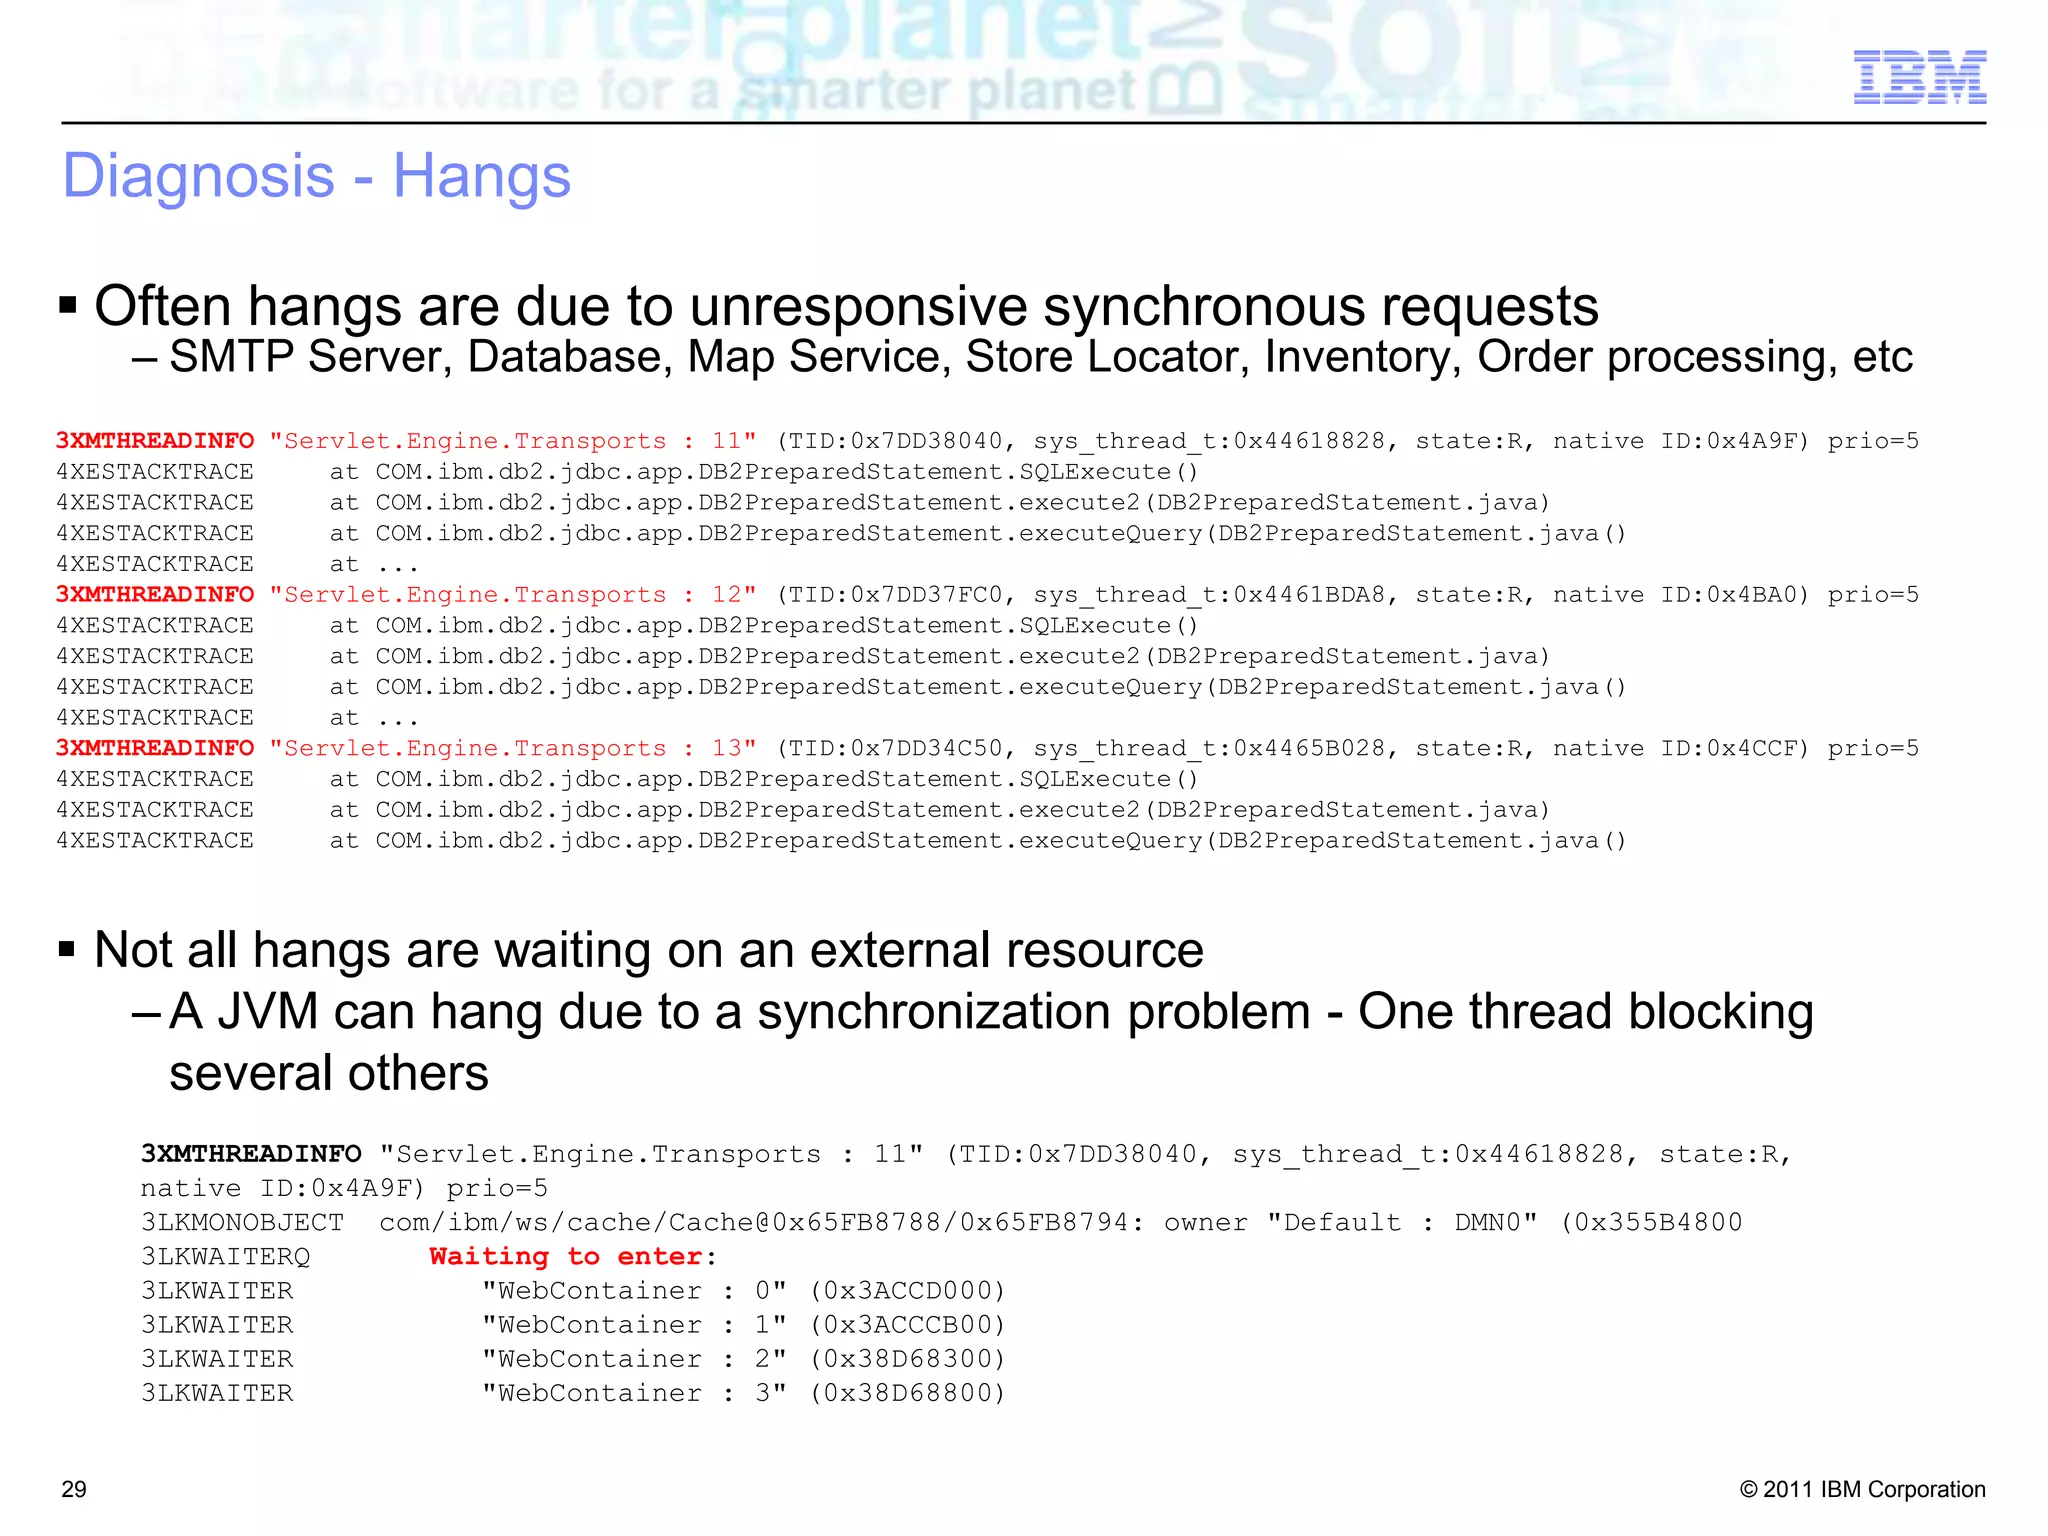
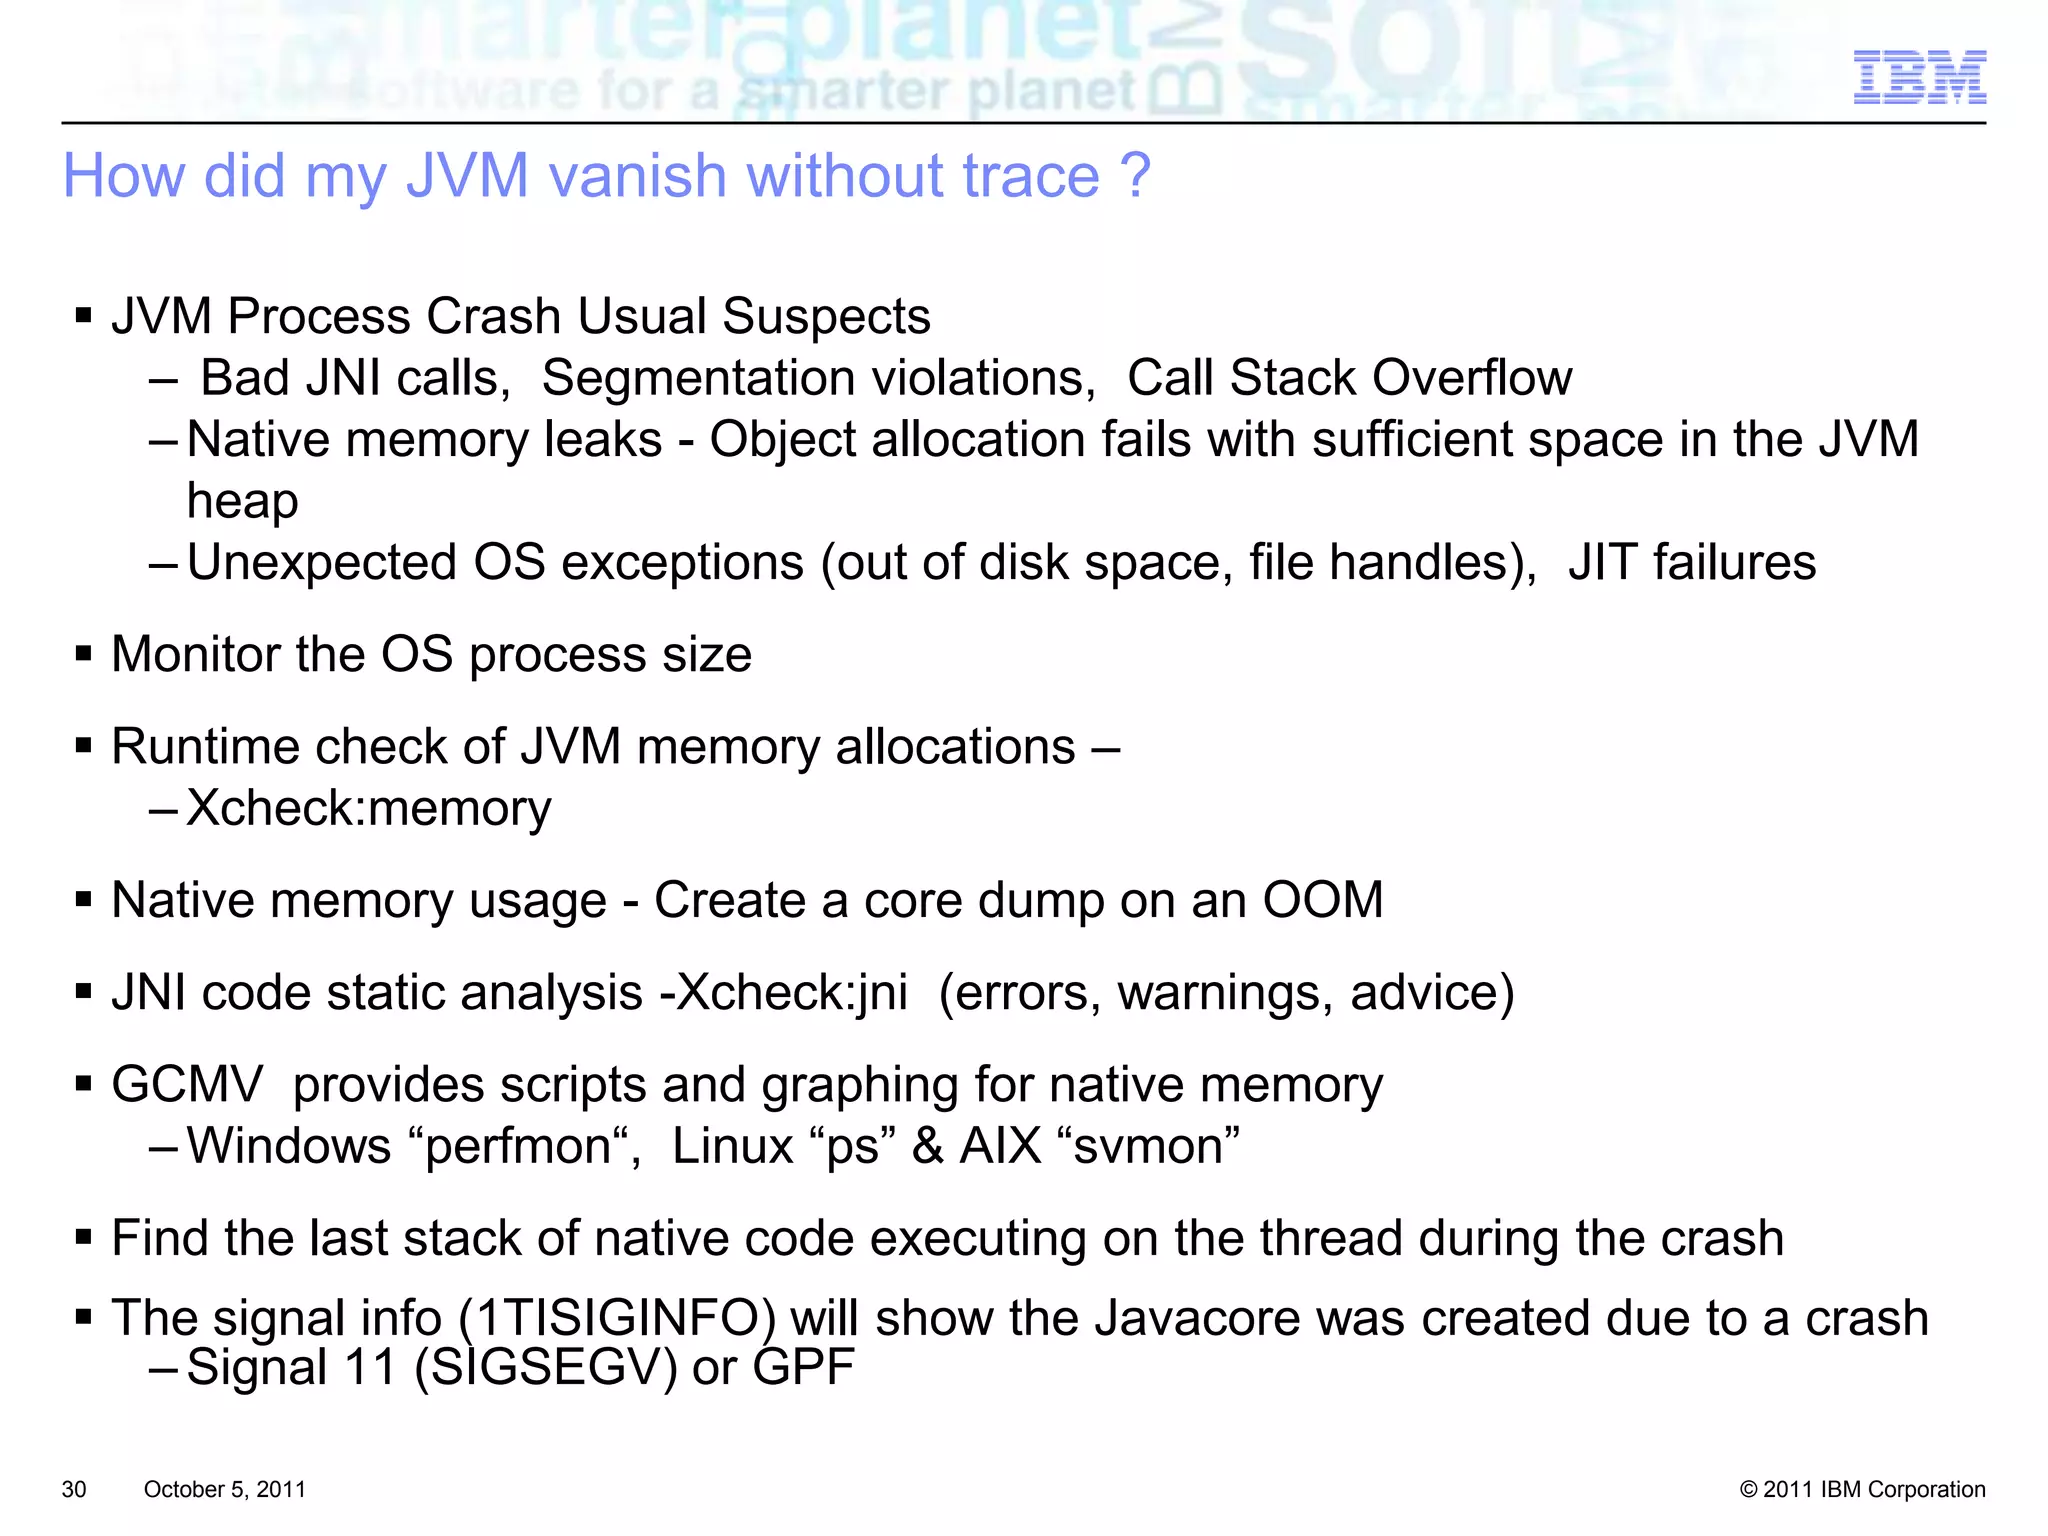
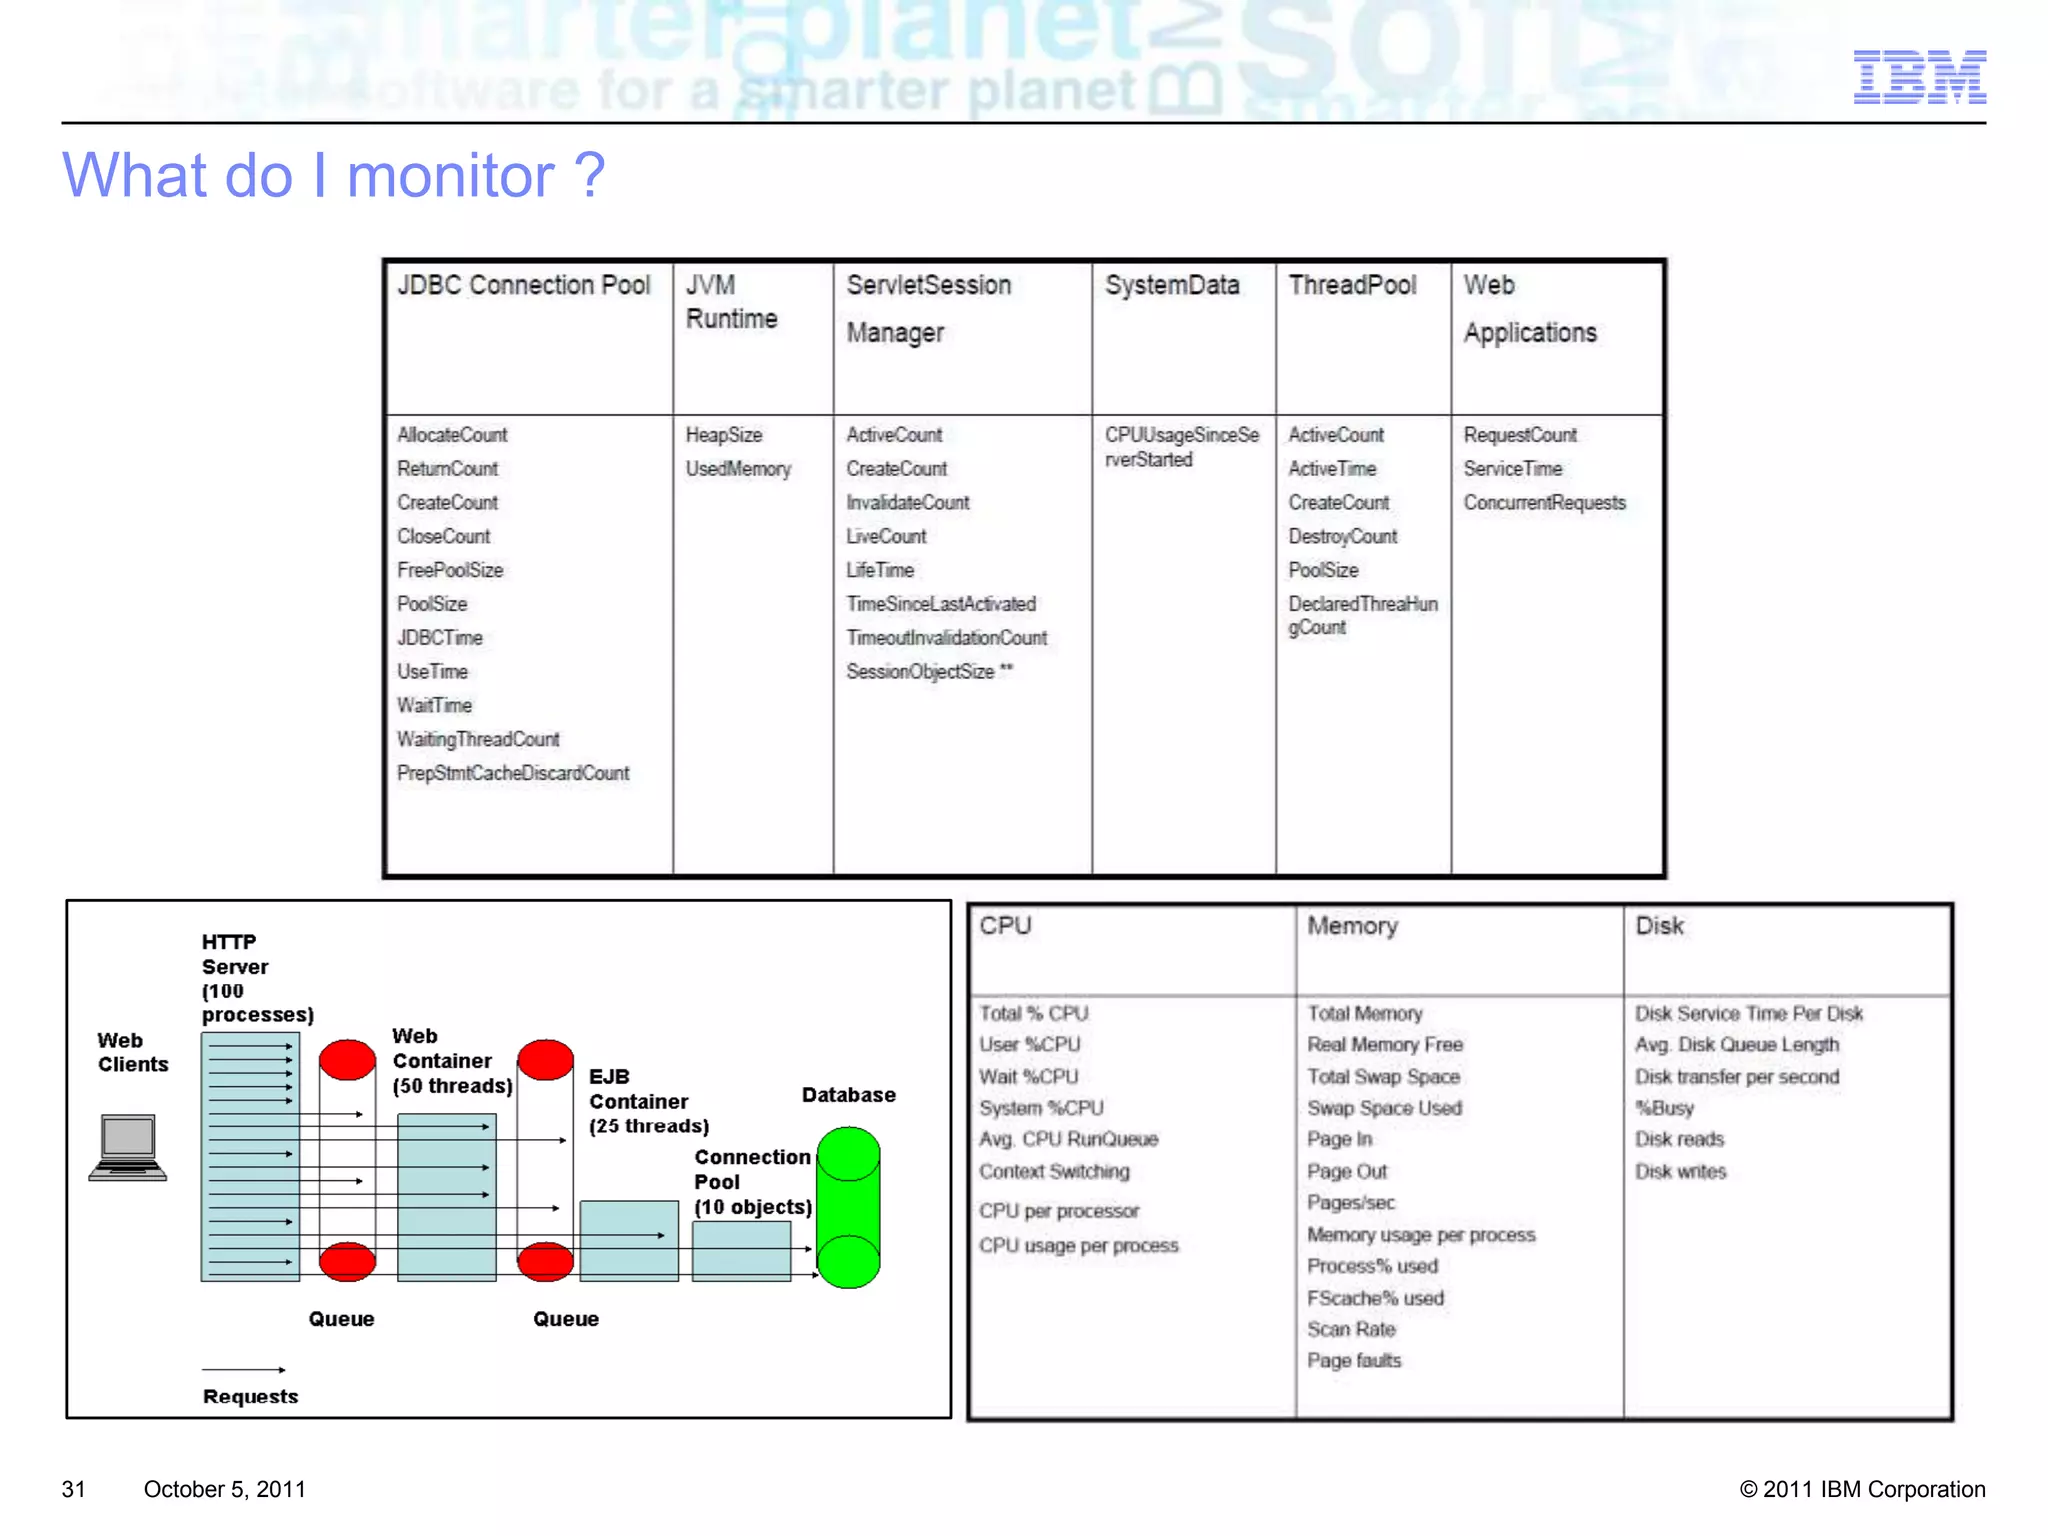
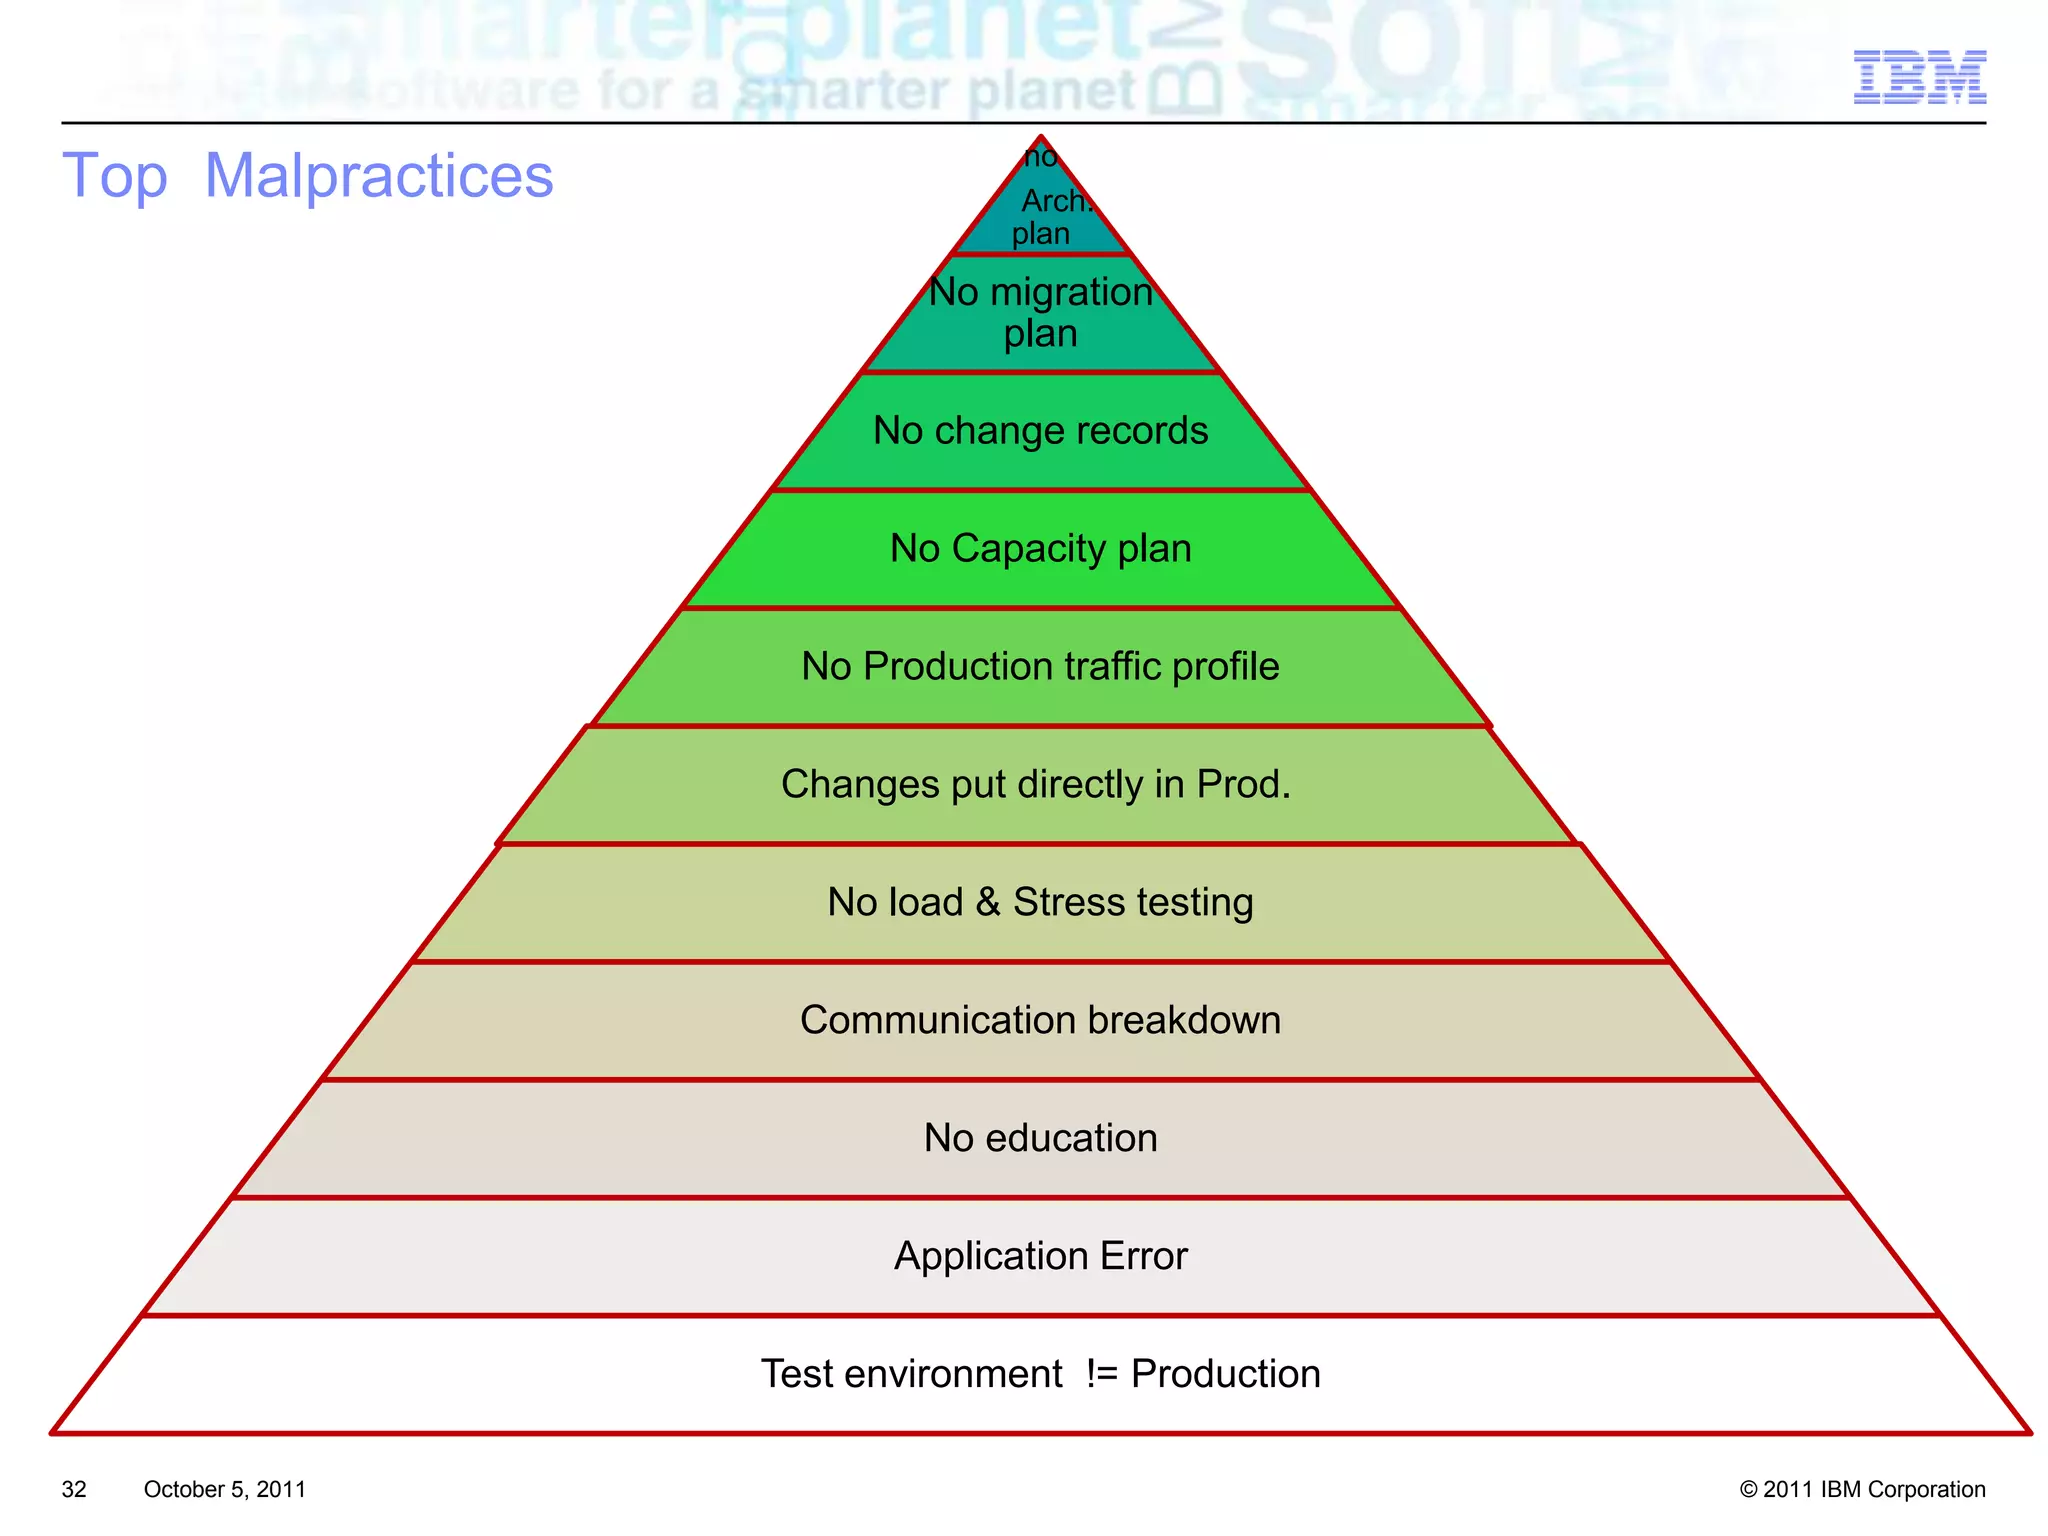
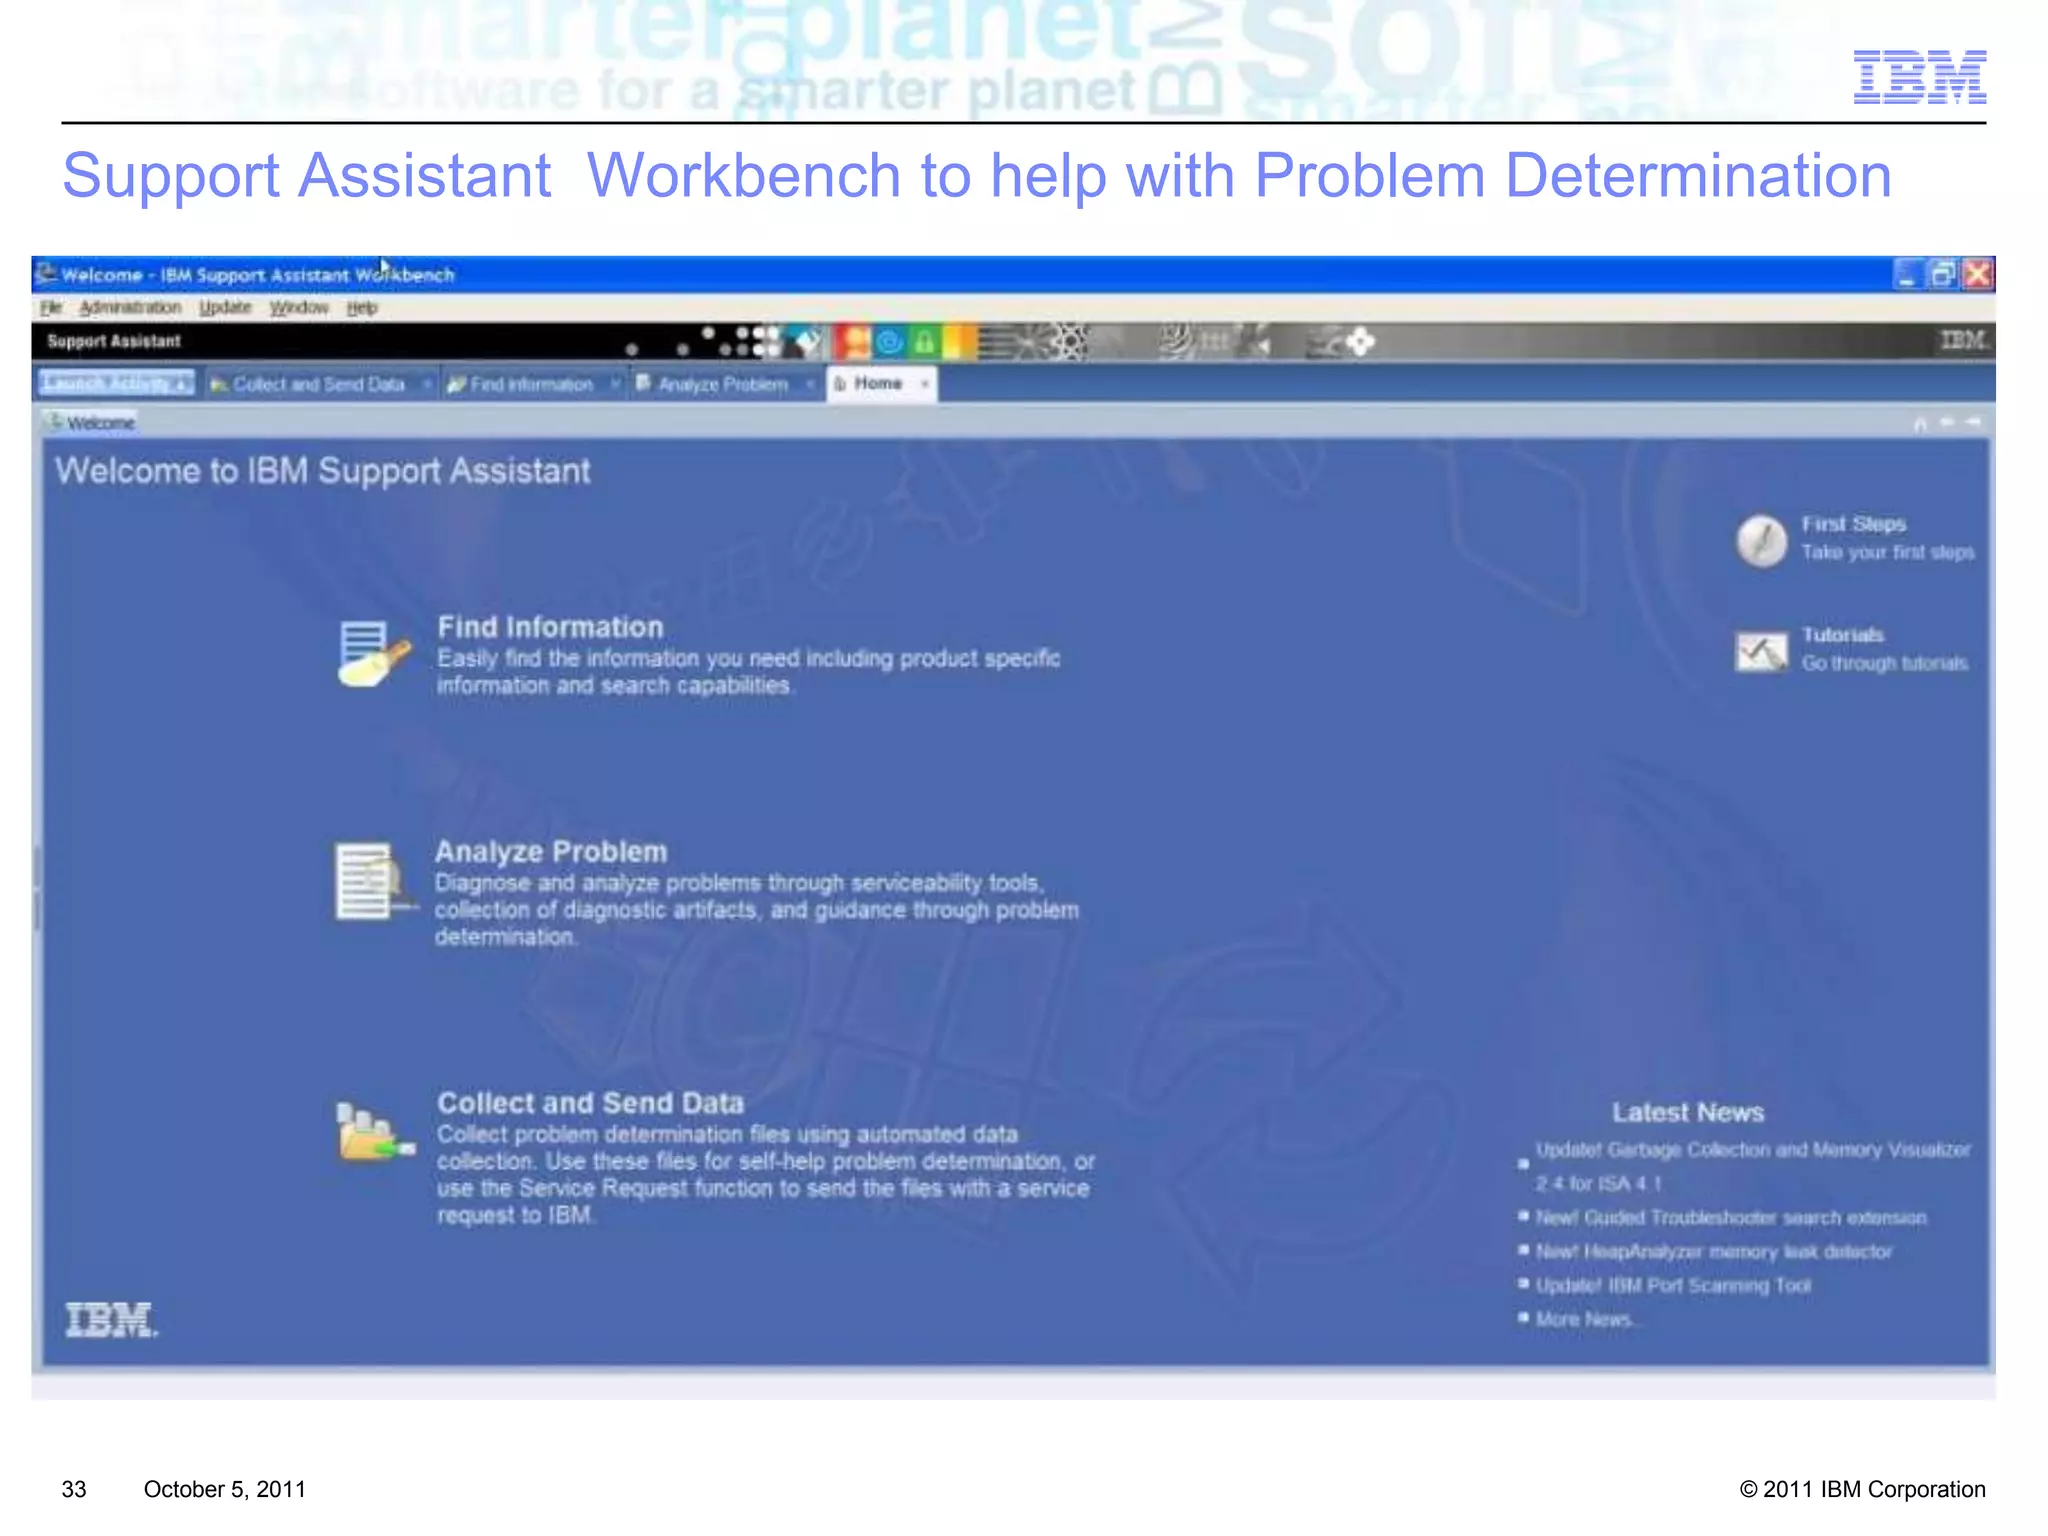
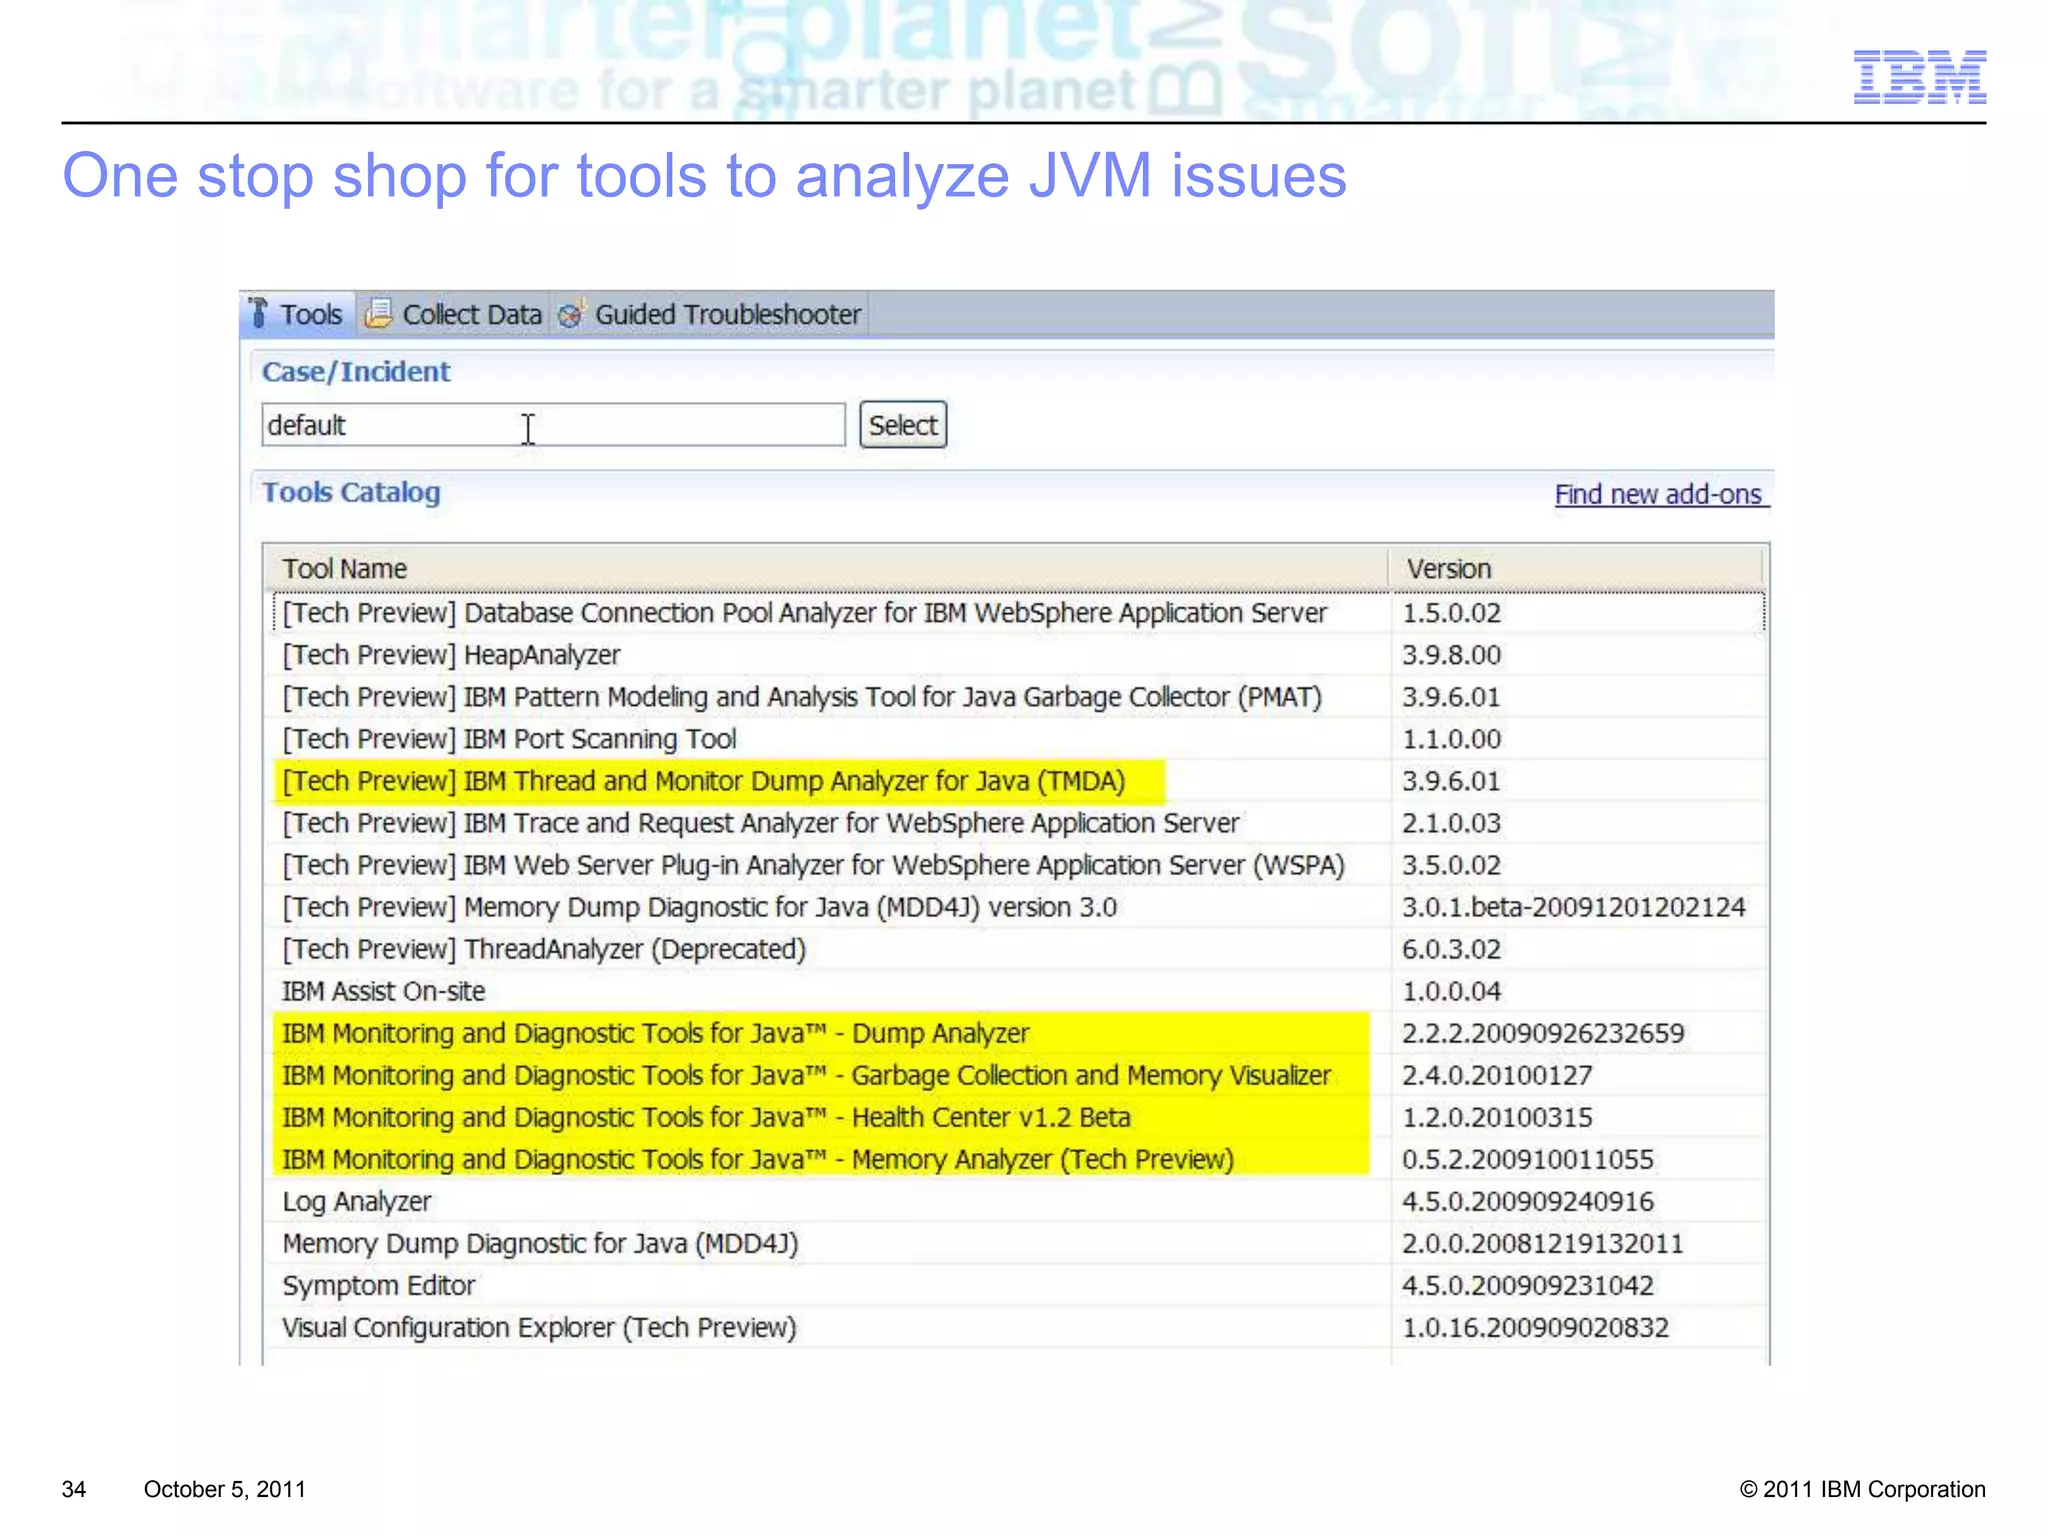
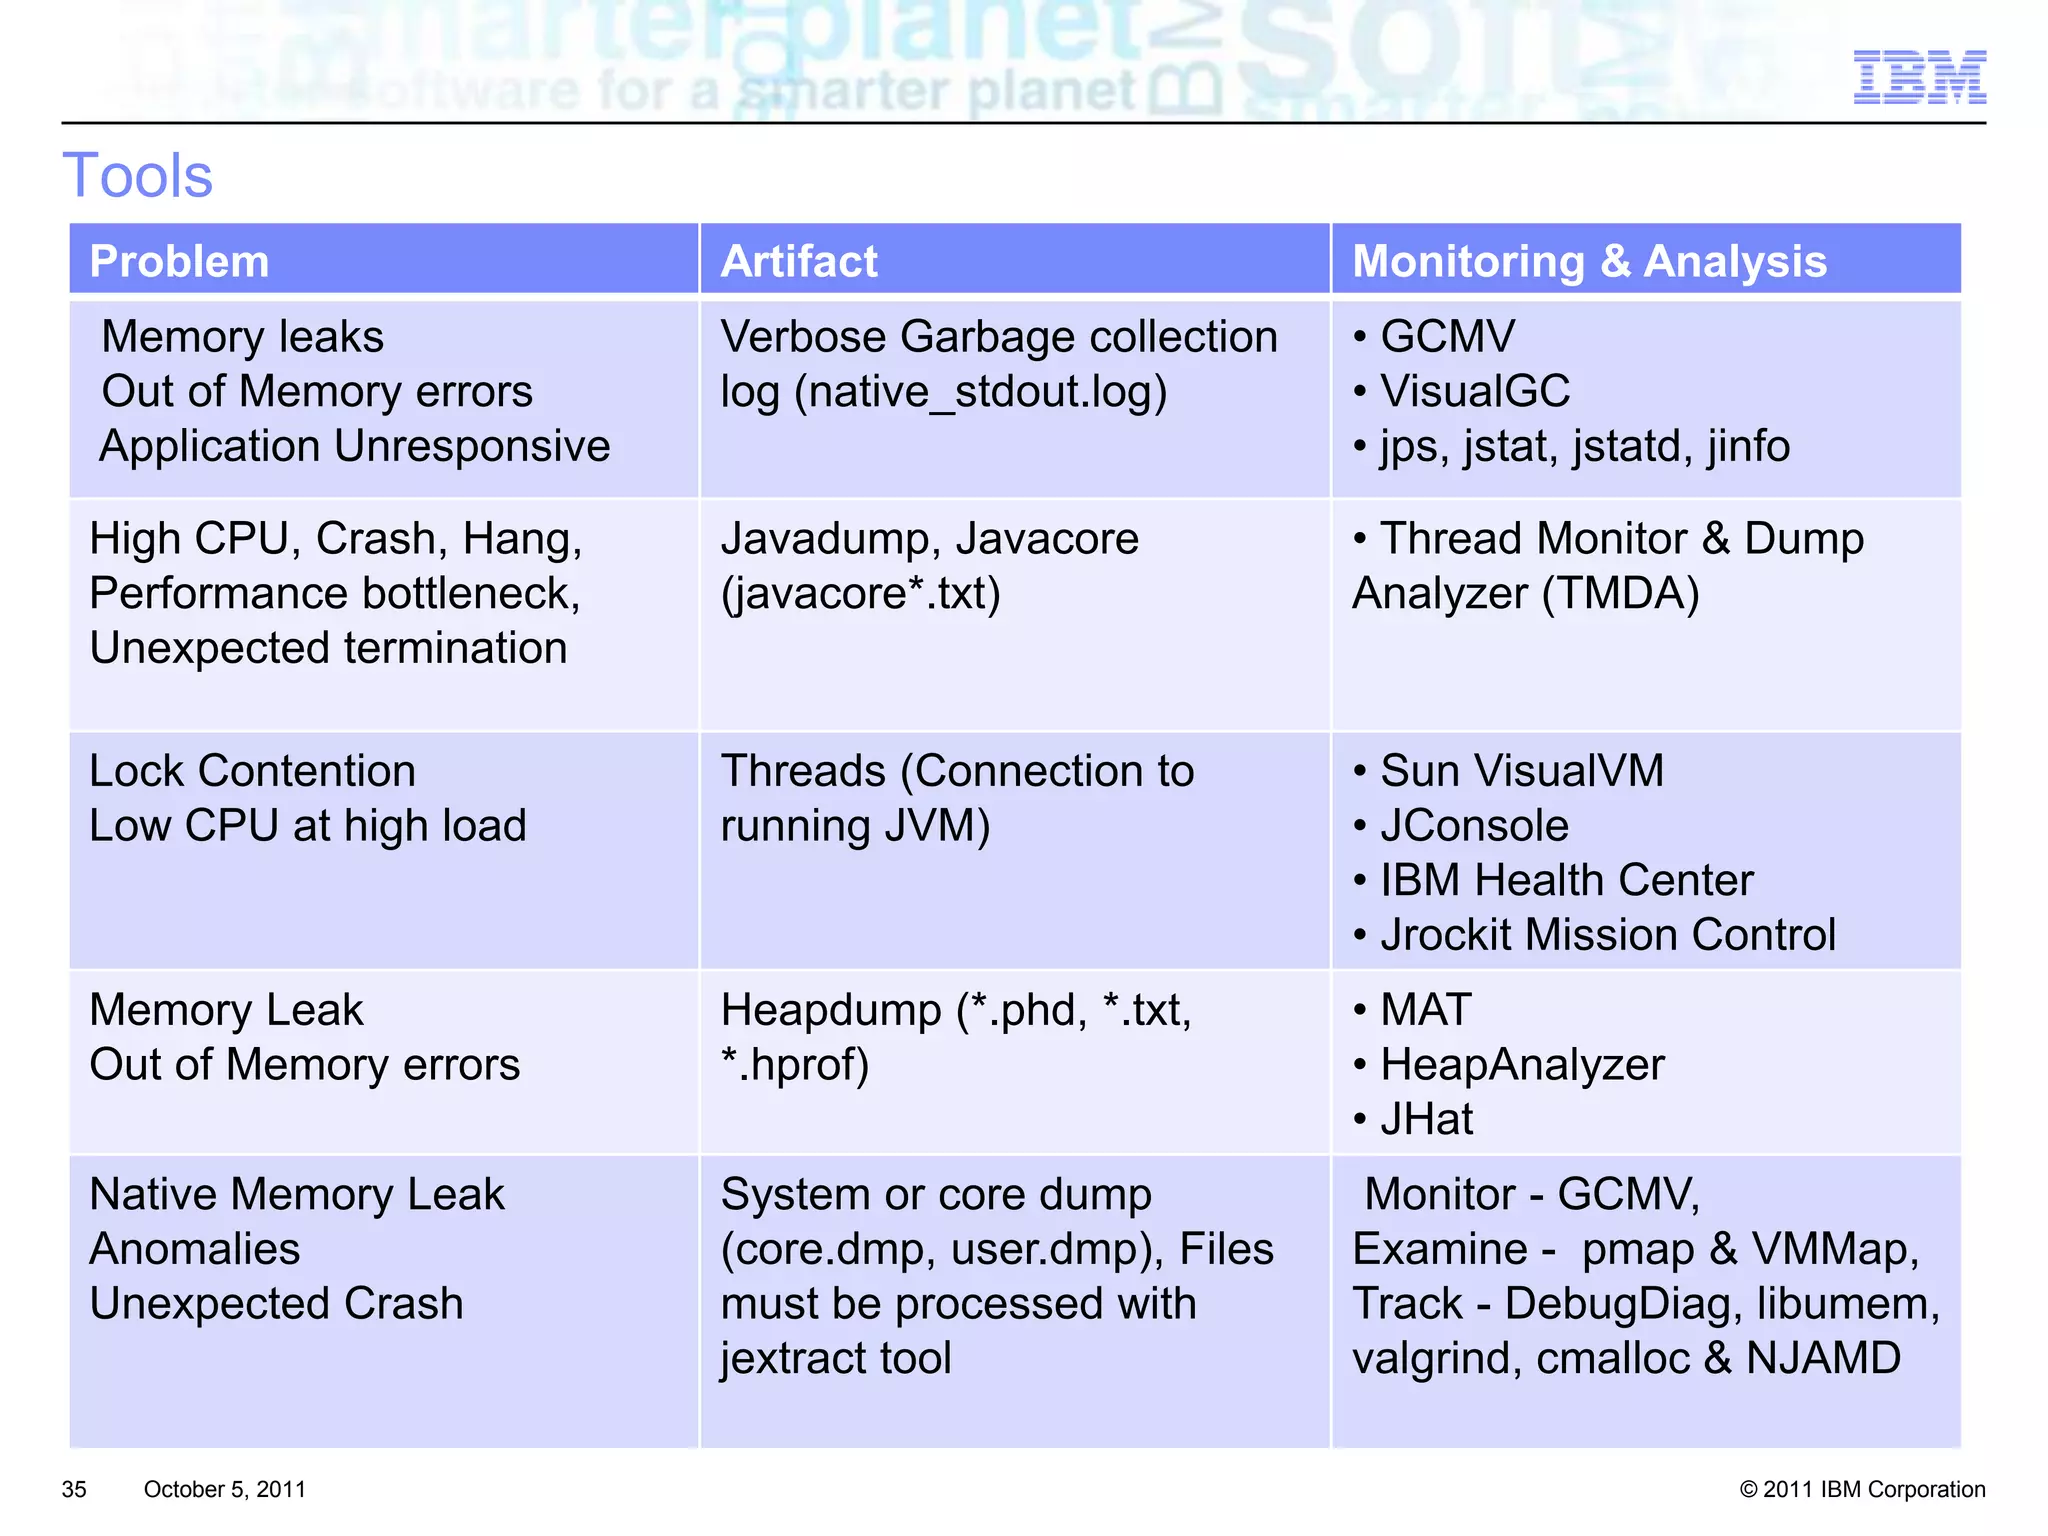

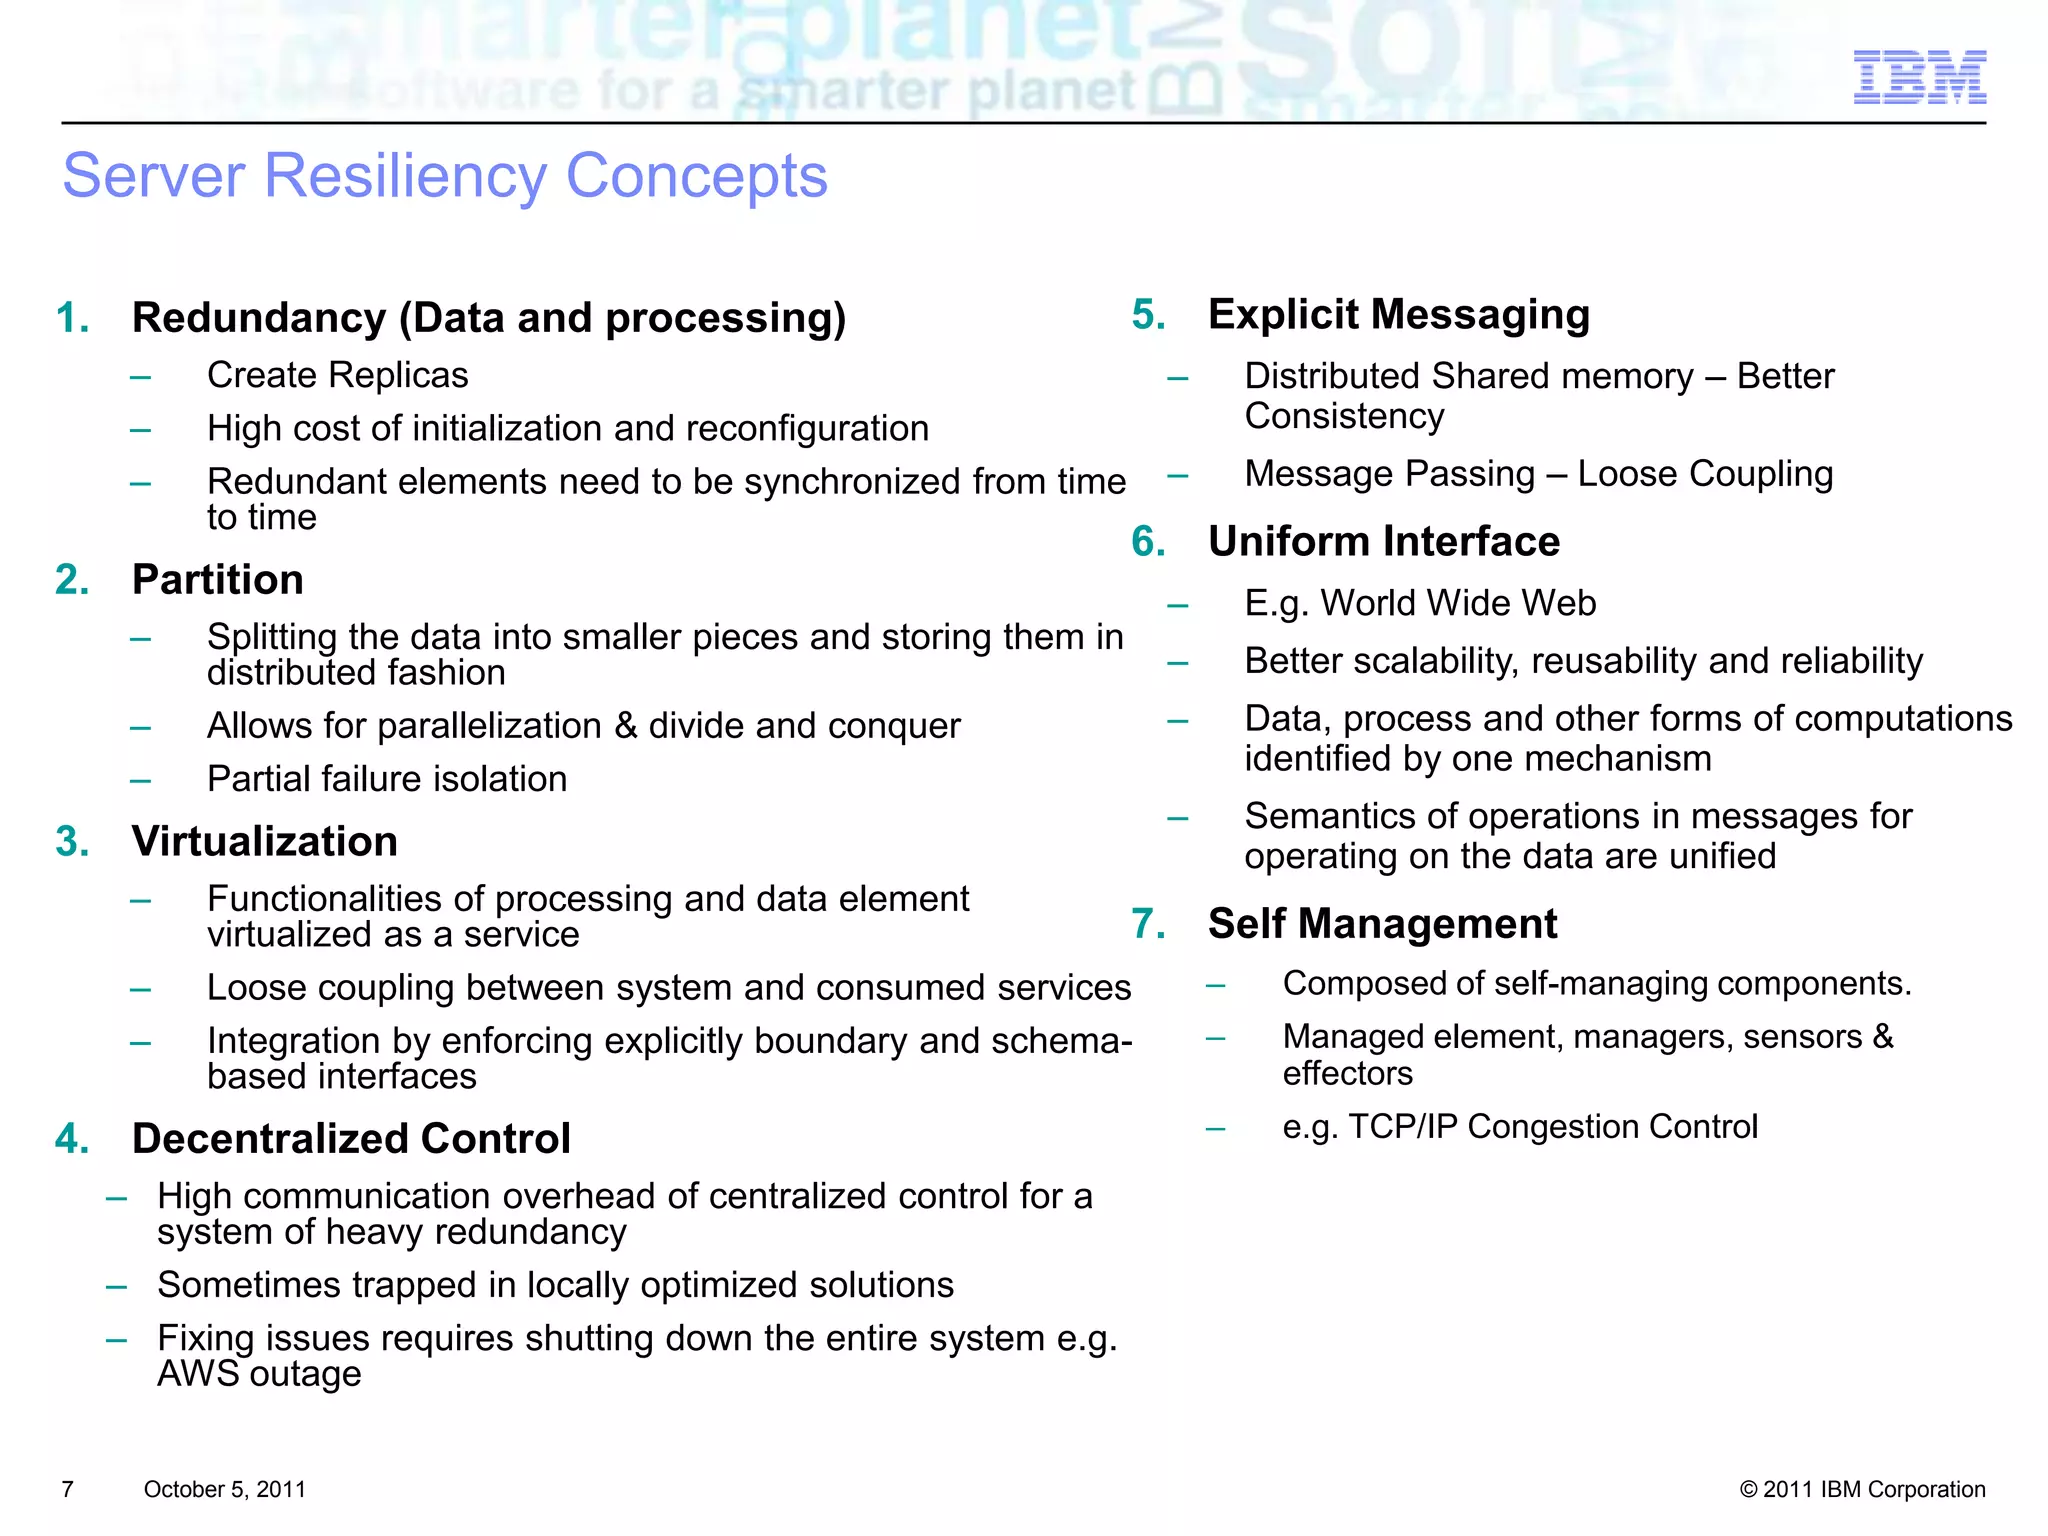
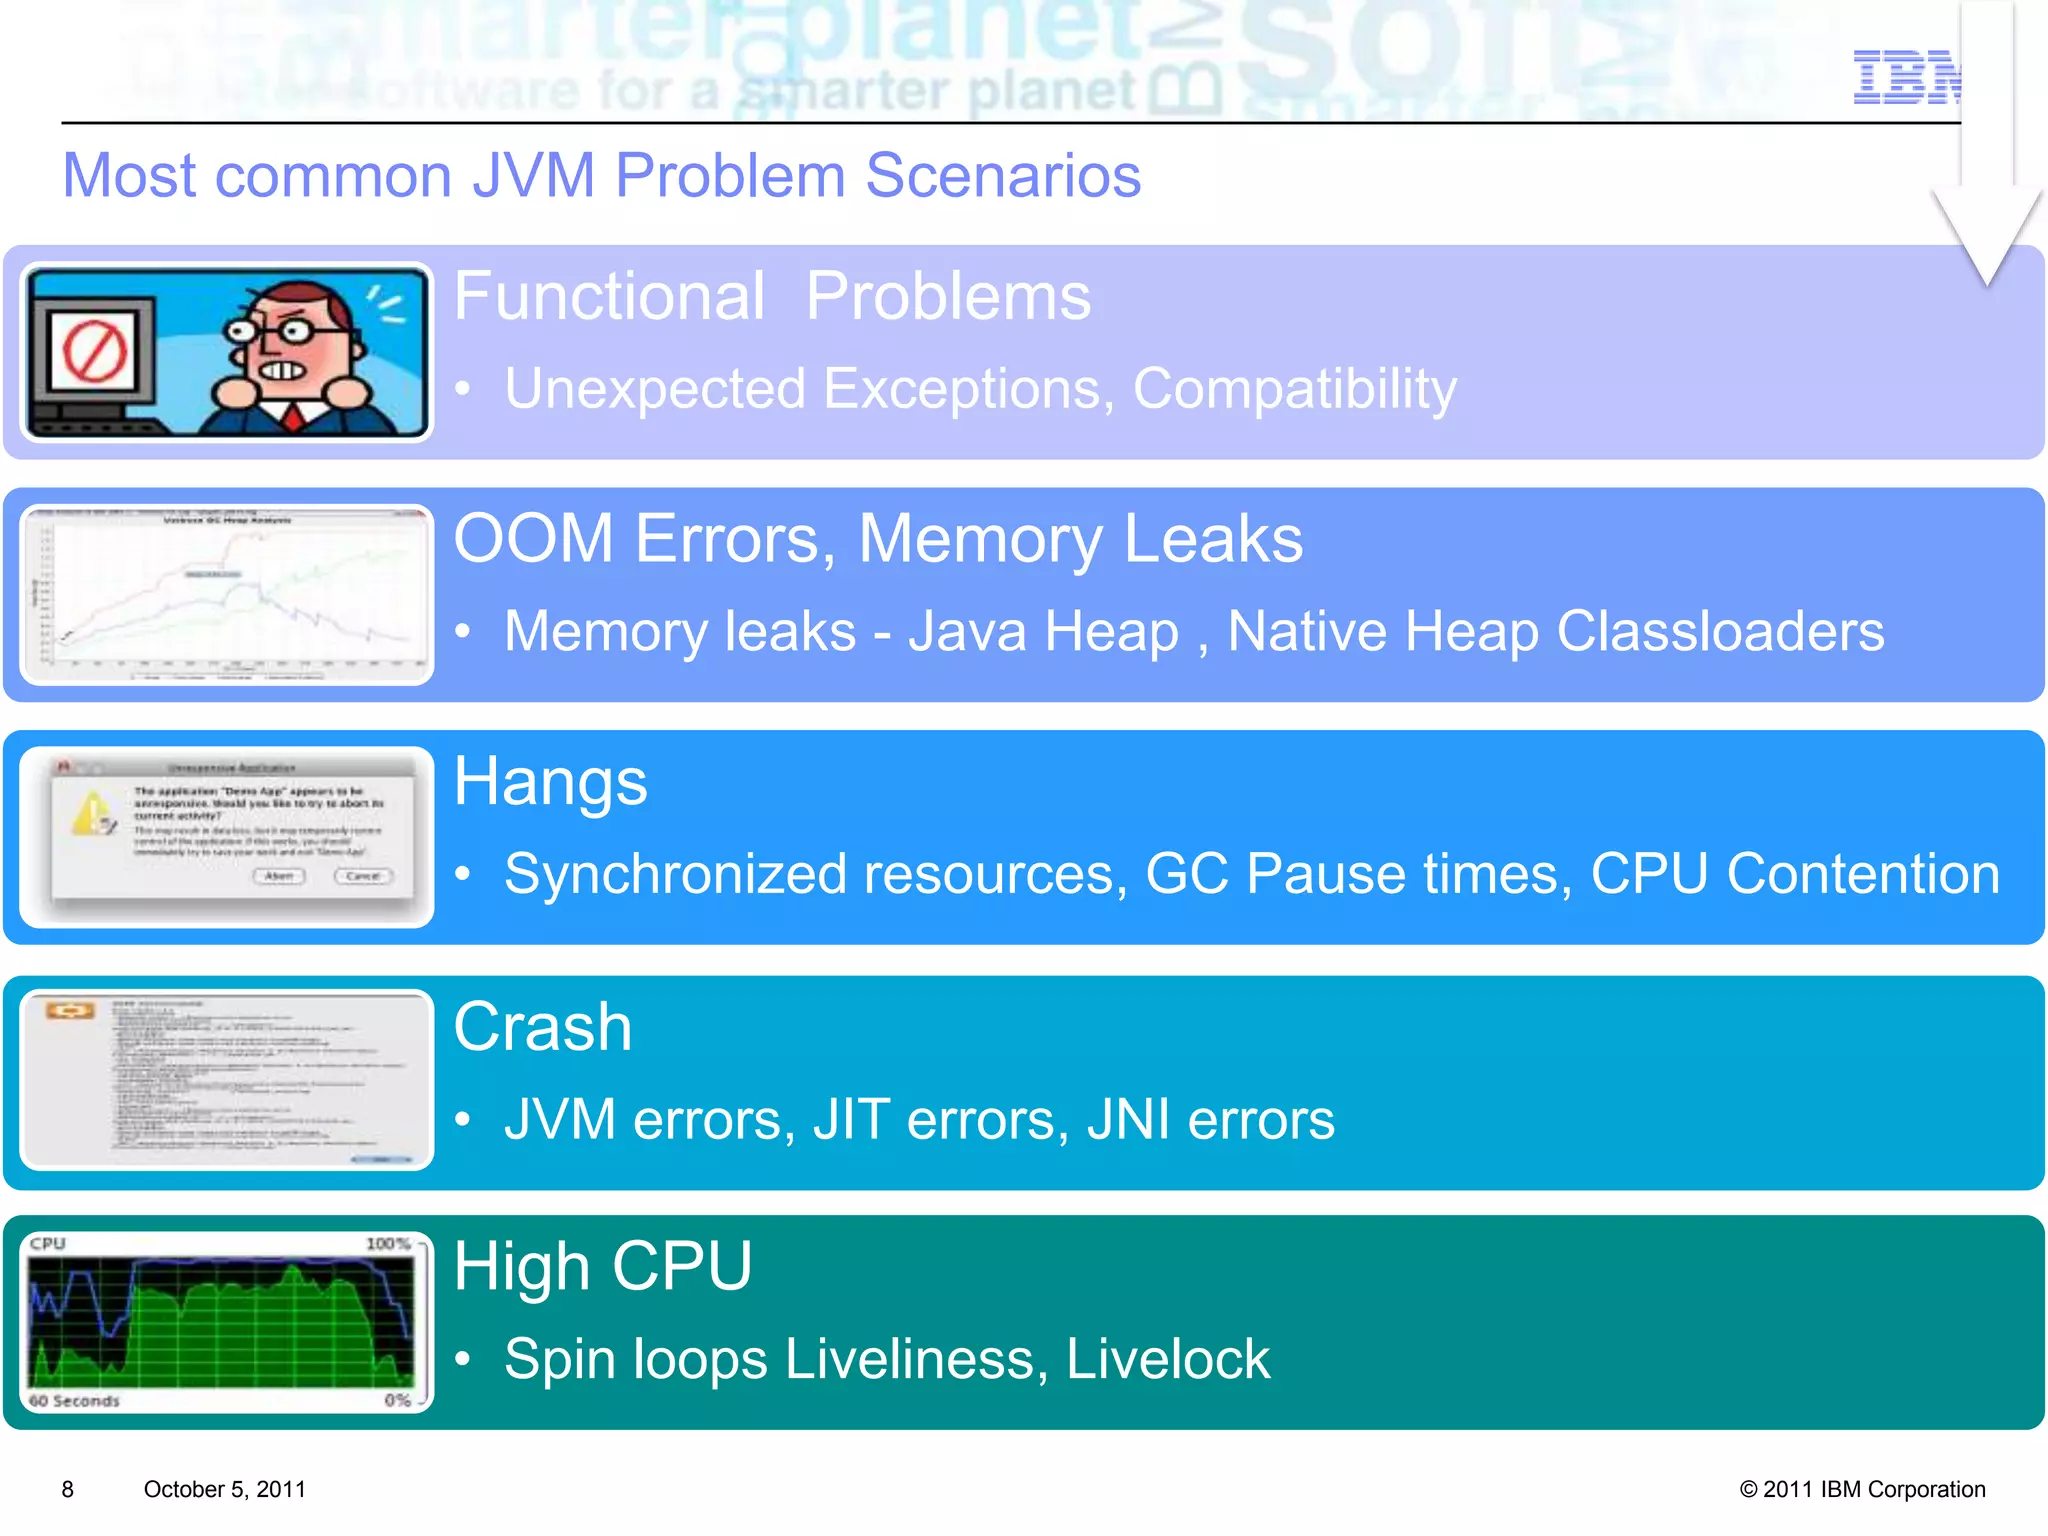
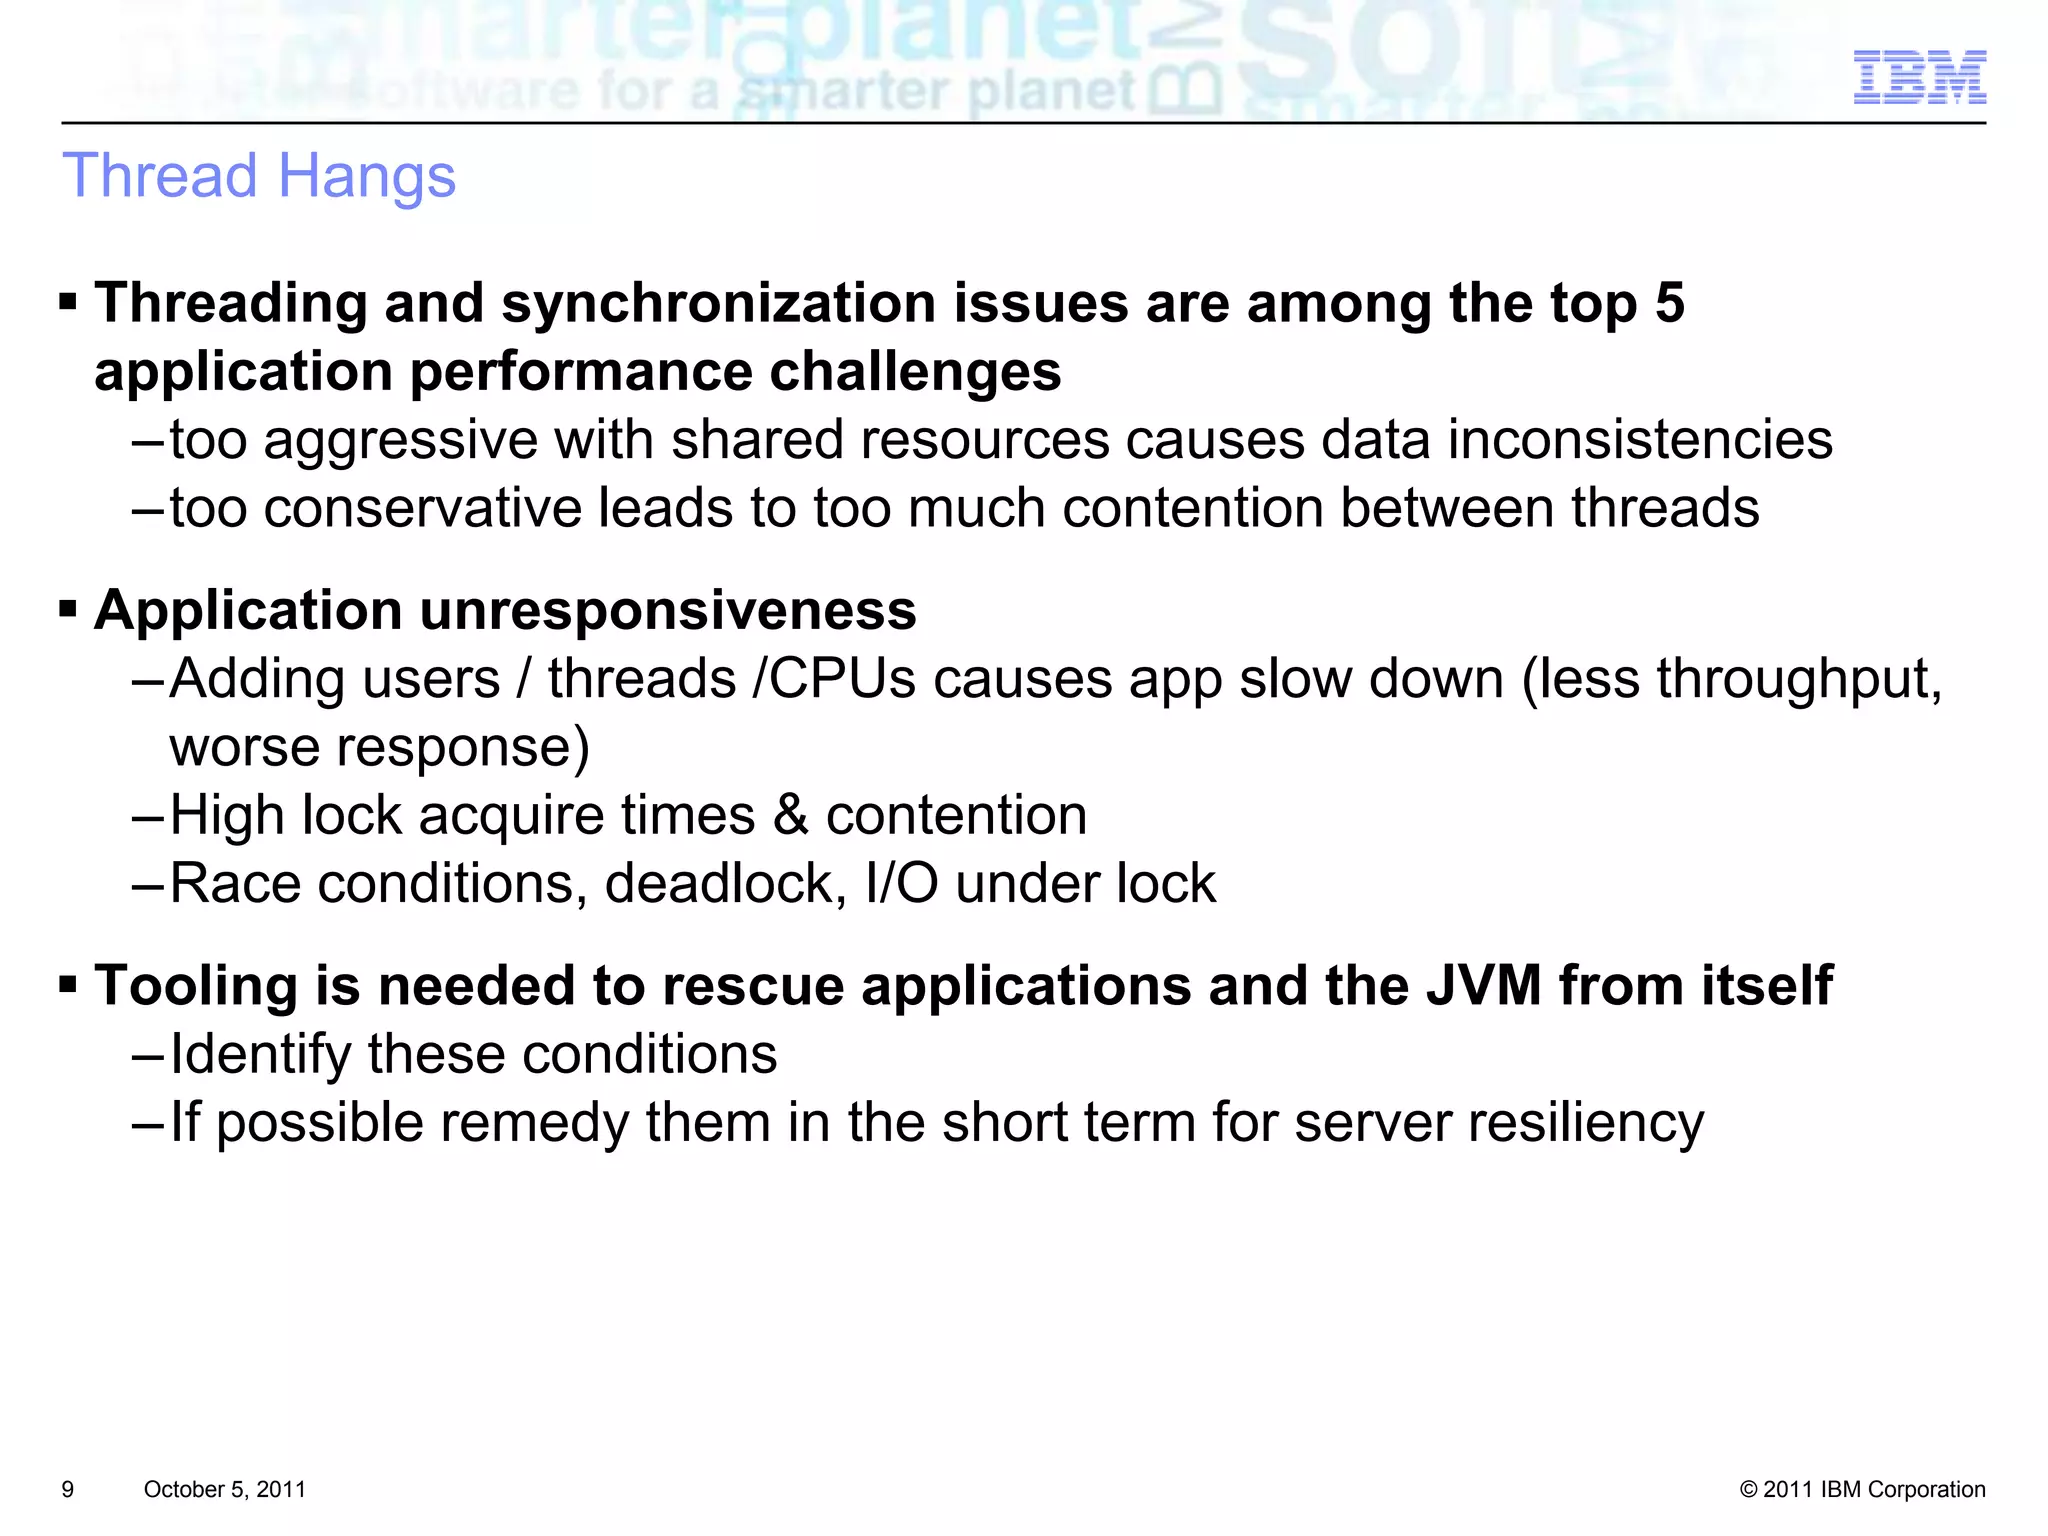
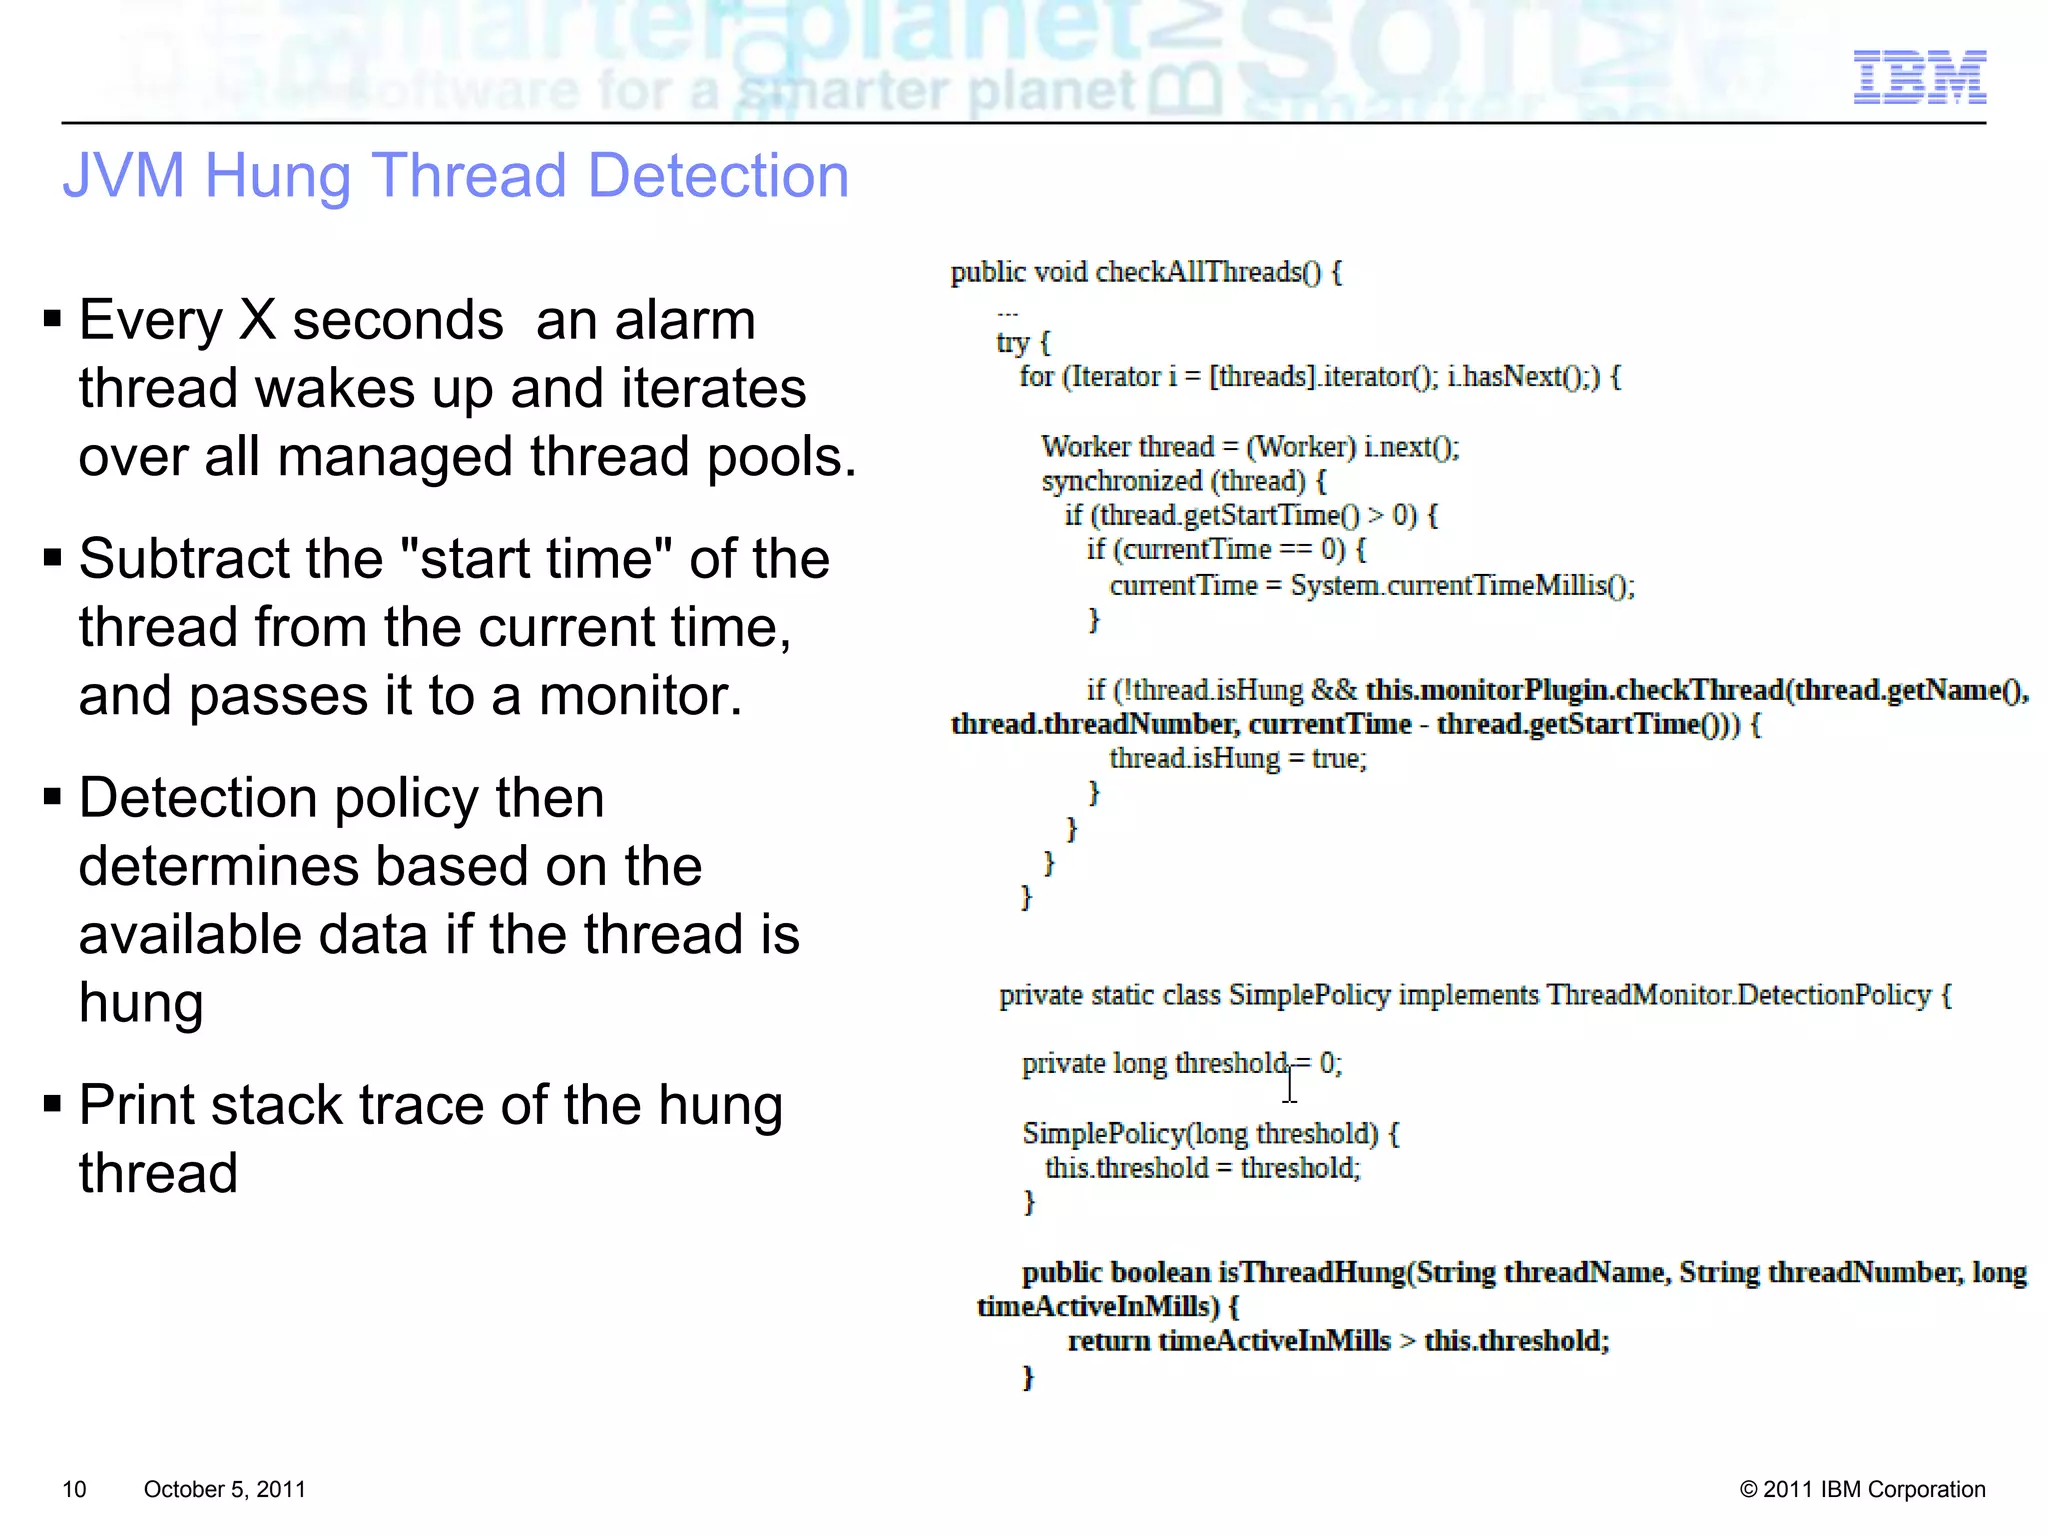
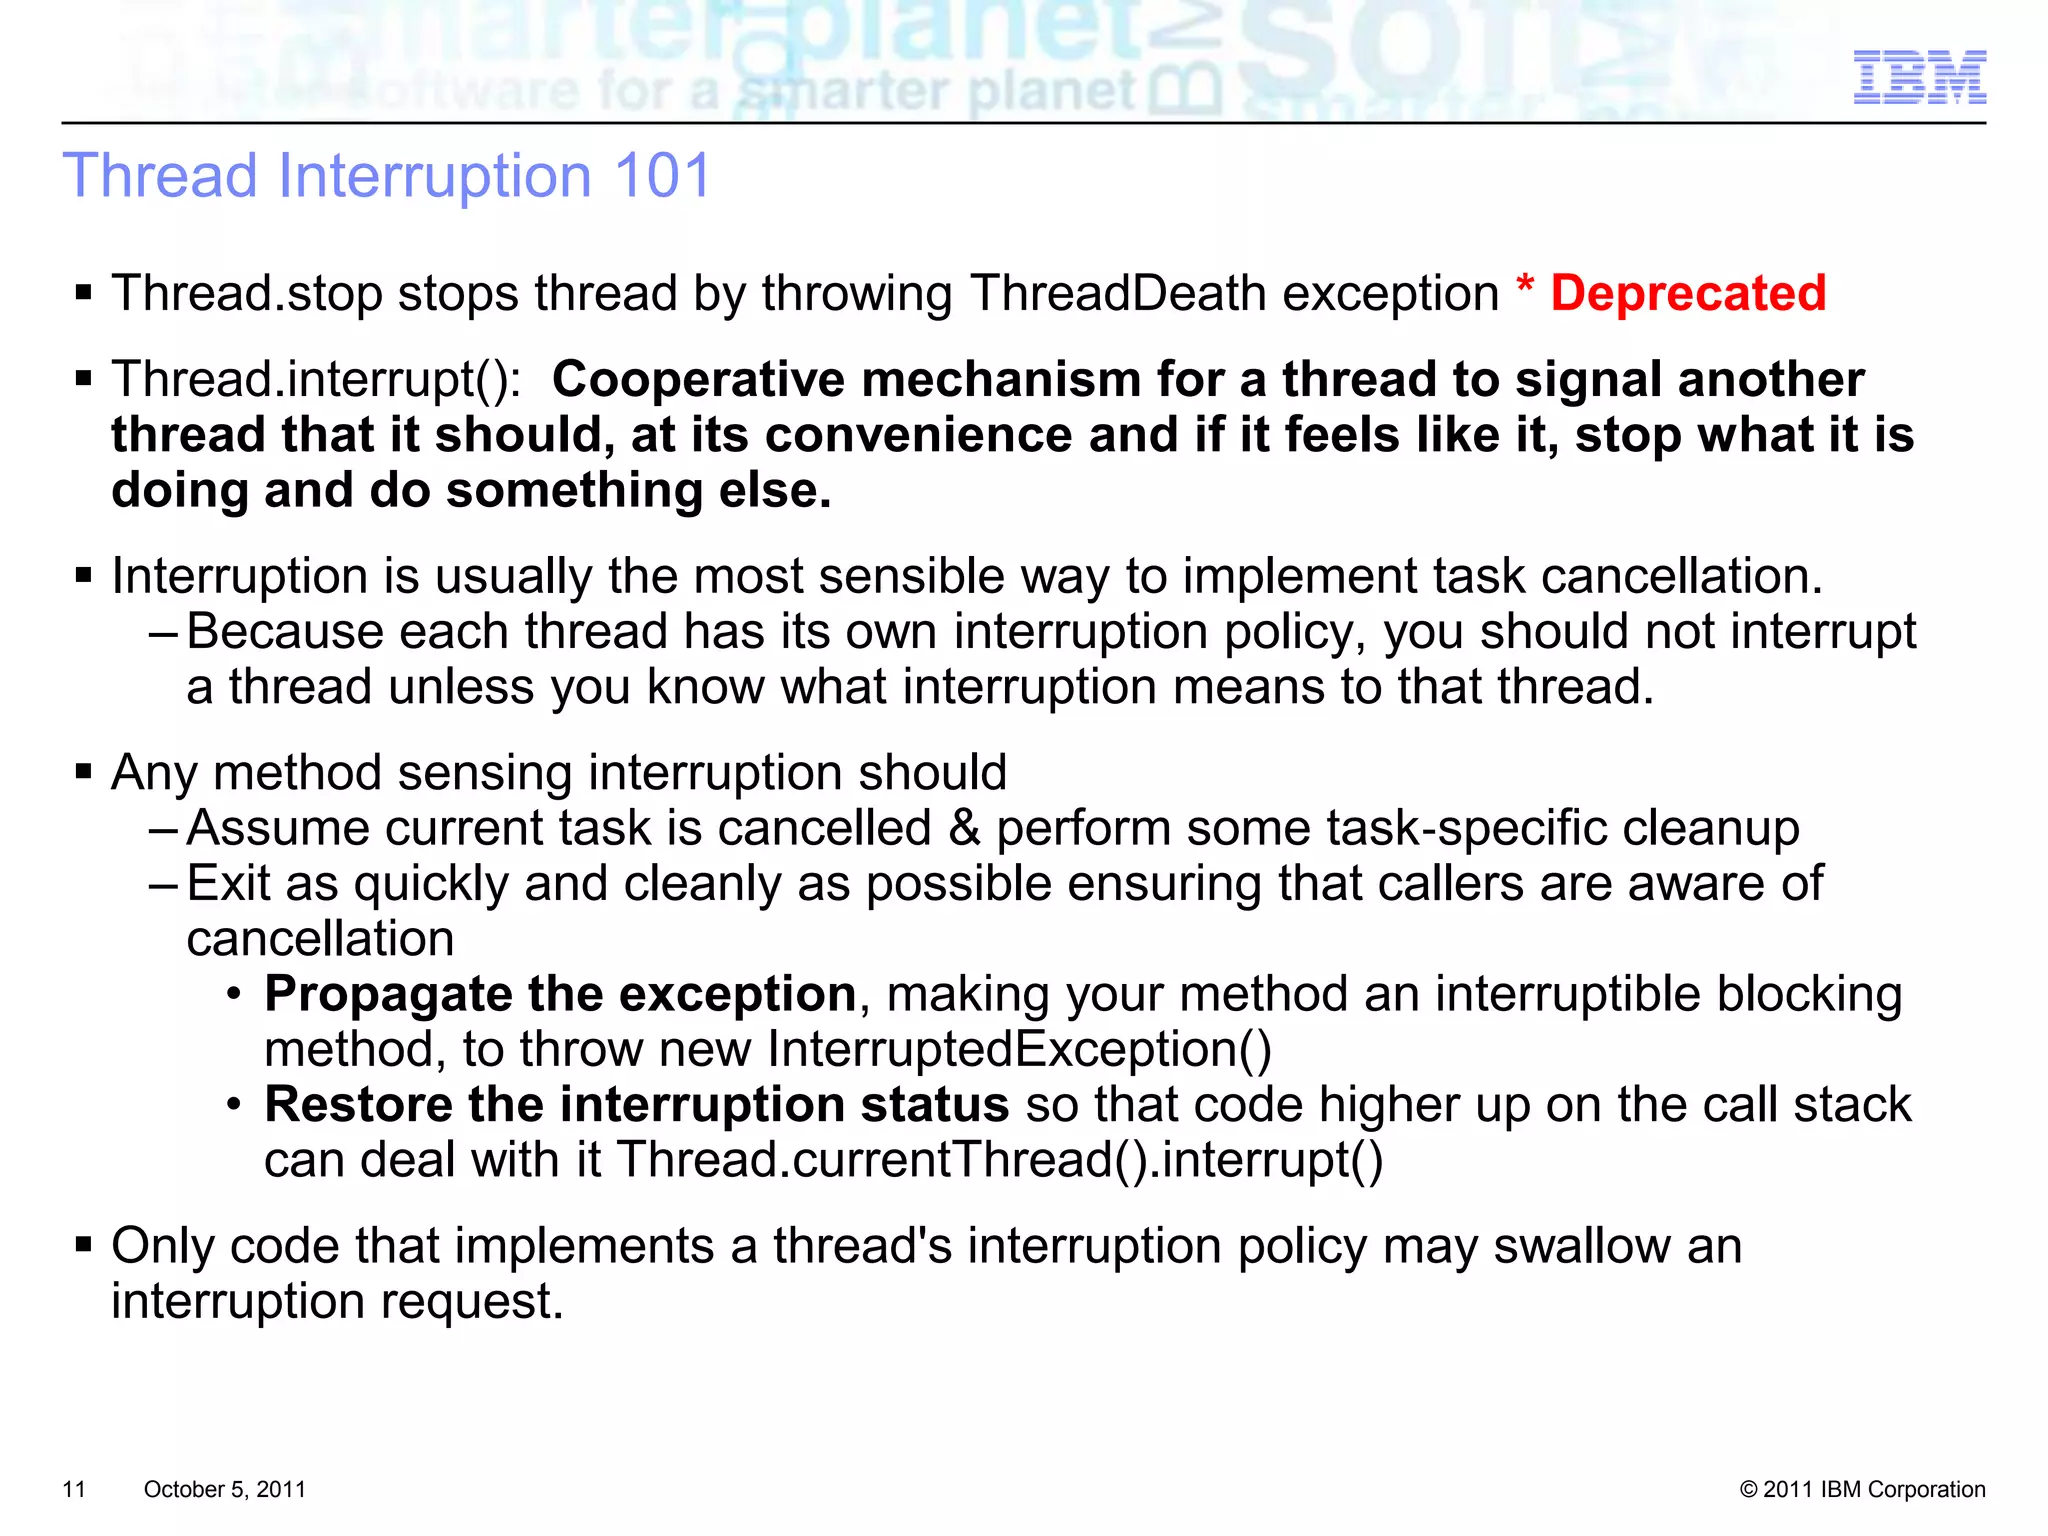
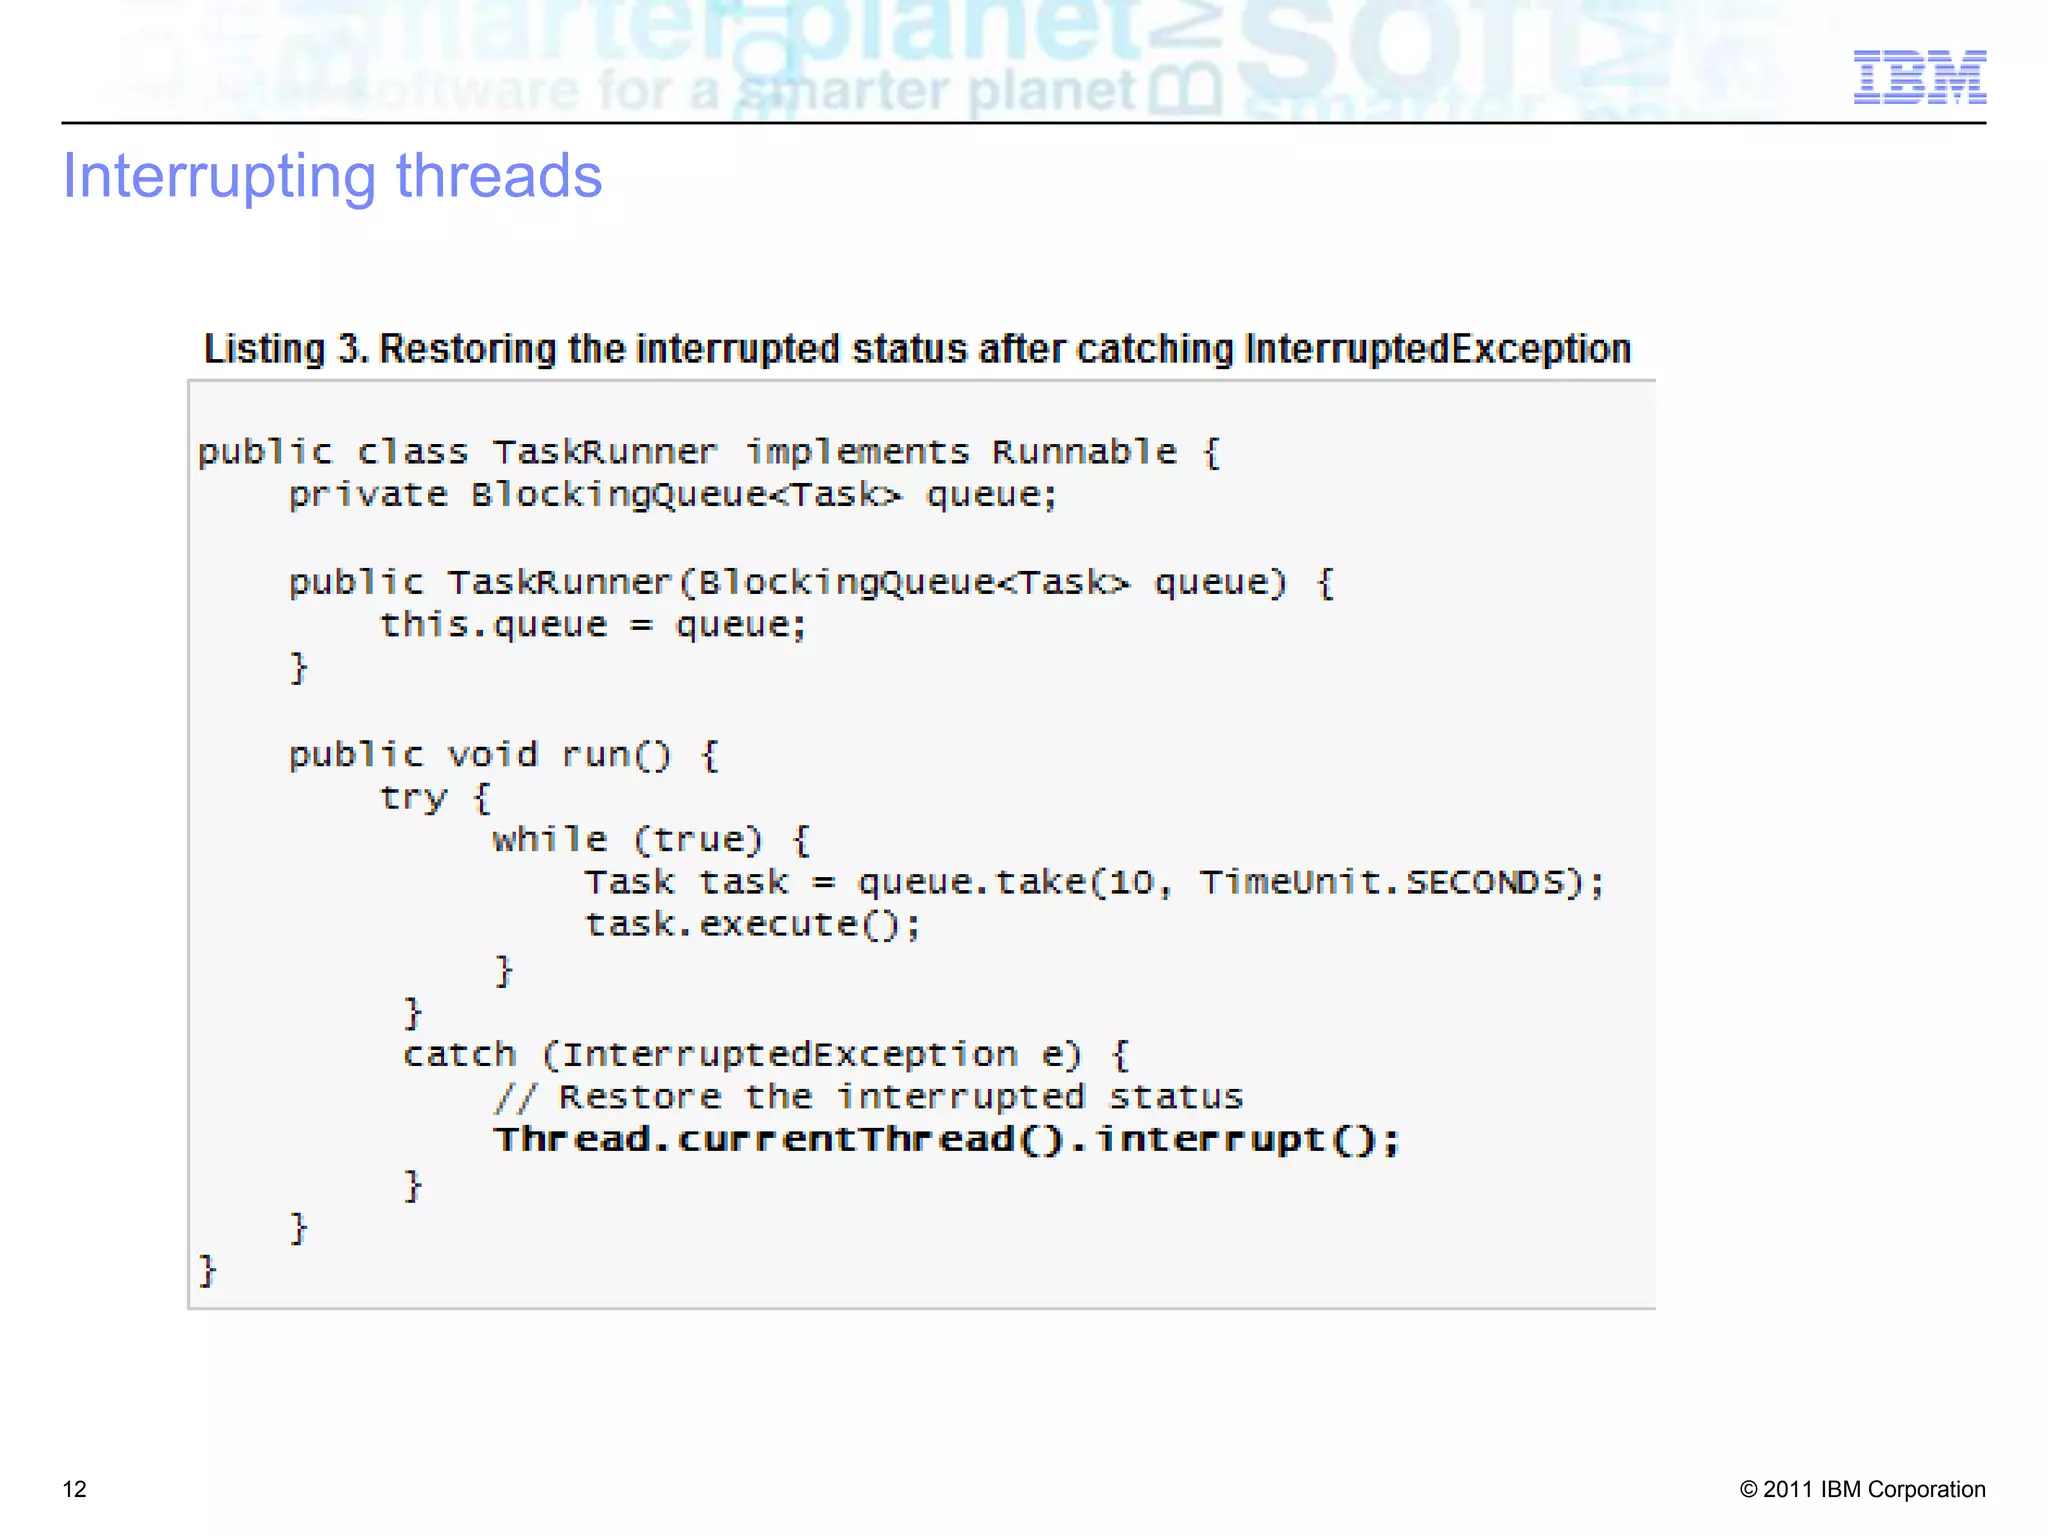
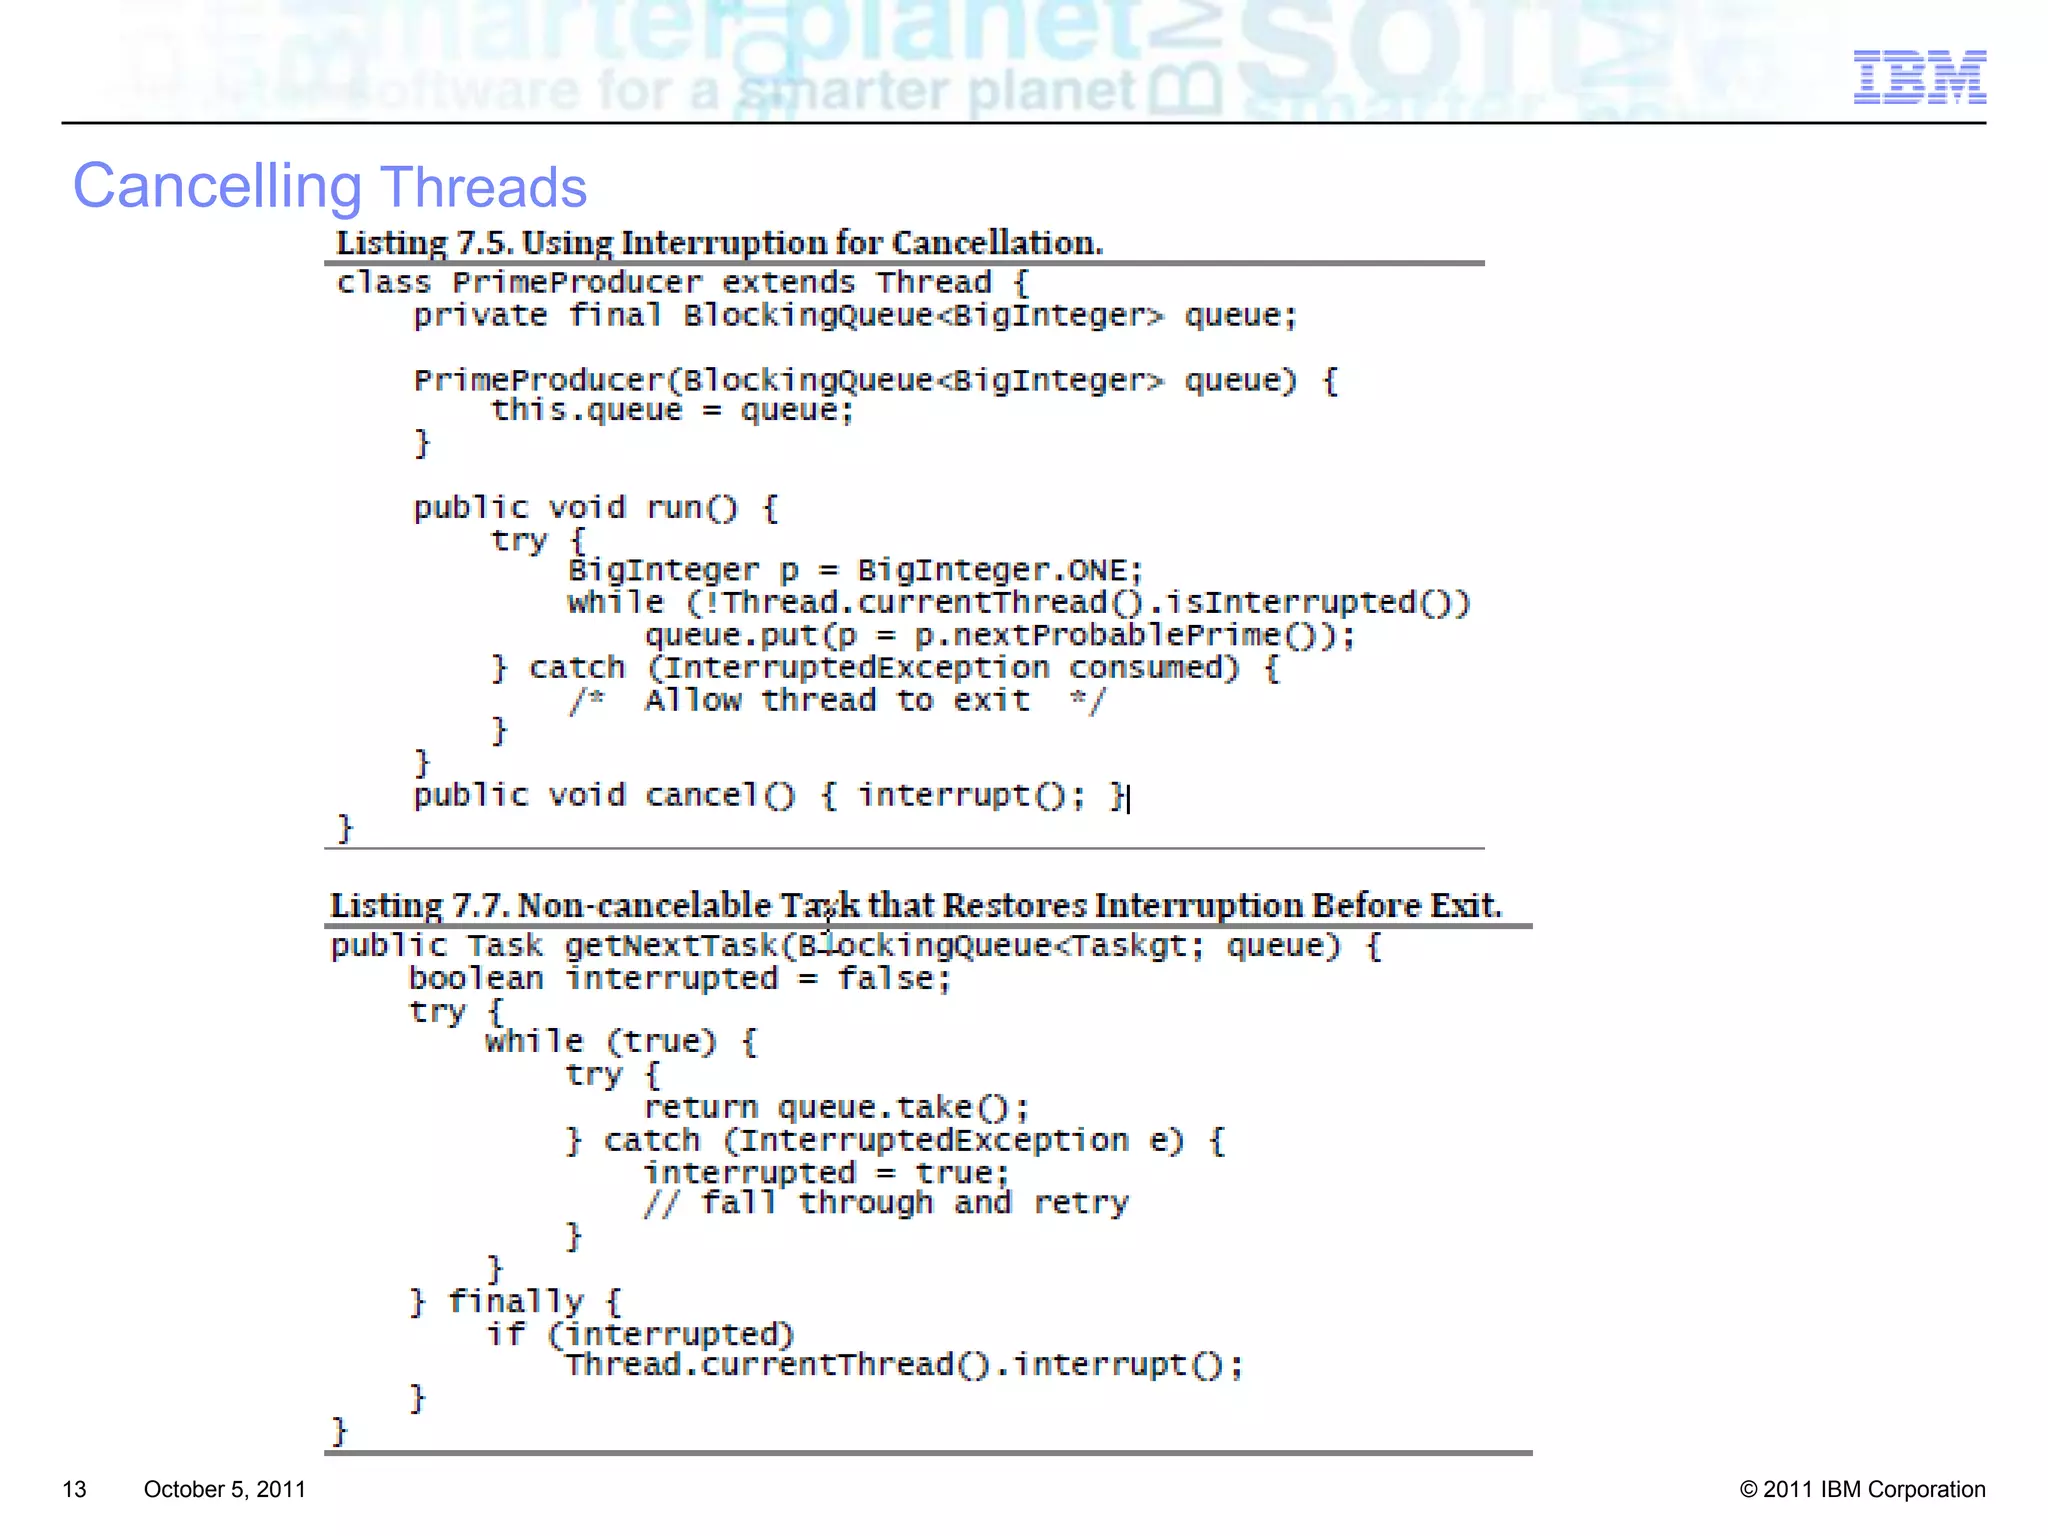
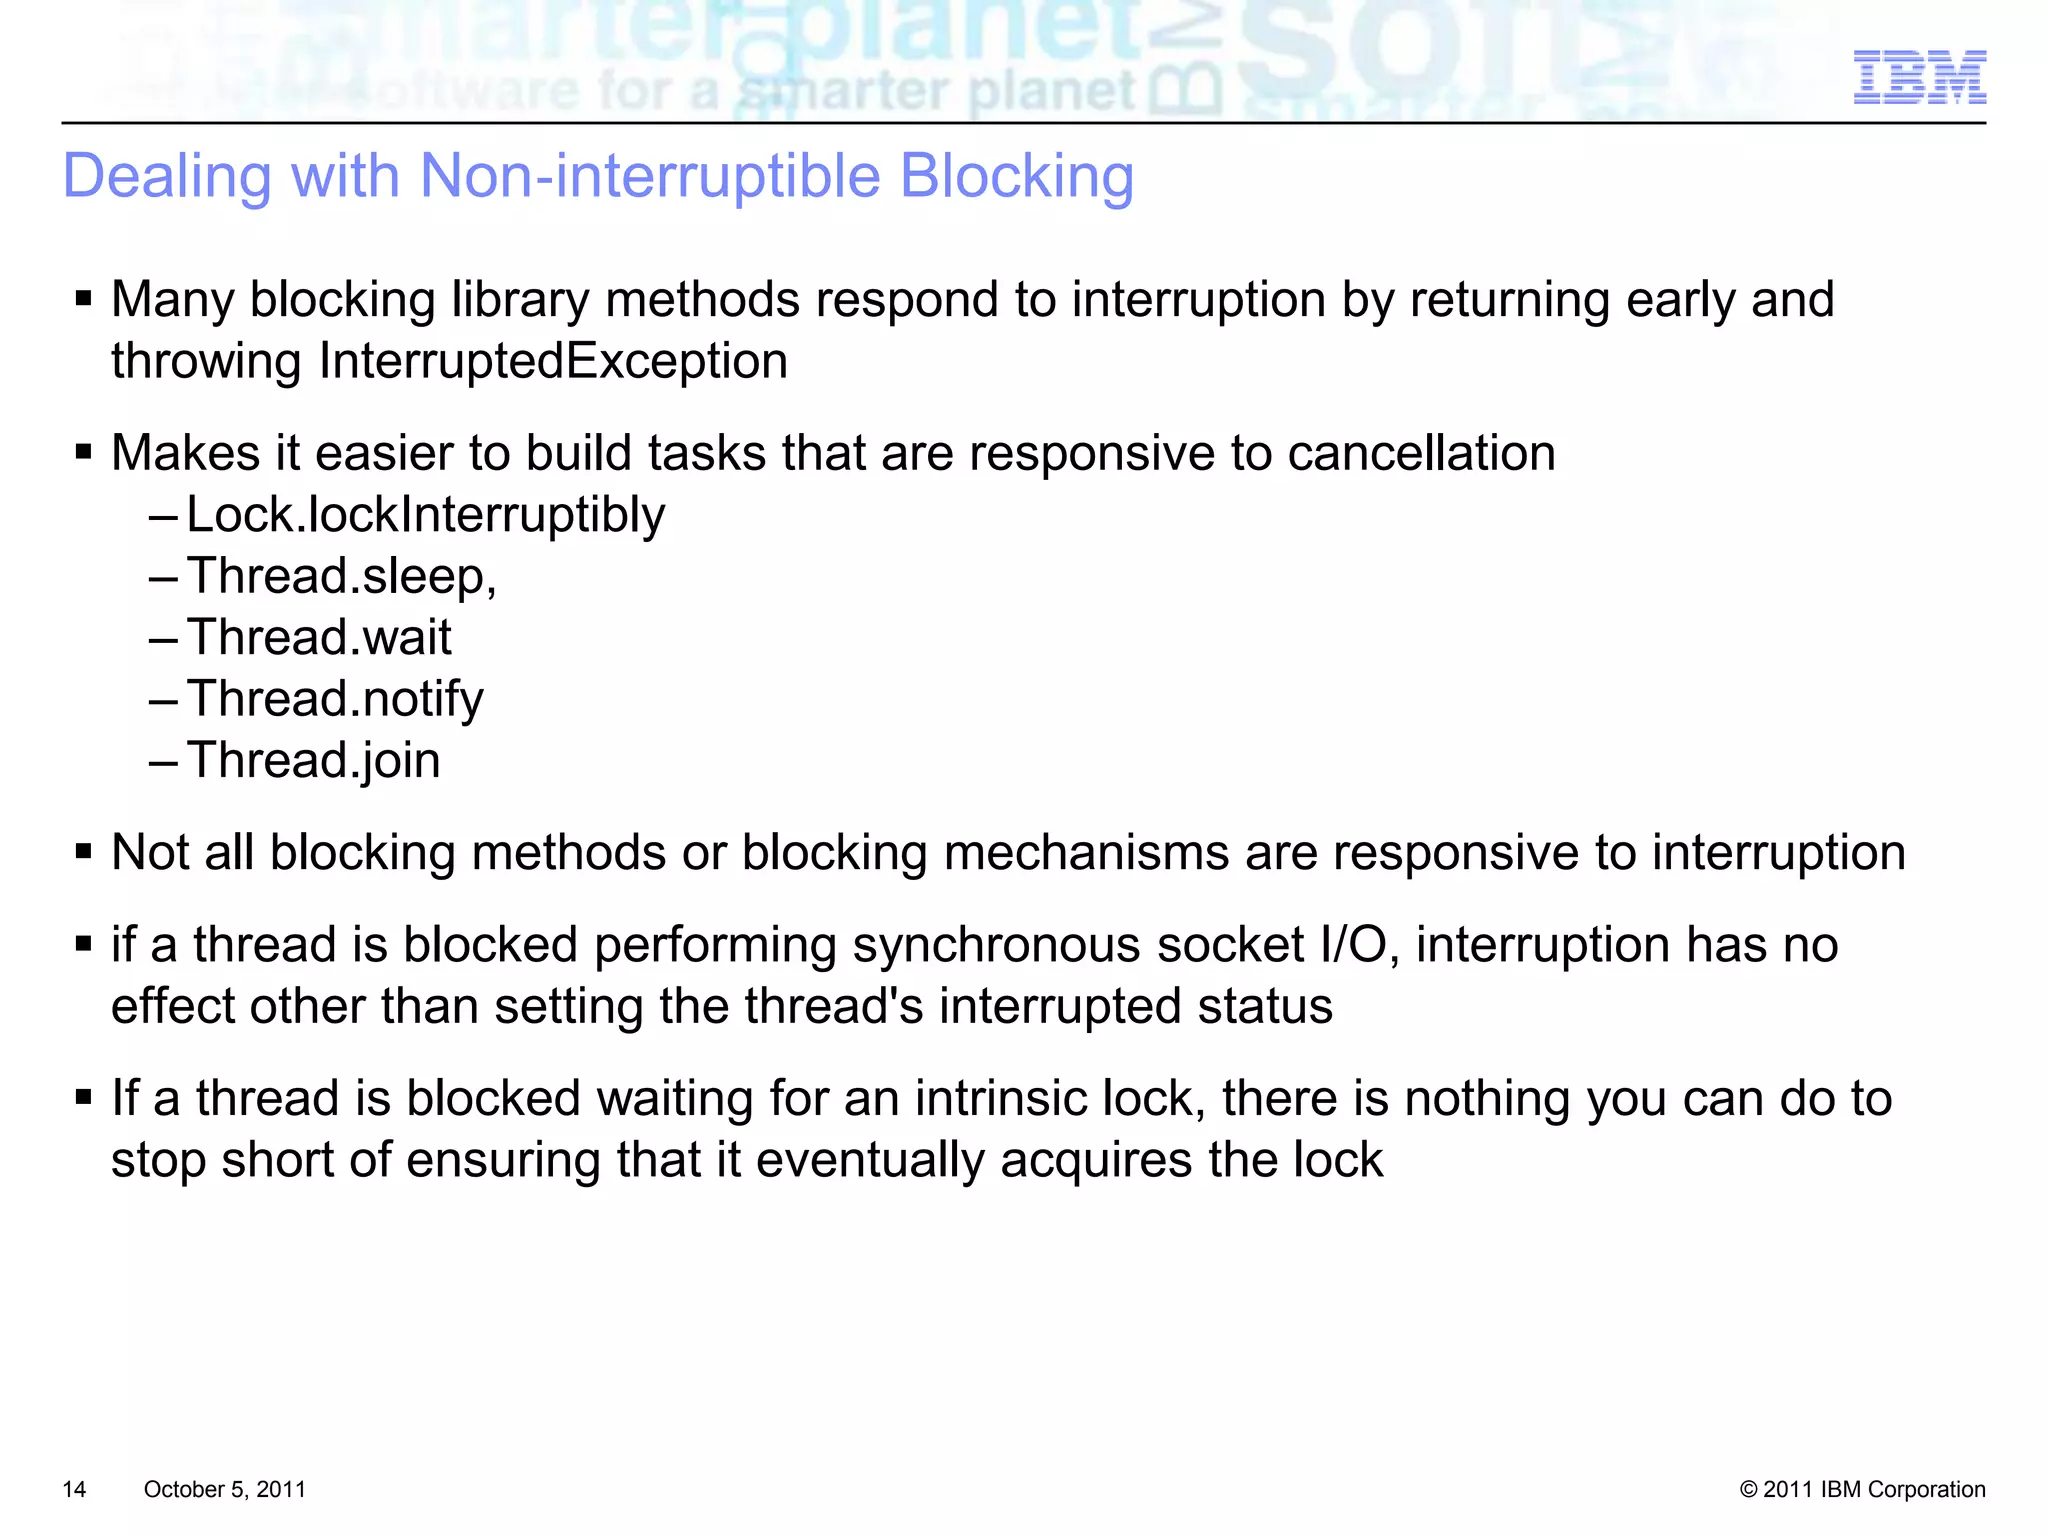
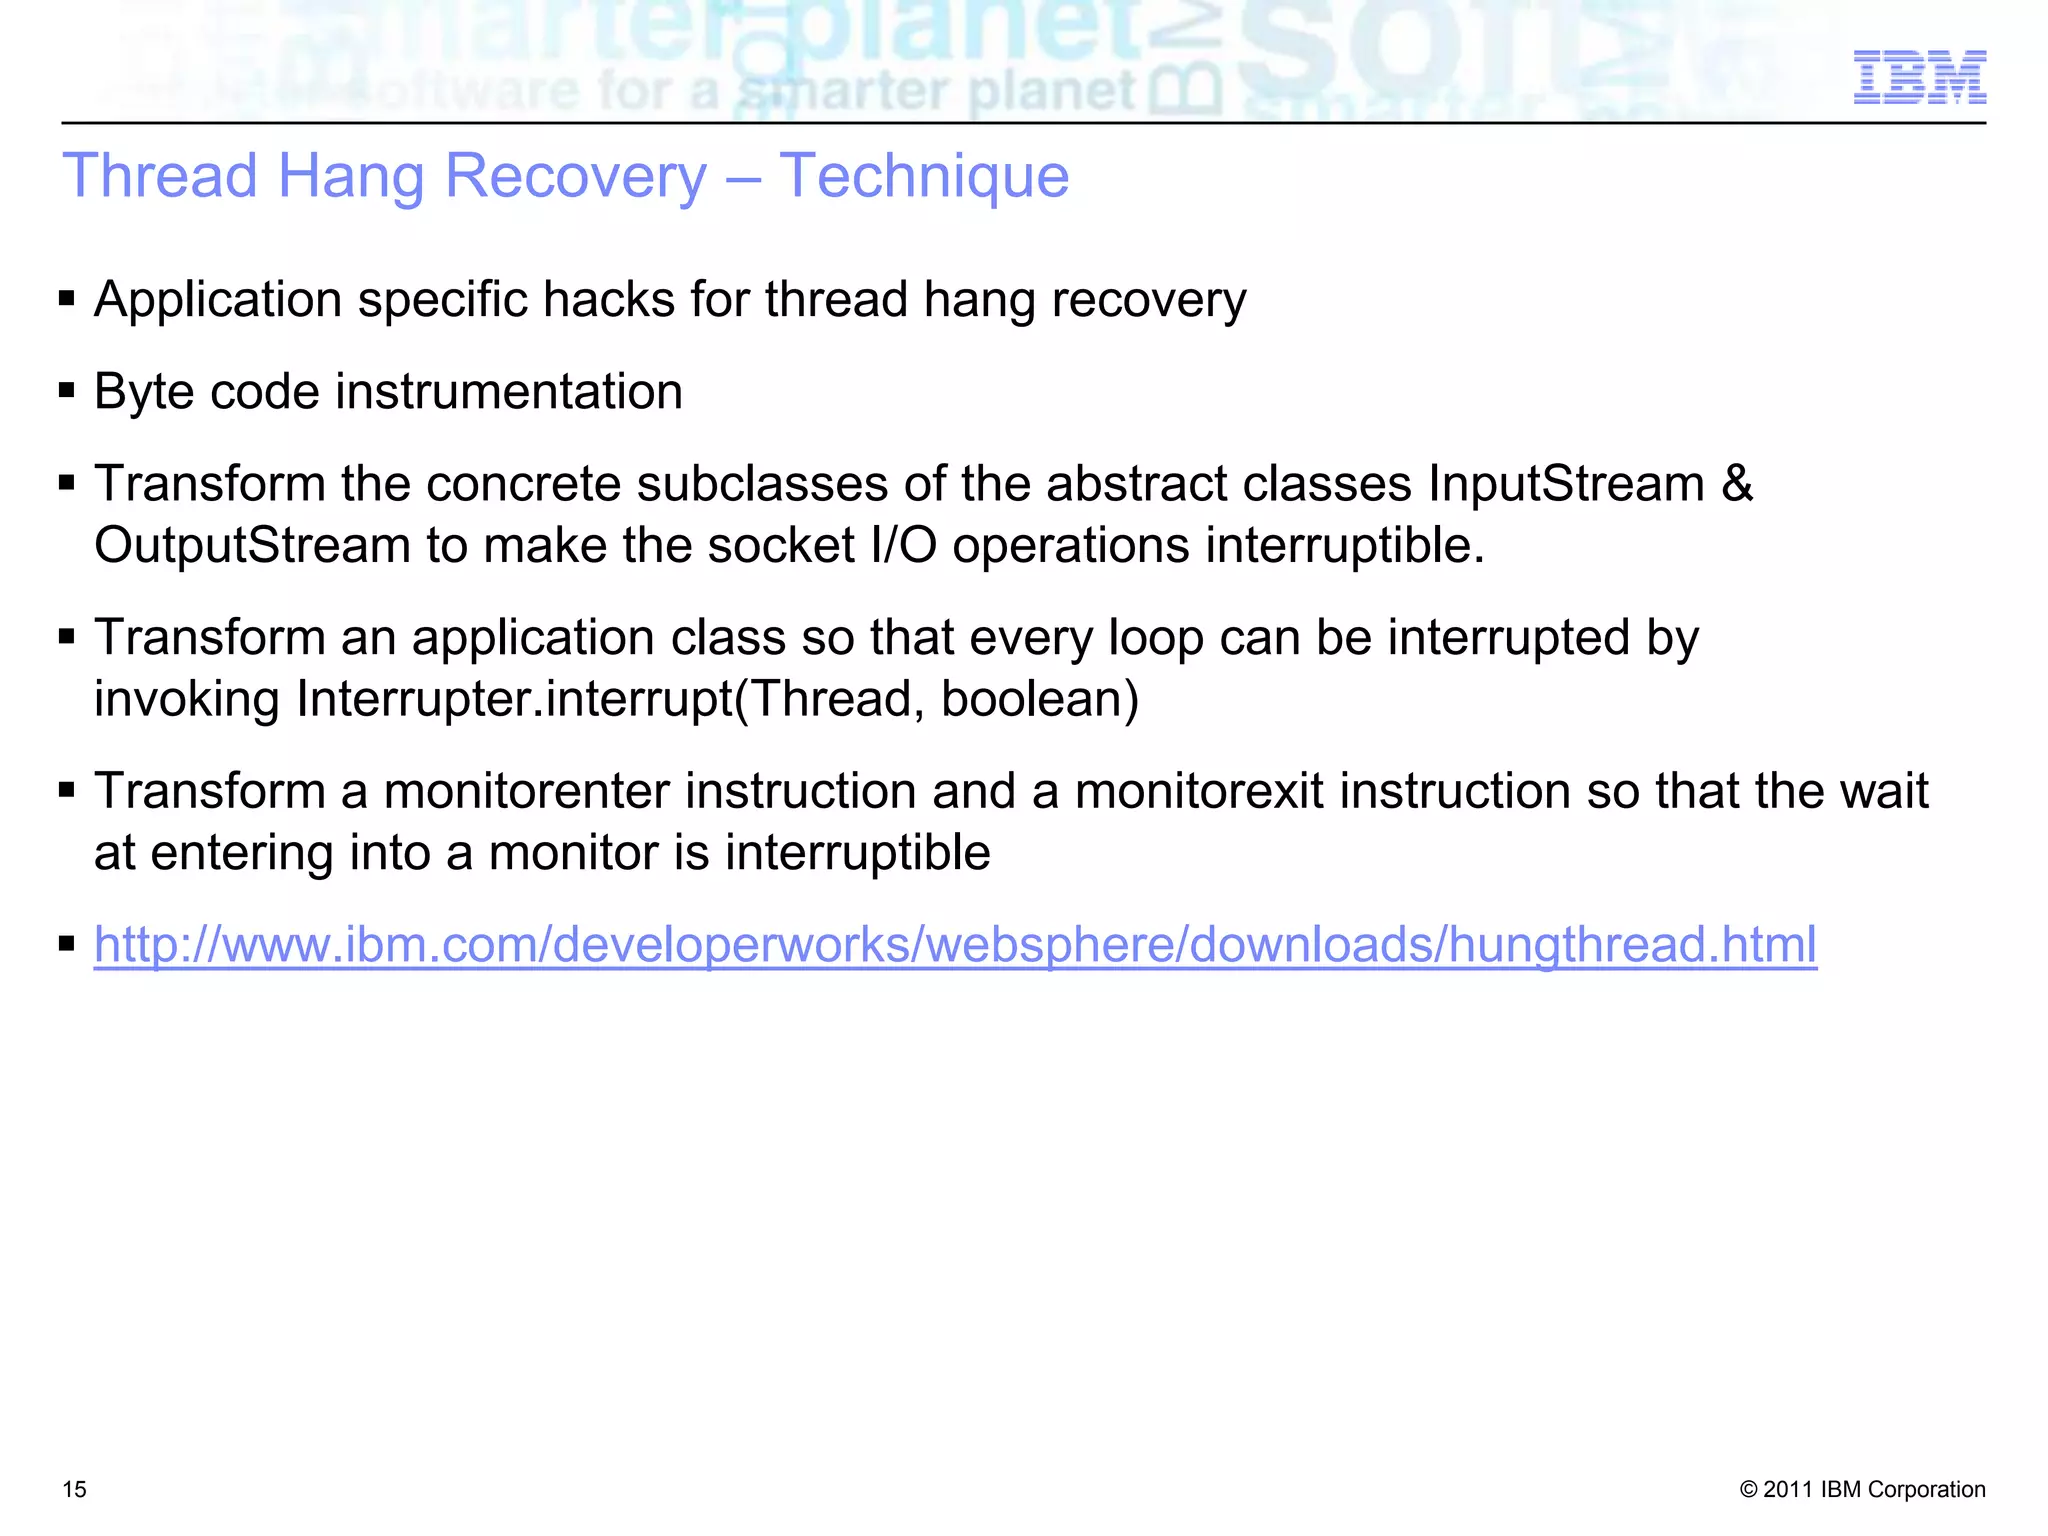
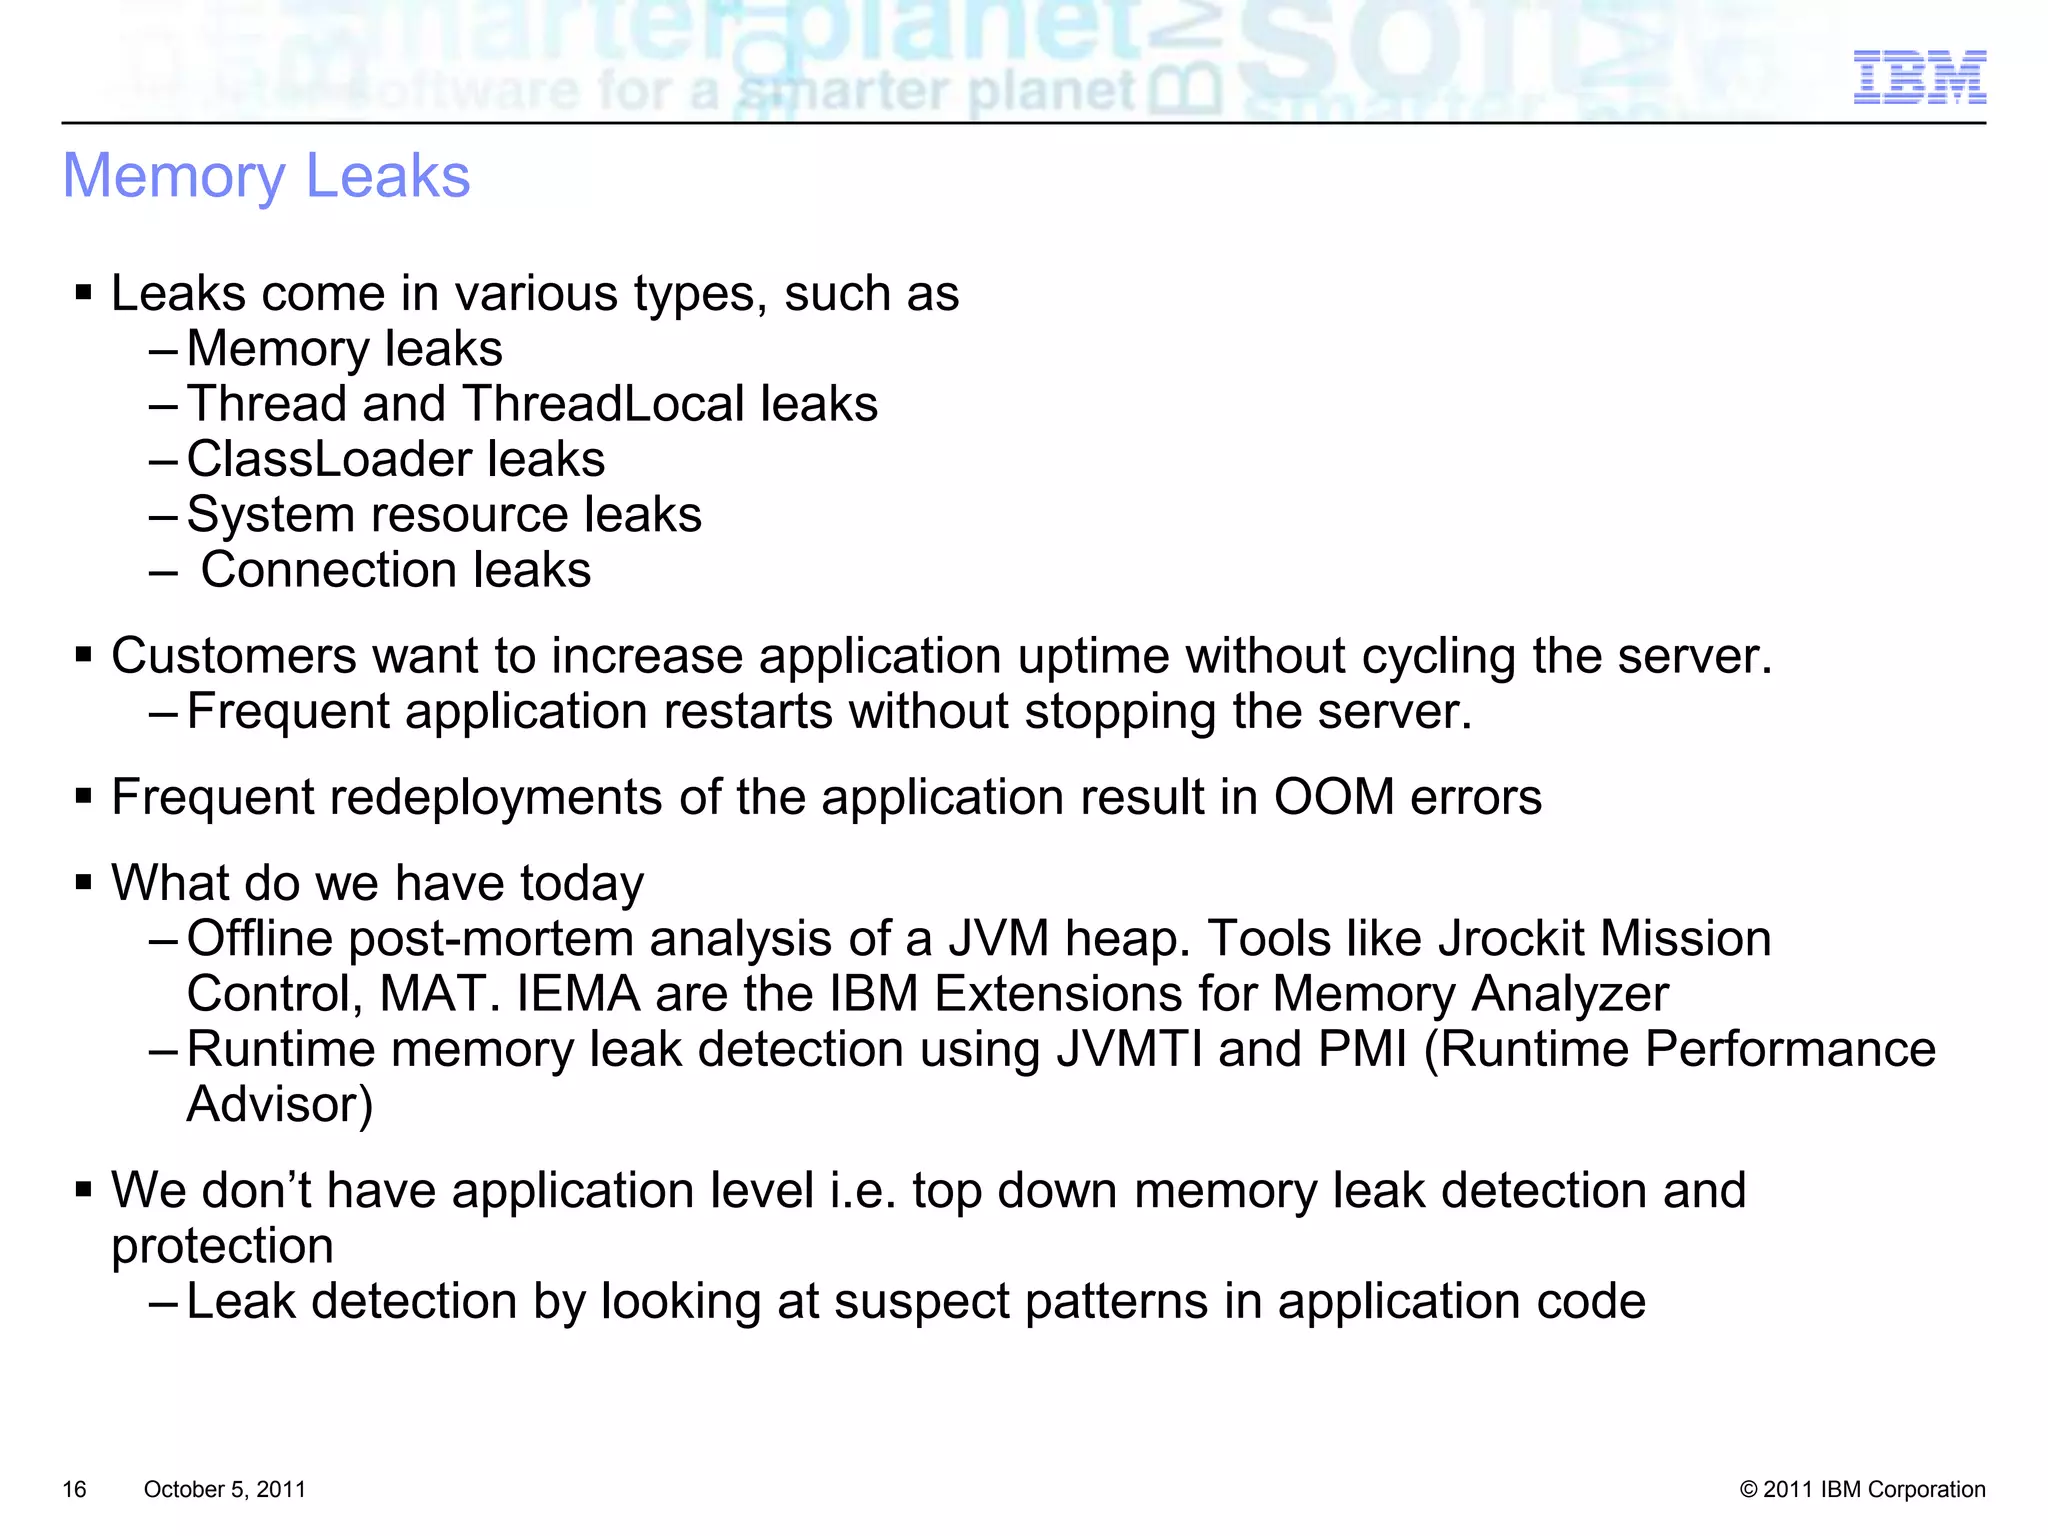
Rohit Kelapure is an IBM Advisory Software Engineer responsible for the resiliency of WebSphere Application Server. He is a team lead and architect of caching and data replication features in WebSphere. The presentation discusses server resiliency fundamentals, common JVM problems like thread hangs, memory leaks, and tooling for debugging such as Eclipse Memory Analyzer and Thread Dump Analyzer.


![[RakutenTechConf2013] [E-3] Financial Web System with Java EE 6](https://cdn.slidesharecdn.com/ss_thumbnails/techconf2013e3-131118234705-phpapp02-thumbnail.jpg?width=640&height=640&fit=bounds)


![Java Concurrency, A(nother) Peek Under the Hood [Code One 2019]](https://cdn.slidesharecdn.com/ss_thumbnails/oco19jcaluth-191015114641-thumbnail.jpg?width=640&height=640&fit=bounds)


![Coded Agents – with UiPath SDK + LangGraph [Virtual Hands-on Workshop]](https://cdn.slidesharecdn.com/ss_thumbnails/codedagentsdeck-251215155422-5497c599-thumbnail.jpg?width=640&height=640&fit=bounds)


