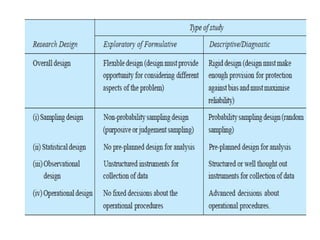
RESEARCH
DESIGN
Meaning
• After the problem is drafted, you need to
design the research project, popularly known
as the “research design”.
• The research design is the conceptual structure
within which research is conducted; it
constitutes the blueprint for the collection,
measurement and analysis of data.
• The design decisions happen to be in respect of:
(i) What is the study about?
(ii) Why is the study being made?
(iii) Where will the study be carried out?
(iv) What type of data is required?
(v) Where can the required data be found?
(vi) What periods of time will the study include?
(vii) What will be the sample design?
(viii) What techniques of data collection will be used?
(ix) How will the data be analysed?
(x) In what style will the report be prepared?
• Research design is split into the following parts:
(a) the sampling design which deals with the method of selecting
items to be observed for the given study;
(b) the observational design which relates to the conditions
under which the observations are to be made;
(c) the statistical design which concerns with the question of
how many items are to be observed and how the information
and data gathered are to be analysed; and
(d) the operational design which deals with the techniques by
which the procedures specified in the sampling, statistical and
observational designs can be carried out.
Operational Definition
• An operational definition, when applied to data collection, is a clear, concise detailed
definition of a measure.
• The need for operational definitions is fundamental when collecting all types of data.
• It is particularly important when a decision is being made about whether something
is correct or incorrect, or when a visual check is being made where there is room for
confusion.
• When collecting data, it is essential that everyone in the system has the same
understanding and collects data in the same way.
• Operational definitions should therefore be made before the collection of data
begins.
When is it used?
• Any time data is being collected, it is necessary to define how to collect the data.
Data that is not defined will usually be inconsistent and will give an erroneous result.
It is easy to assume that those collecting the data understand what and how to
complete the task. However, people have different opinions and views, and these
will affect the data collection. The only way to ensure consistent data collection is by
means of a detailed operational definition that eliminates ambiguity.
Important features of a research design
(i) It is a plan that specifies the sources and types of
information relevant to the research problem.
(ii) It is a strategy specifying which approach will be
used for gathering and analysing the data.
(iii) It also includes the time and cost budgets since
most studies are done under these two constraints.
• Research design must, at least, contain—
(a) a clear statement of the research problem;
(b) procedures and techniques to be used for
gathering information;
(c) the population to be studied;
(d) methods to be used in processing and
analysing data.
NEED FOR RESEARCH DESIGN
• It facilitates the smooth sailing of the various research
operations, thereby making research as efficient as possible
yielding maximal information with minimal expenditure of
effort, time and money
• Just as for better, economical and attractive construction of a
house, we need a blueprint ,well thought out and prepared by
an expert architect, similarly we need a research design or a
plan in advance of data collection and analysis for our research
project.
• Research design stands for advance planning of the methods to
be adopted for collecting the relevant data and the techniques
to be used in their analysis, keeping in view the objective of
the research and the availability of staff, time and money.
• Preparation of the research design should be
done with great care as any error in it may
upset the entire project.
• Research design has a great bearing on the
reliability of the results arrived at and as such
constitutes the firm foundation of the entire
edifice of the research work.
• It is imperative that an efficient and appropriate design must
be prepared before starting research operations.
• The design helps the researcher to organize his ideas in a form
whereby it will be possible for him to look for flaws and
inadequacies.
• Such a design can even be given to others for their comments
and critical evaluation.
• In the absence of such a course of action, it will be difficult for
the critic to provide a comprehensive review of the proposed
study
FEATURES OF A GOOD DESIGN
• The design which minimises bias and maximises the reliability
of the data collected and analysed
• The design which gives the smallest experimental error
• A design which yields maximal information and provides an
opportunity for considering many different aspects of a
problem is considered most appropriate and efficient design in
respect of many research problems.
• Thus, the question of good design is related to the purpose or
objective of the research problem and also with the nature of
the problem to be studied.
• A design may be quite suitable in one case, but
might not be suitable in the context of some
other research problem.
• One single design cannot serve the purpose of
all types of research problems.
• A research design appropriate for a particular
research problem, usually involves the
consideration of the following factors:
(i) the means of obtaining information;
(ii) the availability and skills of the researcher
and his staff, if any;
(iii) the objective of the problem to be studied;
(iv) the nature of the problem to be studied; and
(v) the availability of time and money for the
research work
• If the research study happens to be an exploratory,
wherein the major emphasis is on discovery of
ideas and insights,
– the research design most appropriate must be
flexible enough to permit the consideration of many
different aspects of a phenomenon.
• In case of descriptive studies, accuracy becomes a
major consideration
– A research design which minimises bias and
maximises the reliability of the evidence collected is
considered a good design.
• In studies involving the testing of a hypothesis of a causal
relationship between variables require a design which will permit
inferences about causality in addition to the minimisation of bias
and maximisation of reliability.
• But in practice it is the most difficult task to put a particular study in
a particular group, for a given research may have in it elements of
two or more of the functions of different studies.
• It is only on the basis of its primary function that a study can be
categorised either as an exploratory or descriptive or hypothesis-
testing study and accordingly the choice of a research design may be
made in case of a particular study.
• Besides, the availability of time, money, skills of the research staff
and the means of obtaining the information must be given due
weightage.
IMPORTANT CONCEPTS RELATING
TO RESEARCH DESIGN
Variable:
• A concept which can take on different
quantitative values is called a variable.
• As such the concepts like weight, height,
income are all examples of variables.
• Qualitative phenomena (or the attributes) are
also quantified on the basis of the presence or
absence of the concerning attribute(s).
Eg. Do you stay in hostel? Yes or No
Continuous Variables
• Phenomena which can take on quantitatively different values even in
decimal points are called ‘continuous variables’.
• But all variables are not continuous.
• A continuous variable is that which can assume any numerical value within
a specific range.
Discrete Variables
• If they can only be expressed in integer values, they are non-continuous
variables or in statistical language ‘discrete variables’
• A variable for which the individual values fall on the scale only with
distinct gaps is called a discrete variable
Example: Age, height are examples of continuous variable, but the number of
children is an example of non-continuous/discrete variable..
Dependent and Independent variables:
• If one variable depends upon the other
variable, it is termed as a dependent variable,
• The variable that is antecedent to the
dependent variable is termed as an
independent variable.
For instance, if we say that height depends upon
age, then height is a dependent variable and
age is an independent variable.
Extraneous variable
• Independent variables that are not related to the study, but may
affect the dependent variable are termed as extraneous variables.
• Suppose the researcher wants to test the hypothesis that there is a
relationship between effect of teaching on marks in social studies. In
this case teaching is an independent variable and marks in social
studies is a dependent variable. Intelligence may as well affect the
marks, but since it is not related to the purpose of the study
undertaken by the researcher, it will be termed as an extraneous
variable.
• Whatever effect is noticed on dependent variable as a result of
extraneous variable(s) is technically described as an ‘experimental
error’.
• A study must always be so designed that the effect upon the
dependent variable is attributed entirely to the independent
variable(s), and not to some extraneous variable or variables.
• Control:
The term ‘control’ is used when we design the study minimising
the effects of extraneous independent variables.
• Confounded relationship:
When the dependent variable is not free from the influence of
extraneous variable(s), the relationship between the dependent
and independent variables is said to be confounded by an
extraneous variable(s).
Research hypothesis:
• When a hypothesised relationship is to be tested by scientific
methods, it is termed as research hypothesis.
• The research hypothesis is a predictive statement that relates
an independent variable to a dependent variable.
• Usually a research hypothesis must contain, at least, one
independent and one dependent variable.
• Predictive statements which are not to be objectively verified
or the relationships that are assumed but not to be tested, are
not termed research hypotheses.
Experimental and non-experimental hypothesis-testing
research
• When the purpose of research is to test a research hypothesis,
it is termed as hypothesis-testing research.
• It can be of the experimental design or of the non-
experimental design.
• Experimental hypothesis-testing research
Research in which the independent variable is manipulated
• Non-Experimental hypothesis-testing research
A research in which an independent variable is not
manipulated.
• For instance, suppose a researcher wants to study whether
intelligence affects reading ability for a group of students and for
this purpose he randomly selects 50 students and tests their
intelligence and reading ability by calculating the coefficient of
correlation between the two sets of scores.
• This is an example of non-experimental hypothesis-testing research
because herein the independent variable, intelligence, is not
manipulated.
• But now suppose that our researcher randomly selects 50 students
from a group of students who are to take a course in statistics and
then divides them into two groups by randomly assigning 25 to
Group A, the usual studies programme, and 25 to Group B, the
special studies programme. At the end of the course, he administers
a test to each group in order to judge the effectiveness of the training
programme on the student’s performance-level.
• This is an example of experimental hypothesis-testing research
because in this case the independent variable, viz., the type of
training programme, is manipulated.
Experimental and control groups
• In an experimental hypothesis-testing research when a group is
exposed to usual conditions, it is termed a ‘control group’
• But when the group is exposed to some novel or special
condition, it is termed an ‘experimental group’.
• In the above illustration, the Group A can be called a control
group and the Group B an experimental group.
• If both groups A and B are exposed to special studies
programmes, then both groups would be termed ‘experimental
groups.’
• It is possible to design studies which include only
experimental groups or studies which include both
experimental and control groups
Treatments:
• The different conditions under which experimental and
control groups are put are usually referred to as
‘treatments’.
• In the above example, the two treatments are the usual
studies programme and the special studies programme.
• Similarly, if we want to determine through an experiment
the comparative impact of three varieties of fertilizers on
the yield of wheat, in that case the three varieties of
fertilizers will be treated as three treatments.
Experiment:
The process of examining the truth of a statistical hypothesis, relating
to some research problem, is known as an experiment.
For example, we can conduct an experiment to examine the usefulness
of a certain newly developed drug.
• Experiments can be of two types viz.,
(1) absolute experiment and
(2) comparative experiment.
Absolute Experiment:
• If we want to determine the impact of a fertilizer on the yield of a crop
Comparative Experiment
• If we want to determine the impact of one fertilizer as compared to the
impact of some other fertilizer
• Often, we undertake comparative experiments when we talk of designs of
experiments.
Experimental unit(s):
• The pre-determined plots or the blocks, where different treatments are
used, are known as experimental units. Such experimental units must be
selected (defined) very carefully.
DIFFERENT RESEARCH DESIGNS
(1)Research design in case of exploratory
research studies
(2)Research design in case of descriptive
research studies
(3)Research design in case of hypothesis-testing
research studies.
Research design in case of exploratory/
formulative research studies
• The main purpose of is that of formulating a problem for more
precise investigation or of developing the working hypotheses.
• The major emphasis in such studies is on the discovery of ideas
and insights.
• The research design must be flexible enough to provide
opportunity for considering different aspects of a problem under
study.
• Inbuilt flexibility in research design is needed because the
research problem, broadly defined initially, is transformed into
one with more precise meaning in exploratory studies, which
fact may necessitate changes in the research procedure for
gathering relevant data.
• Generally, the following three methods in the
context of research design for such studies are
talked about:
(a) the survey of concerning literature;
(b)the experience survey and
(c)the analysis of ‘insight-stimulating’ examples.
Survey of Concerning Literature
• The survey of concerning literature happens to be the most
simple and fruitful method of formulating precisely the
research problem or developing hypothesis.
• Hypotheses stated by earlier workers may be reviewed and
their usefulness be evaluated as a basis for further research.
• It may also be considered whether the already stated
hypotheses suggest new hypothesis.
• In this way the researcher should review and build upon the
work already done by others, but in cases where hypotheses
have not yet been formulated, his task is to review the
available material for deriving the relevant hypotheses from it.
Experience survey
• Experience survey means the survey of people who have had
practical experience with the problem to be studied.
• The objective is to obtain insight into the relationships between
variables and new ideas relating to the research problem.
• People who are competent and can contribute new ideas may be
carefully selected as respondents to ensure a representation of
different types of experience.
• The researcher must prepare an interview schedule for the
systematic questioning of informants.
• But the interview must ensure flexibility in the sense that the
respondents should be allowed to raise issues and questions which
the investigator has not previously considered.
• Generally, the experience collecting interview is likely to be long
and may last for few hours.
• Hence, it is often considered desirable to send a copy of the
questions to be discussed to the respondents well in advance.
• This will also give an opportunity to the respondents for doing
some advance thinking over the various issues involved so
that, at the time of interview, they may be able to contribute
effectively.
• Thus, an experience survey may enable the researcher to
define the problem more concisely and help in the formulation
of the research hypothesis.
• This survey may as well provide information about the
practical possibilities for doing different types of research.
Analysis of ‘insight-stimulating’ examples
• This includes the study of one or a few situations.
• It is focused on complex situations and problems; this kind of
situations occur when the interrelations of several individuals are
important.
• In this method, some units are analyzed; each unit is called Case.
• Study of relationships between different factors of each case is
more important.
• It is specifically helpful in situations where there is little
experience to serve as a guide.
• Attitude of the investigator, the intensity of the investigator and the
ability of the researcher to draw together diverse information into a
unified interpretation are the main features which make this
method a suitable procedure for evoking insights.
• One can mention few examples of ‘insight-stimulating’ cases such as
the reactions of strangers, the reactions of marginal individuals, the
study of individuals who are in transition from one stage to another,
the reactions of individuals from different social strata and the like.
• In general, cases that provide sharp contrasts or have striking features
are considered relatively more useful while adopting this method of
hypotheses formulation.
• Thus, in an exploratory of formulative research study which merely
leads to insights or hypotheses, whatever method or research design
outlined above is adopted, the only thing essential is that it must
continue to remain flexible so that many different facets of a problem
may be considered as and when they arise and come to the notice of
the researcher.
Research design in case of descriptive research
studies:
• Descriptive research studies are those studies which are
concerned with describing the characteristics of a particular
individual, or of a group
• In descriptive studies, the researcher must be able to define
clearly, what he wants to measure and must find adequate
methods for measuring it along with a clear cut definition of
‘population’ he wants to study.
• Since the aim is to obtain complete and accurate information
in the said studies, the procedure to be used must be carefully
planned.
• The research design must make enough provision for
protection against bias and must maximise reliability, with due
concern for the economical completion of the research study.
• The design in such studies must be rigid and not flexible and
must focus attention on the following:
(a) Formulating the objective of the study (what the study is
about and why is it being made?)
(b) Designing the methods of data collection (what techniques of
gathering data will be adopted?)
(c) Selecting the sample (how much material will be needed?)
(d) Collecting the data (where can the required data be found and
with what time period should the data be related?)
(e) Processing and analysing the data.
(f) Reporting the findings.
• In a descriptive study the first step is to specify the objectives
with sufficient precision to ensure that the data collected are
relevant.
• If this is not done carefully, the study may not provide the
desired information.
• Then comes the question of selecting the methods by which
the data are to be obtained.
• In other words, techniques for collecting the information must
be devised.
• While designing data-collection procedure, adequate
safeguards against bias and unreliability must be ensured.
• Whichever method is selected, questions must be well
examined and be made unambiguous; interviewers must be
instructed not to express their own opinion; observers must be
trained so that they uniformly record a given item of
behaviour.
• It is always desirable to pretest the data collection instruments
before they are finally used for the study purposes.
• In other words, we can say that “structured instruments” are
used in such studies.
• In most of the descriptive the researcher takes out sample(s)
and then wishes to make statements about the population on
the basis of the sample analysis or analyses.
• The problem of designing samples should be tackled in such a
fashion that the samples may yield accurate information with a
minimum amount of research effort.
• Usually one or more forms of probability sampling, or what is
often described as random sampling, are used
• To obtain data free from errors, it is necessary to
supervise closely the staff of field workers as they collect
and record information.
• Checks may be set up to ensure that the data collecting
staff perform their duty honestly and without prejudice.
• “As data are collected, they should be examined for
completeness, comprehensibility, consistency and
reliability.”
• The data collected must be processed and analysed. This includes
steps like coding the interview replies, observations, etc.; tabulating
the data; and performing several statistical computations.
• To the extent possible, the processing and analysing procedure
should be planned in detail before actual work is started.
• This will prove economical in the sense that the researcher may
avoid unnecessary labour such as preparing tables for which he later
finds he has no use or on the other hand, re-doing some tables
because he failed to include relevant data.
• Coding should be done carefully to avoid error in coding and
for this purpose the reliability of coders needs to be checked.
• Similarly, the accuracy of tabulation may be checked by
having a sample of the tables re-done.
• In case of mechanical tabulation the material (i.e., the
collected data or information) must be entered on appropriate
cards which is usually done by punching holes
corresponding to a given code.
• The accuracy of punching is to be checked and ensured.
Finally, statistical computations are needed and as such
averages, percentages and various coefficients must be worked
out.
• Probability and sampling analysis may as well be used.
• The appropriate statistical operations, along with the use of
appropriate tests of significance should be carried out to
safeguard the drawing of conclusions concerning the study.
• Reporting the findings: This is the task of communicating the
findings to others and the researcher must do it in an efficient
manner.
• The layout of the report needs to be well planned so that all things
relating to the research study may be well presented in simple and
effective style.
• Thus, the research design in case of descriptive/diagnostic studies is
a comparative design throwing light on all points narrated above and
must be prepared keeping in view the objective(s) of the study and
the resources available.
• However, it must ensure the minimisation of bias and maximisation
of reliability of the evidence collected.
• The said design can be appropriately referred to as a survey design
since it takes into account all the steps involved in a survey
concerning a phenomenon to be studied.
Research design in case of hypothesis-
testing research studies:
• Hypothesis-testing research studies are those where the
researcher tests the hypotheses of causal relationships
between variables.
• Such studies require procedures that will not only reduce
bias and increase reliability, but will permit drawing
inferences about causality.
• Usually experiments meet this requirement.
• Hence, when we talk of research design in such studies,
we often mean the design of experiments
• Professor R.A. Fisher’s name is associated with experimental
designs.
• As such the study of experimental designs has its origin in
agricultural research. Professor Fisher found that by dividing
agricultural fields or plots into different blocks and then by
conducting experiments in each of these blocks, whatever
information is collected and inferences drawn from them, happens to
be more reliable.
• This fact inspired him to develop certain experimental designs for
testing hypotheses concerning scientific investigations.
BASIC PRINCIPLES OF EXPERIMENTAL DESIGNS
• Professor Fisher has enumerated three
principles of experimental designs:
(1) the Principle of Replication;
(2) the Principle of Randomization; and
(3) The Principle of Local Control.
Principle of Replication
• Here, the experiment should be repeated more than once.
• Thus, each treatment is applied in many experimental
units instead of one.
• By doing so the statistical accuracy of the experiments is
increased.
• For example, suppose we are to examine the effect of two
varieties of rice. For this purpose we may divide the field
into two parts and grow one variety in one part and the
other variety in the other part. We can then compare the
yield of the two parts and draw conclusion on that basis.
• But if we are to apply the principle of replication to this
experiment, then we first divide the field into several parts,
grow one variety in half of these parts and the other variety in
the remaining parts. We can then collect the data of yield of
the two varieties and draw conclusion by comparing the same.
The entire experiment can even be repeated several times for
better results. The result so obtained will be more reliable in
comparison to the conclusion we draw without applying the
principle of replication.
• Replication is introduced in order to increase the precision of a
study; that is to say, to increase the accuracy with which the
main effects and interactions can be estimated.
Principle of Randomization
• This principle indicates that we should design or plan the
experiment in such a way that the variations caused by
extraneous factors can all be combined under the general
heading of “chance.”
• The Principle of Randomization provides protection, when we
conduct an experiment, against the effect of extraneous factors
by randomization.
• For instance, if we grow one variety of rice, say, in the first
half of the parts of a field and the other variety is grown in the
other half, then it is just possible that the soil fertility may be
different in the first half in comparison to the other half. If this
is so, our results would not be realistic.
• In such a situation, we may assign the variety of rice to be
grown in different parts of the field on the basis of some
random sampling technique i.e., we may apply randomization
principle and protect ourselves against the effects of the
extraneous factors (soil fertility differences in the given case).
As such, through the application of the principle of
randomization, we can have a better estimate of the
experimental error.
• Whatever effect is noticed on dependent variable as a result of extraneous
variable(s) is technically described as an ‘experimental error’.
Principle of Local Control
• Under it the extraneous factor is made to vary deliberately
over as wide range as necessary and this needs to be done in
such a way that the variability it causes can be measured and
hence eliminated from the experimental error.
• This means that we should plan the experiment in a manner
that the total variability of the data is divided into three
components attributed to treatments (varieties of rice in our
case), the extraneous factor (soil fertility in our case) and
experimental error.
• Whatever effect is noticed on dependent variable as a result of extraneous variable(s) is
technically described as an ‘experimental error’.
• In other words, according to the principle of local control, we first
divide the field into several homogeneous parts, known as blocks,
and then each such block is divided into parts equal to the number
of treatments.
• Then the treatments are randomly assigned to these parts of a
block. Dividing the field into several homogenous parts is known
as ‘blocking’.
• In general, blocks are the levels at which we hold an extraneous
factor fixed, so that we can measure its contribution to the total
variability of the data
• In brief, through the principle of local control we can eliminate the
variability due to extraneous factor(s) from the experimental error.
Important Experimental Designs
• Experimental design refers to the framework or structure of an
experiment and as such there are several experimental designs.
• We can classify experimental designs into two broad
categories, viz.,
(i) informal experimental designs and
(ii) formal experimental designs.
(iii) Informal experimental designs are those designs that
normally use a less sophisticated form of analysis based on
differences in magnitudes,
(iv) formal experimental designs offer relatively more control
and use precise statistical procedures for analysis.
Important experiment designs are as follows:
(a) Informal experimental designs:
(i) Before-and-after without control design.
(ii) After-only with control design.
(iii) Before-and-after with control design.
(b) Formal experimental designs:
(i) Completely randomized design (C.R. Design).
(ii) Randomized block design (R.B. Design).
(iii) Latin square design (L.S. Design).
(iv) Factorial designs.
Before-and-after without control design
• In such a design a single test group or area is
selected and the dependent variable is
measured before the introduction of the
treatment.
• The treatment is then introduced and the
dependent variable is measured again after the
treatment has been introduced.
• The effect of the treatment would be equal to
the level of the phenomenon after the
treatment minus the level of the phenomenon
before the treatment.
The design can be represented thus:
The main difficulty of such a design is that with the passage of
time considerable extraneous variations may be there in its
treatment effect.
After-only with control design:
• In this design two groups or areas (test area and
control area) are selected and the treatment is
introduced into the test area only.
• The dependent variable is then measured in both the
areas at the same time.
• Treatment impact is assessed by subtracting the value
of the dependent variable in the control area from its
value in the test area.
• This can be exhibited in the following form:
• The basic assumption in such a design is that the two areas are identical
with respect to their behaviour towards the phenomenon considered.
• If this assumption is not true, there is the possibility of extraneous
variation entering into the treatment effect.
• However, data can be collected in such a design without the
introduction of problems with the passage of time.
• In this respect the design is superior to before-and-after without control
design.
Before-and-after with control design:
• In this design two areas are selected and the
dependent variable is measured in both the areas
for an identical time-period before the treatment.
• The treatment is then introduced into the test area
only, and the dependent variable is measured in
both for an identical time-period after the
introduction of the treatment.
• The treatment effect is determined by subtracting
the change in the dependent variable in the control
area from the change in the dependent variable in
test area.
• This design can be shown in this way:
• This design is superior to the above two designs for
the simple reason that it avoids extraneous variation
resulting both from the passage of time and from
non-comparability of the test and control areas.
• But at times, due to lack of historical data, time or a
comparable control area, we should prefer to select
one of the first two informal designs stated above.
Completely randomized design (C.R.
design):
• Involves only two principles viz., the principle of replication
and the principle of randomization of experimental designs.
• It is the simplest possible design and its procedure of
analysis is also easier.
• The essential characteristic of the design is that subjects are
randomly assigned to experimental treatments (or vice-
versa).
• For instance, if we have 10 subjects and if we wish to test 5
under treatment A and 5 under treatment B, the
randomization process gives every possible group of 5
subjects selected from a set of 10 an equal opportunity of
being assigned to treatment A and treatment B.
• Such a design is generally used when
experimental areas happen to be homogeneous.
• Technically, when all the variations due to
uncontrolled extraneous factors are included
under the heading of chance variation, we refer
to the design of experiment as C.R. design.
(i) Two-group simple randomized design:
• In a two-group simple randomized design, first of all the
population is defined and then from the population a
sample is selected randomly.
• Further, requirement of this design is that items, after
being selected randomly from the population, be
randomly assigned to the experimental and control
groups (Such random assignment of items to two groups
is technically described as principle of randomization).
• Thus, this design yields two groups as representatives of
the population.
• In a diagram form this design can be shown in this way:
• Since in the sample randomized design the elements
constituting the sample are randomly drawn from the same
population and randomly assigned to the experimental and
control groups, it becomes possible to draw conclusions on the
basis of samples applicable for the population.
• The two groups (experimental and control groups) of such a
design are given different treatments of the independent
variable.
• This design of experiment is quite common in research studies
concerning behavioural sciences.
• The merit of such a design is that it is simple and randomizes
the differences among the sample items.
• But the limitation of it is that the individual differences among
those conducting the treatments are not eliminated, i.e., it does
not control the extraneous variable and as such the result of
the experiment may not depict a correct picture.
An example.
• Suppose the researcher wants to compare two groups of
students who have been randomly selected and randomly
assigned.
• Two different treatments viz., the usual training and the
specialised training are being given to the two groups.
• The researcher hypothesises greater gains for the group
receiving specialised training. To determine this, he tests each
group before and after the training, and then compares the
amount of gain for the two groups to accept or reject his
hypothesis.
• This is an illustration of the two-groups randomized design,
wherein individual differences among students are being
randomized. But this does not control the differential effects of
the extraneous independent variables (in this case, the
individual differences among those conducting the training
programme).
Random replications design:
• The limitation of the two-group randomized design is usually
eliminated within the random replications design.
• In the illustration just cited above, the teacher differences on the
dependent variable were ignored, i.e., the extraneous variable was
not controlled.
• But in a random replications design, the effect of such differences
are minimised (or reduced) by providing a number of repetitions for
each treatment. Each repetition is technically called a ‘replication’.
• Random replication design serves two purposes viz., it provides
controls for the differential effects of the extraneous independent
variables and secondly, it randomizes any individual differences
among those conducting the treatments.
• Diagrammatically we can illustrate the random replications design
thus:
• From the diagram it is clear that there are two populations in
the replication design.
• The sample is taken randomly from the population available
for study and is randomly assigned to, say, four experimental
and four control groups.
• Similarly, sample is taken randomly from the population
available to conduct experiments (because of the eight groups
eight such individuals be selected) and the eight individuals so
selected should be randomly assigned to the eight groups.
• Generally, equal number of items are put in each group so that
the size of the group is not likely to affect the result of the
study.
• Variables relating to both population characteristics are
assumed to be randomly distributed among the two groups.
• Thus, this random replication design is, in fact, an extension of
the two-group simple randomized design.
• Randomized block design (R.B. design) is an improvement
over the C.R. design.
• In the R.B. design the principle of local control can be applied
along with the other two principles of experimental designs.
• In the R.B. design, subjects are first divided into groups,
known as blocks, such that within each group the subjects are
relatively homogeneous in respect to some selected variable.
• The variable selected for grouping the subjects is one that is
believed to be related to the measures to be obtained in respect
of the dependent variable.
• The number of subjects in a given block would be equal to the
number of treatments and one subject in each block would be
randomly assigned to each treatment.
• In general, blocks are the levels at which we hold the
extraneous factor fixed, so that its contribution to the
total variability of data can be measured.
• The main feature of the R.B. design is that in this
each treatment appears the same number of times in
each block.
• The R.B. design is analysed by the two-way analysis
of variance (two-way ANOVA)* technique.
An Example
• Suppose four different forms of a standardised test in
statistics were given to each of five students (selected
one from each of the five I.Q. blocks) and following are
the scores which they obtained.
• If each student separately randomized the order in
which he or she took the four tests (by using random
numbers or some similar device), we refer to the design
of this experiment as a R.B. design.
• The purpose of this randomization is to take care of
such possible extraneous factors (say as fatigue) or
perhaps the experience gained from repeatedly taking
the test.
Latin square design (L.S. design)
• Latin square design (L.S. design) is an experimental design
very frequently used in agricultural research.
• The conditions under which agricultural investigations are
carried out are different from those in other studies for nature
plays an important role in agriculture.
• For instance, an experiment has to be made through which the
effects of five different varieties of fertilizers on the yield of a
certain crop, say wheat, it to be judged.
• In such a case the varying fertility of the soil in different
blocks in which the experiment has to be performed
must be taken into consideration; otherwise the results
obtained may not be very dependable because the output
happens to be the effect not only of fertilizers, but it may
also be the effect of fertility of soil.
• Similarly, there may be impact of varying seeds on the
yield. To overcome such difficulties, the L.S. design is
used when there are two major extraneous factors such
as the varying soil fertility and varying seeds.
• The Latin-square design is one wherein each fertilizer,
in our example, appears five times but is used only
once in each row and in each column of the design.
• In other words, the treatments in a L.S. design are so
allocated among the plots that no treatment occurs
more than once in any one row or any one column.
• The two blocking factors may be represented through
rows and columns (one through rows and the other
through columns).
• The following is a diagrammatic form of such a design
in respect of, say, five types of fertilizers, viz., A, B, C,
D and E and the two blocking factor viz., the varying
soil fertility and the varying seeds:
• The above diagram clearly shows that in a L.S.
design the field is divided into as many blocks
as there are varieties of fertilizers and then
each block is again divided into as many parts
as there are varieties of fertilizers in such a
way that each of the fertilizer variety is used in
each of the block (whether column-wise or
row-wise) only once.
• The analysis of the L.S. design is very similar
to the two-way ANOVA technique.
• The merit of this experimental design is that it
enables differences in fertility gradients in the field
to be eliminated in comparison to the effects of
different varieties of fertilizers on the yield of the
crop.
• But this design suffers from one limitation, and it
is that although each row and each column
represents equally all fertilizer varieties, there may
be considerable difference in the row and column
means both up and across the field.
• This, in other words, means that in L.S. design we
must assume that there is no interaction between
treatments and blocking factors.
• This defect can, however, be removed by taking the means of
rows and columns equal to the field mean by adjusting the results.
• Another limitation of this design is that it requires number of
rows, columns and treatments to be equal. This reduces the utility
of this design.
• In case of (2 × 2) L.S. design, there are no degrees of freedom
available for the mean square error and hence the design cannot
be used.
• If treatments are 10 or more, than each row and each column will
be larger in size so that rows and columns may not be
homogeneous.
• This may make the application of the principle of local control
ineffective.
• Therefore, L.S. design of orders (5 × 5) to (9 × 9) are generally
used.
Factorial designs:
• Factorial designs are used in experiments where the effects of
varying more than one factor are to be determined.
• They are specially important in several economic and social
phenomena where usually a large number of factors affect a
particular problem.
• Factorial designs can be of two types:
(i) simple factorial designs and
(ii) complex factorial designs.
(i) Simple factorial designs:
• In case of simple factorial designs, we consider the effects
of varying two factors on the dependent variable, but when
an experiment is done with more than two factors, we use
complex factorial designs.
• Simple factorial design is also termed as a ‘two-factor-
factorial design’, whereas complex factorial design is
known as ‘multifactor- factorial design.’
• Simple factorial design may either be a 2 × 2 simple
factorial design, or it may be, say, 3 × 4 or 5 × 3 or the like
type of simple factorial design.
• We illustrate some simple factorial designs as under:
• In this design the extraneous variable to be controlled by
homogeneity is called the control variable and the independent
variable, which is manipulated, is called the experimental
variable.
• Then there are two treatments of the experimental variable and
two levels of the control variable.
• As such there are four cells into which the sample is divided.
• Each of the four combinations would provide one treatment or
experimental condition. Subjects are assigned at random to
each treatment in the same manner as in a randomized group
design.
• The means for different cells may be obtained along with the
means for different rows and columns.
• Means of different cells represent the mean scores for the dependent
variable and the column means in the given design are termed the
main effect for treatments without taking into account any differential
effect that is due to the level of the control variable.
• Similarly, the row means in the said design are termed the main
effects for levels without regard to treatment.
• Thus, through this design we can study the main effects of treatments
as well as the main effects of levels. An additional merit of this design
is that one can examine the interaction between treatments and levels,
through which one may say whether the treatment and levels are
independent of each other or they are not so.
• The following examples make clear the interaction effect between
treatments and levels.
The data obtained in case of two (2 × 2) imple factorial Studies
• The graph relating to Study I indicates that there is an interaction
between the treatment and the level which, in other words, means that
the treatment and the level are not independent of each other.
• The graph relating to Study II shows that there is no interaction effect
which means that treatment and level in this study are relatively
independent of each other.
• The 2 × 2 design need not be restricted in the manner as explained
above i.e., having one experimental variable and one control variable,
but it may also be of the type having two experimental variables or
two control variables.
• For example, a college teacher compared the effect of the classsize as
well as the introduction of the new instruction technique on the
learning of research methodology.
• For this purpose he conducted a study using a 2 × 2 simple factorial
design.
• His design in the graphic form would be as follows:
• But if the teacher uses a design for comparing
males and females and the senior and junior
students in the college as they relate to the
knowledge of research methodology, in that
case we will have a 2 × 2 simple factorial
design wherein both the variables are control
variables as no manipulation is involved in
respect of both the variables.
• This model of a simple factorial design includes four
treatments viz., A, B, C, and D of the experimental
variable and three levels viz., I, II, and III of the control
variable and has 12 different cells as shown above.
• This shows that a 2 × 2 simple factorial design can be
generalised to any number of treatments and levels.
• Accordingly we can name it as such and such (–×–)
design.
• In such a design the means for the columns provide the
researcher with an estimate of the main effects for
treatments and the means for rows provide an estimate of
the main effects for the levels.
• Such a design also enables the researcher to determine the
interaction between treatments and levels.
Complex factorial designs:
• Experiments with more than two factors at a time
involve the use of complex factorial designs.
• A design which considers three or more
independent variables simultaneously is called a
complex factorial design.
• In case of three factors with one experimental
variable having two treatments and two control
variables, each one of which having two levels,
the design used will be termed 2 × 2 × 2 complex
factorial design which will contain a total of
eight cells
• The dotted line cell in the diagram corresponds to Cell 1 of the
above stated 2 × 2 × 2 design and is for Treatment A, level I of
the control variable 1, and level I of the control variable 2.
• From this design it is possible to determine the main effects
for three variables i.e., one experimental and two control
variables.
• The researcher can also determine the interactions between
each possible pair of variables (such interactions are called
‘First Order interactions’) and interaction between variable
taken in triplets (such interactions are called Second Order
interactions).
• In case of a 2 × 2 × 2 design, the further given first order
interactions are possible:
(a)Experimental variable with control variable 1 (or EV × CV
1);
(b)Experimental variable with control variable 2 (or EV × CV
2);
(c)Control variable 1 with control variable 2 (or CV1 × CV2);
• Three will be one second order interaction as well in the
given design (it is between all the three variables i.e., EV ×
CV1 × CV2).
• To determine the main effects for the experimental variable,
the researcher must necessarily compare the combined mean
of data in cells 1, 2, 3 and 4 for Treatment A with the
combined mean of data in cells 5, 6, 7 and 8 for Treatment B.
• In this way the main effect for experimental variable,
independent of control variable 1 and variable 2, is obtained.
• Similarly, the main effect for control variable 1, independent
of experimental variable and control variable 2, is obtained if
we compare the combined mean of data in cells 1, 3, 5 and 7
with the combined mean of data in cells 2, 4, 6 and 8 of our 2
× 2 × 2 factorial design.
• On similar lines, one can determine the main effect for the
control variable 2 independent of experimental variable and
control variable 1, if the combined mean of data in cells 1, 2, 5
and 6 are compared with the combined mean of data in cells 3,
4, 7 and 8.
• To obtain the first order interaction, say, for
EV × CV1 in the above stated design, the
researcher must necessarily ignore control
variable 2 for which purpose he may develop 2
× 2 design from the 2 × 2 × 2 design by
combining the data of the relevant cells of the
latter design as shown in Fig. 3.15.
• Similarly, the researcher can determine other first order
interactions.
• The analysis of the first order interaction, in the manner
described above, is essentially a sample factorial analysis as
only two variables are considered at a time and the remaining
one is ignored.
• But the analysis of the second order interaction would not
ignore one of the three independent variables in case of a 2 × 2
× 2 design.
• The analysis would be termed as a complex factorial analysis.
• It may, however, be remembered that the complex factorial
design need not necessarily be of 2 × 2 × 2 type design, but
can be generalised to any number and combination of
experimental and control independent variables.
• Of course, the greater the number of
independent variables included in a complex
factorial design, the higher the order of the
interaction analysis possible.
• But the overall task goes on becoming more
and more complicated with the inclusion of
more and more independent variables in our
design
• Factorial designs are used mainly because of the two
advantages.
(i) They provide equivalent accuracy (as happens in the case of
experiments with only one factor) with less labour and as
such are a source of economy.
Using factorial designs, we can determine the main effects of two
(in simple factorial design) or more (in case of complex
factorial design) factors (or variables) in one single
experiment.
(ii) They permit various other comparisons of interest. For
example, they give information about such effects which
cannot be obtained by treating one single factor at a time.
The determination of interaction effects is possible in case of
factorial designs
THANK YOU

Lecture 4(Research Design).pptx..........

  • 1.
  • 2.
    Meaning • After theproblem is drafted, you need to design the research project, popularly known as the “research design”. • The research design is the conceptual structure within which research is conducted; it constitutes the blueprint for the collection, measurement and analysis of data.
  • 3.
    • The designdecisions happen to be in respect of: (i) What is the study about? (ii) Why is the study being made? (iii) Where will the study be carried out? (iv) What type of data is required? (v) Where can the required data be found? (vi) What periods of time will the study include? (vii) What will be the sample design? (viii) What techniques of data collection will be used? (ix) How will the data be analysed? (x) In what style will the report be prepared?
  • 4.
    • Research designis split into the following parts: (a) the sampling design which deals with the method of selecting items to be observed for the given study; (b) the observational design which relates to the conditions under which the observations are to be made; (c) the statistical design which concerns with the question of how many items are to be observed and how the information and data gathered are to be analysed; and (d) the operational design which deals with the techniques by which the procedures specified in the sampling, statistical and observational designs can be carried out.
  • 5.
    Operational Definition • Anoperational definition, when applied to data collection, is a clear, concise detailed definition of a measure. • The need for operational definitions is fundamental when collecting all types of data. • It is particularly important when a decision is being made about whether something is correct or incorrect, or when a visual check is being made where there is room for confusion. • When collecting data, it is essential that everyone in the system has the same understanding and collects data in the same way. • Operational definitions should therefore be made before the collection of data begins. When is it used? • Any time data is being collected, it is necessary to define how to collect the data. Data that is not defined will usually be inconsistent and will give an erroneous result. It is easy to assume that those collecting the data understand what and how to complete the task. However, people have different opinions and views, and these will affect the data collection. The only way to ensure consistent data collection is by means of a detailed operational definition that eliminates ambiguity.
  • 7.
    Important features ofa research design (i) It is a plan that specifies the sources and types of information relevant to the research problem. (ii) It is a strategy specifying which approach will be used for gathering and analysing the data. (iii) It also includes the time and cost budgets since most studies are done under these two constraints.
  • 8.
    • Research designmust, at least, contain— (a) a clear statement of the research problem; (b) procedures and techniques to be used for gathering information; (c) the population to be studied; (d) methods to be used in processing and analysing data.
  • 9.
    NEED FOR RESEARCHDESIGN • It facilitates the smooth sailing of the various research operations, thereby making research as efficient as possible yielding maximal information with minimal expenditure of effort, time and money • Just as for better, economical and attractive construction of a house, we need a blueprint ,well thought out and prepared by an expert architect, similarly we need a research design or a plan in advance of data collection and analysis for our research project. • Research design stands for advance planning of the methods to be adopted for collecting the relevant data and the techniques to be used in their analysis, keeping in view the objective of the research and the availability of staff, time and money.
  • 10.
    • Preparation ofthe research design should be done with great care as any error in it may upset the entire project. • Research design has a great bearing on the reliability of the results arrived at and as such constitutes the firm foundation of the entire edifice of the research work.
  • 11.
    • It isimperative that an efficient and appropriate design must be prepared before starting research operations. • The design helps the researcher to organize his ideas in a form whereby it will be possible for him to look for flaws and inadequacies. • Such a design can even be given to others for their comments and critical evaluation. • In the absence of such a course of action, it will be difficult for the critic to provide a comprehensive review of the proposed study
  • 12.
    FEATURES OF AGOOD DESIGN • The design which minimises bias and maximises the reliability of the data collected and analysed • The design which gives the smallest experimental error • A design which yields maximal information and provides an opportunity for considering many different aspects of a problem is considered most appropriate and efficient design in respect of many research problems. • Thus, the question of good design is related to the purpose or objective of the research problem and also with the nature of the problem to be studied.
  • 13.
    • A designmay be quite suitable in one case, but might not be suitable in the context of some other research problem. • One single design cannot serve the purpose of all types of research problems.
  • 14.
    • A researchdesign appropriate for a particular research problem, usually involves the consideration of the following factors: (i) the means of obtaining information; (ii) the availability and skills of the researcher and his staff, if any; (iii) the objective of the problem to be studied; (iv) the nature of the problem to be studied; and (v) the availability of time and money for the research work
  • 15.
    • If theresearch study happens to be an exploratory, wherein the major emphasis is on discovery of ideas and insights, – the research design most appropriate must be flexible enough to permit the consideration of many different aspects of a phenomenon. • In case of descriptive studies, accuracy becomes a major consideration – A research design which minimises bias and maximises the reliability of the evidence collected is considered a good design.
  • 16.
    • In studiesinvolving the testing of a hypothesis of a causal relationship between variables require a design which will permit inferences about causality in addition to the minimisation of bias and maximisation of reliability. • But in practice it is the most difficult task to put a particular study in a particular group, for a given research may have in it elements of two or more of the functions of different studies. • It is only on the basis of its primary function that a study can be categorised either as an exploratory or descriptive or hypothesis- testing study and accordingly the choice of a research design may be made in case of a particular study. • Besides, the availability of time, money, skills of the research staff and the means of obtaining the information must be given due weightage.
  • 17.
    IMPORTANT CONCEPTS RELATING TORESEARCH DESIGN Variable: • A concept which can take on different quantitative values is called a variable. • As such the concepts like weight, height, income are all examples of variables. • Qualitative phenomena (or the attributes) are also quantified on the basis of the presence or absence of the concerning attribute(s). Eg. Do you stay in hostel? Yes or No
  • 18.
    Continuous Variables • Phenomenawhich can take on quantitatively different values even in decimal points are called ‘continuous variables’. • But all variables are not continuous. • A continuous variable is that which can assume any numerical value within a specific range. Discrete Variables • If they can only be expressed in integer values, they are non-continuous variables or in statistical language ‘discrete variables’ • A variable for which the individual values fall on the scale only with distinct gaps is called a discrete variable Example: Age, height are examples of continuous variable, but the number of children is an example of non-continuous/discrete variable..
  • 19.
    Dependent and Independentvariables: • If one variable depends upon the other variable, it is termed as a dependent variable, • The variable that is antecedent to the dependent variable is termed as an independent variable. For instance, if we say that height depends upon age, then height is a dependent variable and age is an independent variable.
  • 20.
    Extraneous variable • Independentvariables that are not related to the study, but may affect the dependent variable are termed as extraneous variables. • Suppose the researcher wants to test the hypothesis that there is a relationship between effect of teaching on marks in social studies. In this case teaching is an independent variable and marks in social studies is a dependent variable. Intelligence may as well affect the marks, but since it is not related to the purpose of the study undertaken by the researcher, it will be termed as an extraneous variable. • Whatever effect is noticed on dependent variable as a result of extraneous variable(s) is technically described as an ‘experimental error’. • A study must always be so designed that the effect upon the dependent variable is attributed entirely to the independent variable(s), and not to some extraneous variable or variables.
  • 21.
    • Control: The term‘control’ is used when we design the study minimising the effects of extraneous independent variables. • Confounded relationship: When the dependent variable is not free from the influence of extraneous variable(s), the relationship between the dependent and independent variables is said to be confounded by an extraneous variable(s).
  • 22.
    Research hypothesis: • Whena hypothesised relationship is to be tested by scientific methods, it is termed as research hypothesis. • The research hypothesis is a predictive statement that relates an independent variable to a dependent variable. • Usually a research hypothesis must contain, at least, one independent and one dependent variable. • Predictive statements which are not to be objectively verified or the relationships that are assumed but not to be tested, are not termed research hypotheses.
  • 23.
    Experimental and non-experimentalhypothesis-testing research • When the purpose of research is to test a research hypothesis, it is termed as hypothesis-testing research. • It can be of the experimental design or of the non- experimental design. • Experimental hypothesis-testing research Research in which the independent variable is manipulated • Non-Experimental hypothesis-testing research A research in which an independent variable is not manipulated.
  • 24.
    • For instance,suppose a researcher wants to study whether intelligence affects reading ability for a group of students and for this purpose he randomly selects 50 students and tests their intelligence and reading ability by calculating the coefficient of correlation between the two sets of scores. • This is an example of non-experimental hypothesis-testing research because herein the independent variable, intelligence, is not manipulated. • But now suppose that our researcher randomly selects 50 students from a group of students who are to take a course in statistics and then divides them into two groups by randomly assigning 25 to Group A, the usual studies programme, and 25 to Group B, the special studies programme. At the end of the course, he administers a test to each group in order to judge the effectiveness of the training programme on the student’s performance-level. • This is an example of experimental hypothesis-testing research because in this case the independent variable, viz., the type of training programme, is manipulated.
  • 25.
    Experimental and controlgroups • In an experimental hypothesis-testing research when a group is exposed to usual conditions, it is termed a ‘control group’ • But when the group is exposed to some novel or special condition, it is termed an ‘experimental group’. • In the above illustration, the Group A can be called a control group and the Group B an experimental group. • If both groups A and B are exposed to special studies programmes, then both groups would be termed ‘experimental groups.’ • It is possible to design studies which include only experimental groups or studies which include both experimental and control groups
  • 26.
    Treatments: • The differentconditions under which experimental and control groups are put are usually referred to as ‘treatments’. • In the above example, the two treatments are the usual studies programme and the special studies programme. • Similarly, if we want to determine through an experiment the comparative impact of three varieties of fertilizers on the yield of wheat, in that case the three varieties of fertilizers will be treated as three treatments.
  • 27.
    Experiment: The process ofexamining the truth of a statistical hypothesis, relating to some research problem, is known as an experiment. For example, we can conduct an experiment to examine the usefulness of a certain newly developed drug. • Experiments can be of two types viz., (1) absolute experiment and (2) comparative experiment.
  • 28.
    Absolute Experiment: • Ifwe want to determine the impact of a fertilizer on the yield of a crop Comparative Experiment • If we want to determine the impact of one fertilizer as compared to the impact of some other fertilizer • Often, we undertake comparative experiments when we talk of designs of experiments. Experimental unit(s): • The pre-determined plots or the blocks, where different treatments are used, are known as experimental units. Such experimental units must be selected (defined) very carefully.
  • 29.
    DIFFERENT RESEARCH DESIGNS (1)Researchdesign in case of exploratory research studies (2)Research design in case of descriptive research studies (3)Research design in case of hypothesis-testing research studies.
  • 30.
    Research design incase of exploratory/ formulative research studies • The main purpose of is that of formulating a problem for more precise investigation or of developing the working hypotheses. • The major emphasis in such studies is on the discovery of ideas and insights. • The research design must be flexible enough to provide opportunity for considering different aspects of a problem under study. • Inbuilt flexibility in research design is needed because the research problem, broadly defined initially, is transformed into one with more precise meaning in exploratory studies, which fact may necessitate changes in the research procedure for gathering relevant data.
  • 31.
    • Generally, thefollowing three methods in the context of research design for such studies are talked about: (a) the survey of concerning literature; (b)the experience survey and (c)the analysis of ‘insight-stimulating’ examples.
  • 32.
    Survey of ConcerningLiterature • The survey of concerning literature happens to be the most simple and fruitful method of formulating precisely the research problem or developing hypothesis. • Hypotheses stated by earlier workers may be reviewed and their usefulness be evaluated as a basis for further research. • It may also be considered whether the already stated hypotheses suggest new hypothesis. • In this way the researcher should review and build upon the work already done by others, but in cases where hypotheses have not yet been formulated, his task is to review the available material for deriving the relevant hypotheses from it.
  • 33.
    Experience survey • Experiencesurvey means the survey of people who have had practical experience with the problem to be studied. • The objective is to obtain insight into the relationships between variables and new ideas relating to the research problem. • People who are competent and can contribute new ideas may be carefully selected as respondents to ensure a representation of different types of experience. • The researcher must prepare an interview schedule for the systematic questioning of informants. • But the interview must ensure flexibility in the sense that the respondents should be allowed to raise issues and questions which the investigator has not previously considered. • Generally, the experience collecting interview is likely to be long and may last for few hours.
  • 34.
    • Hence, itis often considered desirable to send a copy of the questions to be discussed to the respondents well in advance. • This will also give an opportunity to the respondents for doing some advance thinking over the various issues involved so that, at the time of interview, they may be able to contribute effectively. • Thus, an experience survey may enable the researcher to define the problem more concisely and help in the formulation of the research hypothesis. • This survey may as well provide information about the practical possibilities for doing different types of research.
  • 35.
    Analysis of ‘insight-stimulating’examples • This includes the study of one or a few situations. • It is focused on complex situations and problems; this kind of situations occur when the interrelations of several individuals are important. • In this method, some units are analyzed; each unit is called Case. • Study of relationships between different factors of each case is more important. • It is specifically helpful in situations where there is little experience to serve as a guide. • Attitude of the investigator, the intensity of the investigator and the ability of the researcher to draw together diverse information into a unified interpretation are the main features which make this method a suitable procedure for evoking insights.
  • 36.
    • One canmention few examples of ‘insight-stimulating’ cases such as the reactions of strangers, the reactions of marginal individuals, the study of individuals who are in transition from one stage to another, the reactions of individuals from different social strata and the like. • In general, cases that provide sharp contrasts or have striking features are considered relatively more useful while adopting this method of hypotheses formulation. • Thus, in an exploratory of formulative research study which merely leads to insights or hypotheses, whatever method or research design outlined above is adopted, the only thing essential is that it must continue to remain flexible so that many different facets of a problem may be considered as and when they arise and come to the notice of the researcher.
  • 37.
    Research design incase of descriptive research studies: • Descriptive research studies are those studies which are concerned with describing the characteristics of a particular individual, or of a group • In descriptive studies, the researcher must be able to define clearly, what he wants to measure and must find adequate methods for measuring it along with a clear cut definition of ‘population’ he wants to study. • Since the aim is to obtain complete and accurate information in the said studies, the procedure to be used must be carefully planned. • The research design must make enough provision for protection against bias and must maximise reliability, with due concern for the economical completion of the research study.
  • 38.
    • The designin such studies must be rigid and not flexible and must focus attention on the following: (a) Formulating the objective of the study (what the study is about and why is it being made?) (b) Designing the methods of data collection (what techniques of gathering data will be adopted?) (c) Selecting the sample (how much material will be needed?) (d) Collecting the data (where can the required data be found and with what time period should the data be related?) (e) Processing and analysing the data. (f) Reporting the findings.
  • 39.
    • In adescriptive study the first step is to specify the objectives with sufficient precision to ensure that the data collected are relevant. • If this is not done carefully, the study may not provide the desired information. • Then comes the question of selecting the methods by which the data are to be obtained. • In other words, techniques for collecting the information must be devised.
  • 40.
    • While designingdata-collection procedure, adequate safeguards against bias and unreliability must be ensured. • Whichever method is selected, questions must be well examined and be made unambiguous; interviewers must be instructed not to express their own opinion; observers must be trained so that they uniformly record a given item of behaviour. • It is always desirable to pretest the data collection instruments before they are finally used for the study purposes. • In other words, we can say that “structured instruments” are used in such studies.
  • 41.
    • In mostof the descriptive the researcher takes out sample(s) and then wishes to make statements about the population on the basis of the sample analysis or analyses. • The problem of designing samples should be tackled in such a fashion that the samples may yield accurate information with a minimum amount of research effort. • Usually one or more forms of probability sampling, or what is often described as random sampling, are used
  • 42.
    • To obtaindata free from errors, it is necessary to supervise closely the staff of field workers as they collect and record information. • Checks may be set up to ensure that the data collecting staff perform their duty honestly and without prejudice. • “As data are collected, they should be examined for completeness, comprehensibility, consistency and reliability.”
  • 43.
    • The datacollected must be processed and analysed. This includes steps like coding the interview replies, observations, etc.; tabulating the data; and performing several statistical computations. • To the extent possible, the processing and analysing procedure should be planned in detail before actual work is started. • This will prove economical in the sense that the researcher may avoid unnecessary labour such as preparing tables for which he later finds he has no use or on the other hand, re-doing some tables because he failed to include relevant data.
  • 44.
    • Coding shouldbe done carefully to avoid error in coding and for this purpose the reliability of coders needs to be checked. • Similarly, the accuracy of tabulation may be checked by having a sample of the tables re-done. • In case of mechanical tabulation the material (i.e., the collected data or information) must be entered on appropriate cards which is usually done by punching holes corresponding to a given code.
  • 45.
    • The accuracyof punching is to be checked and ensured. Finally, statistical computations are needed and as such averages, percentages and various coefficients must be worked out. • Probability and sampling analysis may as well be used. • The appropriate statistical operations, along with the use of appropriate tests of significance should be carried out to safeguard the drawing of conclusions concerning the study.
  • 46.
    • Reporting thefindings: This is the task of communicating the findings to others and the researcher must do it in an efficient manner. • The layout of the report needs to be well planned so that all things relating to the research study may be well presented in simple and effective style. • Thus, the research design in case of descriptive/diagnostic studies is a comparative design throwing light on all points narrated above and must be prepared keeping in view the objective(s) of the study and the resources available. • However, it must ensure the minimisation of bias and maximisation of reliability of the evidence collected. • The said design can be appropriately referred to as a survey design since it takes into account all the steps involved in a survey concerning a phenomenon to be studied.
  • 48.
    Research design incase of hypothesis- testing research studies: • Hypothesis-testing research studies are those where the researcher tests the hypotheses of causal relationships between variables. • Such studies require procedures that will not only reduce bias and increase reliability, but will permit drawing inferences about causality. • Usually experiments meet this requirement. • Hence, when we talk of research design in such studies, we often mean the design of experiments
  • 49.
    • Professor R.A.Fisher’s name is associated with experimental designs. • As such the study of experimental designs has its origin in agricultural research. Professor Fisher found that by dividing agricultural fields or plots into different blocks and then by conducting experiments in each of these blocks, whatever information is collected and inferences drawn from them, happens to be more reliable. • This fact inspired him to develop certain experimental designs for testing hypotheses concerning scientific investigations.
  • 50.
    BASIC PRINCIPLES OFEXPERIMENTAL DESIGNS • Professor Fisher has enumerated three principles of experimental designs: (1) the Principle of Replication; (2) the Principle of Randomization; and (3) The Principle of Local Control.
  • 51.
    Principle of Replication •Here, the experiment should be repeated more than once. • Thus, each treatment is applied in many experimental units instead of one. • By doing so the statistical accuracy of the experiments is increased. • For example, suppose we are to examine the effect of two varieties of rice. For this purpose we may divide the field into two parts and grow one variety in one part and the other variety in the other part. We can then compare the yield of the two parts and draw conclusion on that basis.
  • 52.
    • But ifwe are to apply the principle of replication to this experiment, then we first divide the field into several parts, grow one variety in half of these parts and the other variety in the remaining parts. We can then collect the data of yield of the two varieties and draw conclusion by comparing the same. The entire experiment can even be repeated several times for better results. The result so obtained will be more reliable in comparison to the conclusion we draw without applying the principle of replication. • Replication is introduced in order to increase the precision of a study; that is to say, to increase the accuracy with which the main effects and interactions can be estimated.
  • 53.
    Principle of Randomization •This principle indicates that we should design or plan the experiment in such a way that the variations caused by extraneous factors can all be combined under the general heading of “chance.” • The Principle of Randomization provides protection, when we conduct an experiment, against the effect of extraneous factors by randomization. • For instance, if we grow one variety of rice, say, in the first half of the parts of a field and the other variety is grown in the other half, then it is just possible that the soil fertility may be different in the first half in comparison to the other half. If this is so, our results would not be realistic.
  • 54.
    • In sucha situation, we may assign the variety of rice to be grown in different parts of the field on the basis of some random sampling technique i.e., we may apply randomization principle and protect ourselves against the effects of the extraneous factors (soil fertility differences in the given case). As such, through the application of the principle of randomization, we can have a better estimate of the experimental error. • Whatever effect is noticed on dependent variable as a result of extraneous variable(s) is technically described as an ‘experimental error’.
  • 55.
    Principle of LocalControl • Under it the extraneous factor is made to vary deliberately over as wide range as necessary and this needs to be done in such a way that the variability it causes can be measured and hence eliminated from the experimental error. • This means that we should plan the experiment in a manner that the total variability of the data is divided into three components attributed to treatments (varieties of rice in our case), the extraneous factor (soil fertility in our case) and experimental error. • Whatever effect is noticed on dependent variable as a result of extraneous variable(s) is technically described as an ‘experimental error’.
  • 56.
    • In otherwords, according to the principle of local control, we first divide the field into several homogeneous parts, known as blocks, and then each such block is divided into parts equal to the number of treatments. • Then the treatments are randomly assigned to these parts of a block. Dividing the field into several homogenous parts is known as ‘blocking’. • In general, blocks are the levels at which we hold an extraneous factor fixed, so that we can measure its contribution to the total variability of the data • In brief, through the principle of local control we can eliminate the variability due to extraneous factor(s) from the experimental error.
  • 57.
    Important Experimental Designs •Experimental design refers to the framework or structure of an experiment and as such there are several experimental designs. • We can classify experimental designs into two broad categories, viz., (i) informal experimental designs and (ii) formal experimental designs. (iii) Informal experimental designs are those designs that normally use a less sophisticated form of analysis based on differences in magnitudes, (iv) formal experimental designs offer relatively more control and use precise statistical procedures for analysis.
  • 58.
    Important experiment designsare as follows: (a) Informal experimental designs: (i) Before-and-after without control design. (ii) After-only with control design. (iii) Before-and-after with control design. (b) Formal experimental designs: (i) Completely randomized design (C.R. Design). (ii) Randomized block design (R.B. Design). (iii) Latin square design (L.S. Design). (iv) Factorial designs.
  • 59.
    Before-and-after without controldesign • In such a design a single test group or area is selected and the dependent variable is measured before the introduction of the treatment. • The treatment is then introduced and the dependent variable is measured again after the treatment has been introduced. • The effect of the treatment would be equal to the level of the phenomenon after the treatment minus the level of the phenomenon before the treatment.
  • 60.
    The design canbe represented thus: The main difficulty of such a design is that with the passage of time considerable extraneous variations may be there in its treatment effect.
  • 61.
    After-only with controldesign: • In this design two groups or areas (test area and control area) are selected and the treatment is introduced into the test area only. • The dependent variable is then measured in both the areas at the same time. • Treatment impact is assessed by subtracting the value of the dependent variable in the control area from its value in the test area. • This can be exhibited in the following form:
  • 62.
    • The basicassumption in such a design is that the two areas are identical with respect to their behaviour towards the phenomenon considered. • If this assumption is not true, there is the possibility of extraneous variation entering into the treatment effect. • However, data can be collected in such a design without the introduction of problems with the passage of time. • In this respect the design is superior to before-and-after without control design.
  • 63.
    Before-and-after with controldesign: • In this design two areas are selected and the dependent variable is measured in both the areas for an identical time-period before the treatment. • The treatment is then introduced into the test area only, and the dependent variable is measured in both for an identical time-period after the introduction of the treatment. • The treatment effect is determined by subtracting the change in the dependent variable in the control area from the change in the dependent variable in test area. • This design can be shown in this way:
  • 64.
    • This designis superior to the above two designs for the simple reason that it avoids extraneous variation resulting both from the passage of time and from non-comparability of the test and control areas. • But at times, due to lack of historical data, time or a comparable control area, we should prefer to select one of the first two informal designs stated above.
  • 65.
    Completely randomized design(C.R. design): • Involves only two principles viz., the principle of replication and the principle of randomization of experimental designs. • It is the simplest possible design and its procedure of analysis is also easier. • The essential characteristic of the design is that subjects are randomly assigned to experimental treatments (or vice- versa). • For instance, if we have 10 subjects and if we wish to test 5 under treatment A and 5 under treatment B, the randomization process gives every possible group of 5 subjects selected from a set of 10 an equal opportunity of being assigned to treatment A and treatment B.
  • 66.
    • Such adesign is generally used when experimental areas happen to be homogeneous. • Technically, when all the variations due to uncontrolled extraneous factors are included under the heading of chance variation, we refer to the design of experiment as C.R. design.
  • 67.
    (i) Two-group simplerandomized design: • In a two-group simple randomized design, first of all the population is defined and then from the population a sample is selected randomly. • Further, requirement of this design is that items, after being selected randomly from the population, be randomly assigned to the experimental and control groups (Such random assignment of items to two groups is technically described as principle of randomization). • Thus, this design yields two groups as representatives of the population. • In a diagram form this design can be shown in this way:
  • 69.
    • Since inthe sample randomized design the elements constituting the sample are randomly drawn from the same population and randomly assigned to the experimental and control groups, it becomes possible to draw conclusions on the basis of samples applicable for the population. • The two groups (experimental and control groups) of such a design are given different treatments of the independent variable. • This design of experiment is quite common in research studies concerning behavioural sciences. • The merit of such a design is that it is simple and randomizes the differences among the sample items. • But the limitation of it is that the individual differences among those conducting the treatments are not eliminated, i.e., it does not control the extraneous variable and as such the result of the experiment may not depict a correct picture.
  • 70.
    An example. • Supposethe researcher wants to compare two groups of students who have been randomly selected and randomly assigned. • Two different treatments viz., the usual training and the specialised training are being given to the two groups. • The researcher hypothesises greater gains for the group receiving specialised training. To determine this, he tests each group before and after the training, and then compares the amount of gain for the two groups to accept or reject his hypothesis. • This is an illustration of the two-groups randomized design, wherein individual differences among students are being randomized. But this does not control the differential effects of the extraneous independent variables (in this case, the individual differences among those conducting the training programme).
  • 72.
    Random replications design: •The limitation of the two-group randomized design is usually eliminated within the random replications design. • In the illustration just cited above, the teacher differences on the dependent variable were ignored, i.e., the extraneous variable was not controlled. • But in a random replications design, the effect of such differences are minimised (or reduced) by providing a number of repetitions for each treatment. Each repetition is technically called a ‘replication’. • Random replication design serves two purposes viz., it provides controls for the differential effects of the extraneous independent variables and secondly, it randomizes any individual differences among those conducting the treatments. • Diagrammatically we can illustrate the random replications design thus:
  • 74.
    • From thediagram it is clear that there are two populations in the replication design. • The sample is taken randomly from the population available for study and is randomly assigned to, say, four experimental and four control groups. • Similarly, sample is taken randomly from the population available to conduct experiments (because of the eight groups eight such individuals be selected) and the eight individuals so selected should be randomly assigned to the eight groups. • Generally, equal number of items are put in each group so that the size of the group is not likely to affect the result of the study. • Variables relating to both population characteristics are assumed to be randomly distributed among the two groups. • Thus, this random replication design is, in fact, an extension of the two-group simple randomized design.
  • 75.
    • Randomized blockdesign (R.B. design) is an improvement over the C.R. design. • In the R.B. design the principle of local control can be applied along with the other two principles of experimental designs. • In the R.B. design, subjects are first divided into groups, known as blocks, such that within each group the subjects are relatively homogeneous in respect to some selected variable. • The variable selected for grouping the subjects is one that is believed to be related to the measures to be obtained in respect of the dependent variable. • The number of subjects in a given block would be equal to the number of treatments and one subject in each block would be randomly assigned to each treatment.
  • 76.
    • In general,blocks are the levels at which we hold the extraneous factor fixed, so that its contribution to the total variability of data can be measured. • The main feature of the R.B. design is that in this each treatment appears the same number of times in each block. • The R.B. design is analysed by the two-way analysis of variance (two-way ANOVA)* technique.
  • 77.
    An Example • Supposefour different forms of a standardised test in statistics were given to each of five students (selected one from each of the five I.Q. blocks) and following are the scores which they obtained. • If each student separately randomized the order in which he or she took the four tests (by using random numbers or some similar device), we refer to the design of this experiment as a R.B. design. • The purpose of this randomization is to take care of such possible extraneous factors (say as fatigue) or perhaps the experience gained from repeatedly taking the test.
  • 78.
    Latin square design(L.S. design) • Latin square design (L.S. design) is an experimental design very frequently used in agricultural research. • The conditions under which agricultural investigations are carried out are different from those in other studies for nature plays an important role in agriculture. • For instance, an experiment has to be made through which the effects of five different varieties of fertilizers on the yield of a certain crop, say wheat, it to be judged.
  • 79.
    • In sucha case the varying fertility of the soil in different blocks in which the experiment has to be performed must be taken into consideration; otherwise the results obtained may not be very dependable because the output happens to be the effect not only of fertilizers, but it may also be the effect of fertility of soil. • Similarly, there may be impact of varying seeds on the yield. To overcome such difficulties, the L.S. design is used when there are two major extraneous factors such as the varying soil fertility and varying seeds.
  • 80.
    • The Latin-squaredesign is one wherein each fertilizer, in our example, appears five times but is used only once in each row and in each column of the design. • In other words, the treatments in a L.S. design are so allocated among the plots that no treatment occurs more than once in any one row or any one column. • The two blocking factors may be represented through rows and columns (one through rows and the other through columns). • The following is a diagrammatic form of such a design in respect of, say, five types of fertilizers, viz., A, B, C, D and E and the two blocking factor viz., the varying soil fertility and the varying seeds:
  • 82.
    • The abovediagram clearly shows that in a L.S. design the field is divided into as many blocks as there are varieties of fertilizers and then each block is again divided into as many parts as there are varieties of fertilizers in such a way that each of the fertilizer variety is used in each of the block (whether column-wise or row-wise) only once. • The analysis of the L.S. design is very similar to the two-way ANOVA technique.
  • 83.
    • The meritof this experimental design is that it enables differences in fertility gradients in the field to be eliminated in comparison to the effects of different varieties of fertilizers on the yield of the crop. • But this design suffers from one limitation, and it is that although each row and each column represents equally all fertilizer varieties, there may be considerable difference in the row and column means both up and across the field. • This, in other words, means that in L.S. design we must assume that there is no interaction between treatments and blocking factors.
  • 84.
    • This defectcan, however, be removed by taking the means of rows and columns equal to the field mean by adjusting the results. • Another limitation of this design is that it requires number of rows, columns and treatments to be equal. This reduces the utility of this design. • In case of (2 × 2) L.S. design, there are no degrees of freedom available for the mean square error and hence the design cannot be used. • If treatments are 10 or more, than each row and each column will be larger in size so that rows and columns may not be homogeneous. • This may make the application of the principle of local control ineffective. • Therefore, L.S. design of orders (5 × 5) to (9 × 9) are generally used.
  • 85.
    Factorial designs: • Factorialdesigns are used in experiments where the effects of varying more than one factor are to be determined. • They are specially important in several economic and social phenomena where usually a large number of factors affect a particular problem. • Factorial designs can be of two types: (i) simple factorial designs and (ii) complex factorial designs.
  • 86.
    (i) Simple factorialdesigns: • In case of simple factorial designs, we consider the effects of varying two factors on the dependent variable, but when an experiment is done with more than two factors, we use complex factorial designs. • Simple factorial design is also termed as a ‘two-factor- factorial design’, whereas complex factorial design is known as ‘multifactor- factorial design.’ • Simple factorial design may either be a 2 × 2 simple factorial design, or it may be, say, 3 × 4 or 5 × 3 or the like type of simple factorial design. • We illustrate some simple factorial designs as under:
  • 88.
    • In thisdesign the extraneous variable to be controlled by homogeneity is called the control variable and the independent variable, which is manipulated, is called the experimental variable. • Then there are two treatments of the experimental variable and two levels of the control variable. • As such there are four cells into which the sample is divided. • Each of the four combinations would provide one treatment or experimental condition. Subjects are assigned at random to each treatment in the same manner as in a randomized group design. • The means for different cells may be obtained along with the means for different rows and columns.
  • 89.
    • Means ofdifferent cells represent the mean scores for the dependent variable and the column means in the given design are termed the main effect for treatments without taking into account any differential effect that is due to the level of the control variable. • Similarly, the row means in the said design are termed the main effects for levels without regard to treatment. • Thus, through this design we can study the main effects of treatments as well as the main effects of levels. An additional merit of this design is that one can examine the interaction between treatments and levels, through which one may say whether the treatment and levels are independent of each other or they are not so. • The following examples make clear the interaction effect between treatments and levels.
  • 90.
    The data obtainedin case of two (2 × 2) imple factorial Studies
  • 92.
    • The graphrelating to Study I indicates that there is an interaction between the treatment and the level which, in other words, means that the treatment and the level are not independent of each other. • The graph relating to Study II shows that there is no interaction effect which means that treatment and level in this study are relatively independent of each other. • The 2 × 2 design need not be restricted in the manner as explained above i.e., having one experimental variable and one control variable, but it may also be of the type having two experimental variables or two control variables. • For example, a college teacher compared the effect of the classsize as well as the introduction of the new instruction technique on the learning of research methodology. • For this purpose he conducted a study using a 2 × 2 simple factorial design. • His design in the graphic form would be as follows:
  • 94.
    • But ifthe teacher uses a design for comparing males and females and the senior and junior students in the college as they relate to the knowledge of research methodology, in that case we will have a 2 × 2 simple factorial design wherein both the variables are control variables as no manipulation is involved in respect of both the variables.
  • 96.
    • This modelof a simple factorial design includes four treatments viz., A, B, C, and D of the experimental variable and three levels viz., I, II, and III of the control variable and has 12 different cells as shown above. • This shows that a 2 × 2 simple factorial design can be generalised to any number of treatments and levels. • Accordingly we can name it as such and such (–×–) design. • In such a design the means for the columns provide the researcher with an estimate of the main effects for treatments and the means for rows provide an estimate of the main effects for the levels. • Such a design also enables the researcher to determine the interaction between treatments and levels.
  • 97.
    Complex factorial designs: •Experiments with more than two factors at a time involve the use of complex factorial designs. • A design which considers three or more independent variables simultaneously is called a complex factorial design. • In case of three factors with one experimental variable having two treatments and two control variables, each one of which having two levels, the design used will be termed 2 × 2 × 2 complex factorial design which will contain a total of eight cells
  • 99.
    • The dottedline cell in the diagram corresponds to Cell 1 of the above stated 2 × 2 × 2 design and is for Treatment A, level I of the control variable 1, and level I of the control variable 2. • From this design it is possible to determine the main effects for three variables i.e., one experimental and two control variables. • The researcher can also determine the interactions between each possible pair of variables (such interactions are called ‘First Order interactions’) and interaction between variable taken in triplets (such interactions are called Second Order interactions).
  • 100.
    • In caseof a 2 × 2 × 2 design, the further given first order interactions are possible: (a)Experimental variable with control variable 1 (or EV × CV 1); (b)Experimental variable with control variable 2 (or EV × CV 2); (c)Control variable 1 with control variable 2 (or CV1 × CV2); • Three will be one second order interaction as well in the given design (it is between all the three variables i.e., EV × CV1 × CV2).
  • 101.
    • To determinethe main effects for the experimental variable, the researcher must necessarily compare the combined mean of data in cells 1, 2, 3 and 4 for Treatment A with the combined mean of data in cells 5, 6, 7 and 8 for Treatment B. • In this way the main effect for experimental variable, independent of control variable 1 and variable 2, is obtained. • Similarly, the main effect for control variable 1, independent of experimental variable and control variable 2, is obtained if we compare the combined mean of data in cells 1, 3, 5 and 7 with the combined mean of data in cells 2, 4, 6 and 8 of our 2 × 2 × 2 factorial design. • On similar lines, one can determine the main effect for the control variable 2 independent of experimental variable and control variable 1, if the combined mean of data in cells 1, 2, 5 and 6 are compared with the combined mean of data in cells 3, 4, 7 and 8.
  • 102.
    • To obtainthe first order interaction, say, for EV × CV1 in the above stated design, the researcher must necessarily ignore control variable 2 for which purpose he may develop 2 × 2 design from the 2 × 2 × 2 design by combining the data of the relevant cells of the latter design as shown in Fig. 3.15.
  • 104.
    • Similarly, theresearcher can determine other first order interactions. • The analysis of the first order interaction, in the manner described above, is essentially a sample factorial analysis as only two variables are considered at a time and the remaining one is ignored. • But the analysis of the second order interaction would not ignore one of the three independent variables in case of a 2 × 2 × 2 design. • The analysis would be termed as a complex factorial analysis. • It may, however, be remembered that the complex factorial design need not necessarily be of 2 × 2 × 2 type design, but can be generalised to any number and combination of experimental and control independent variables.
  • 105.
    • Of course,the greater the number of independent variables included in a complex factorial design, the higher the order of the interaction analysis possible. • But the overall task goes on becoming more and more complicated with the inclusion of more and more independent variables in our design
  • 106.
    • Factorial designsare used mainly because of the two advantages. (i) They provide equivalent accuracy (as happens in the case of experiments with only one factor) with less labour and as such are a source of economy. Using factorial designs, we can determine the main effects of two (in simple factorial design) or more (in case of complex factorial design) factors (or variables) in one single experiment. (ii) They permit various other comparisons of interest. For example, they give information about such effects which cannot be obtained by treating one single factor at a time. The determination of interaction effects is possible in case of factorial designs
  • 107.