Download to read offline

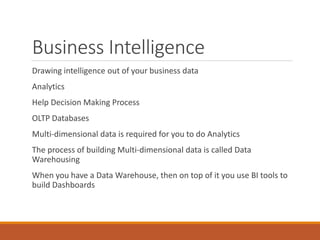


This document provides an overview of business intelligence and analytics. It discusses how transaction data is processed through data warehousing to build multi-dimensional data that can be analyzed using BI tools. Dashboards can then visualize this data through various formats like charts, KPIs, scorecards, and maps. The document traces the evolution of BI from being developed only by experts to now enabling self-service for end users through tools like Excel Power BI, SharePoint Power BI, and SQL Server PowerPivot and Power BI.