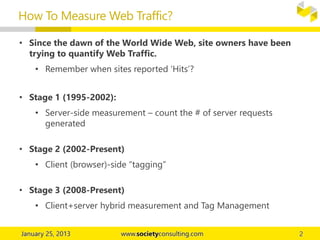
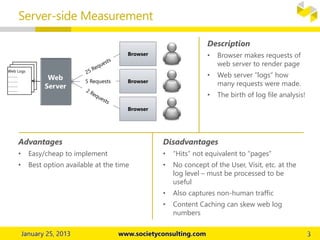
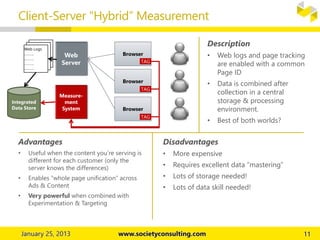
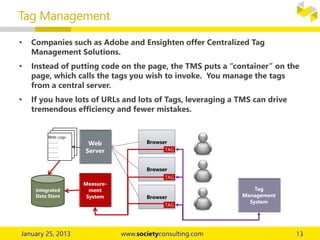
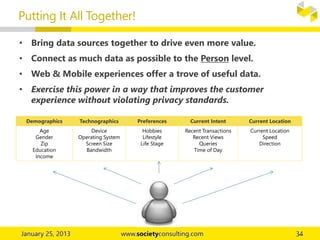
Web analytics has evolved through three stages:
1) Server-side measurement of page requests (1995-2002)
2) Client-side tagging of pages (2002-present)
3) Hybrid client-server measurement and tag management (2008-present)
Measuring web traffic has transitioned from analyzing server log files to using page tags and tag management systems. Identifying unique users remains a challenge due to factors like cookie deletion and device sharing. Analytics aims to understand user behavior through metrics like pageviews, sessions, and conversion rates across various dimensions like time and content. Optimization testing helps continuously improve performance.
This month we'll explore the topic of Ecommerce for Associations. Join us for this webinar as we get an overview of how important Ecommerce for Associations is for your organization.
Unlock your Big Data with Analytics and BI on Office 365 - OFF103Brian Culver
This document summarizes Brian Culver's presentation on unlocking big data with analytics and business intelligence on Office 365. The presentation covers what big data is, understanding sentiment analysis, connecting big data to BI by creating an Azure HDInsight cluster and loading data, and visualizing results in PowerView. The presentation discusses how big data can provide insights through understanding customer comments and patterns in data from any device.
Web Analytics Training Day was hosted by Andy Atkins, an internet marketer with over 10 years of experience. The objectives of the training were to understand web analytics and how to use the data to focus business growth efforts. The agenda covered what web analytics are, why they are useful, site-focused and market-focused analytics, and how to use analytics packages. Attendees learned about Google Analytics, browser plugins for quick snapshots, and paid SEO software for more robust competitor and keyword data analysis over time. The training emphasized using analytics tools relevant to business objectives and not being afraid to pay for the right tools.
This document discusses web analytics and analytical techniques. It begins with some definitions of key terms related to web analytics, such as pageviews, visits, unique visitors, referrers, and conversions. It then covers topics like qualitative user research methods, testing and experimentation, and analyzing social, mobile, and video data. The document provides examples of metrics for blogs, Twitter, and video analytics. It emphasizes testing hypotheses and measuring multiple outcomes to drive continual improvement of the online experience.
In today's information age, organizations have loads of data but only a small percentage of that data is being converted into information that results in actionable knowledge for the decision makers. In the attached presentation I have tried to define the process of Data, Information, Knowledge, and Decision/Action. The process is defined based on an online marketing business.
This document provides an introduction to web analytics basics. It discusses measuring traffic sources, page visits, duration on pages, page depth, and conversions. Traffic sources include organic search, paid search, paid ads, referrals, and direct traffic. Page analytics can reveal which pages are most popular and how long users spend on different pages. Tracking conversions helps determine what content and traffic sources are most effective at influencing user behavior. The document emphasizes testing hypotheses to improve analytics and better understand website audiences and goals.
Web Analytics 101 - Ned Poulter @MMUBS #dsmmcmNed Poulter
As a proud member of the MMUBS alumni I was invited back to speak to the next generation of budding digital marketers to speak about web analytics.
Like most of my talks, I tried to keep things informative and actionable, whilst also communicating some of the reasons why web analytics is so fundamental in the modern marketing environment, and for business decision making as a whole.
As these students are coming up to finalising their degree I shared some top tips for things I would learn in their position (from someone who's been there and done that) and also some great resources for continuing their learning.
Web analytics involves collecting data on visitor behavior on a website to analyze where visitors came from, what content they engaged with, and how the website experience can be improved. It provides key metrics like visits, pageviews, conversion rates, and referrers to understand traffic sources and optimize the site. Understanding web analytics helps businesses improve promotional campaigns, design effective websites, and increase revenue through higher conversions.
The number of possible Web Metrics is large and increasing. Multiply by the number of Dimensions, and there is nearly an infinite number of things an analyst can look at. Get your basics down in Web Analytics 101 – Web Metrics.
Pedersen & Partners is a leading international Executive Search firm. We operate 56 wholly owned offices in 52 countries across Europe, the Middle East, Africa, Asia & the Americas. Our values Trust, Relationship and Professionalism apply to our interaction with clients as well as executives. More information about Pedersen & Partners is available at www.pedersenandpartners.com
As a Google Analytics Certified Partner and Google Analytics Premium Authorized Reseller, our highly experienced analysts will help you measure and evaluate your traffic whether it is; web, social, mobile, display or search. And then maximize what really counts; conversions.
Senior Digital Marketing Strategy, Technology & Analytics Leader profile Mart...Digital Marketing, Inc.
This document provides an overview of Marty Terbrack's experience with digital marketing, analytics, and optimization platforms and tools. It lists the various platforms and tools he has experience with, including Adobe Marketing Cloud, Google Analytics, tag management systems, social media monitoring, paid search, SEO, and more. It also outlines his experience implementing and managing analytics platforms like Adobe Analytics, building digital marketing strategies, and improving marketing performance through data-driven insights.
Datalicious Google Analytics Premium Reseller InformationDatalicious
Datalicious is now a Google Analytics Premium reseller. If you're looking for a premium analytics solutions, talk to Datalicious about Google Analytics Premium.
Google Analytics Premium provides marketers with fresh, accurate, and unsampled analytics data to inform strategic decisions. It offers up to 1 billion hits, 3 million rows of unsampled data, 50 custom variables, and 200 dimensions to track customer behavior. Premium accounts guarantee 99.9% uptime and include a dedicated account manager, live 24/7 support, and access to new training.
Advanced Mobile Analytics to really understand how consumers are using mobile
applications: insights about location, sociodemographic profile, operating system,
network operator, brand of the smartphone, etc.
Web analytics 101 - Framework for Business Objectives & Data AnalysisBertrand Tay
This document discusses web analytics and data analysis. It provides an agenda for a presentation including an overview of web analytics, an example of setting up analytics for a company called PPHG to improve occupancy rates, a digital marketing model for web analysts, and takeaways. The PPHG example describes analyzing aggregate data, providing actionable insights like tracking promotion codes, and implementing changes like custom variables to track members and evaluate the impact on occupancy rates. The model outlines relating business objectives and website goals to key performance indicators, targets, data analysis, and fact-finding to understand the business.
Do you know how many people visit your website daily? Or what they do once they get there? Web marketers need the answers to these questions, but getting them isn’t always easy.
With all the data available on the web, understanding which information is relevant for your business and how you can use it to optimize your web presence can be a difficult task. Leveraging web analytics data is essential for the ROI of any website, but many organizations just don’t know where to start.
This webinar covers:
• Why web analytics are so important
• The main metrics you need to be measuring
• How to use analytics to optimize your web presence
The Ins and Outs of Fractional Attribution: How to Select the Right Partner, ...MediaPost
Every brand “plans” to get to proper attribution modeling any time now. But where to start? Equifax’s Director of Media Strategy & Optimization walks us through the steps – from securing necessary internal approvals to synchronizing teams and agencies, ensuring accountability and proving out results. Where to start? Here.
A non-technical introduction to mobile analytics. Learn how it managed, analyzed, and how it drives business and product decisions.
This presentation focuses on in-app-analytics.
Important aspects it covers:
1. The tool covers Flurry for in-app-analytics: active users, retention, events, funnels, segments, user acquisition
2. It introduces App Annie for sales analytics
3. Case studies from Cammy and Skater
A 5-minute blitz presentation from the February 2011 Columbus Web Analytics Wednesday. This was a comparison of the major web analytics platforms -- Google Analytics, Adobe Omniture Sitecatalyst, Webtrends, and Coremetrics. The comparison was limited to the base tools -- not the various add-ons available.
Google Analytics 101 provides an introductory lesson on features of Google Analytics including Audience, Behavior, Conversion and A/B Testing. If you are considering a website redesign, you should review this to get familiar with how to integrate analytics. Check out http://insivia.com to learn more.
Google Analytics Premium for Better Data-Driven Decisions With Swapnil SinhaTatvic Analytics
Google Analytics Premium is basically everything you love about Google Analytics along with More Power, Better Support and Faster Insights. You get access to 200 custom dimensions & metrics, unsampled reports, bigquery export, multi channel attribution modelling, access to data in 4 hours or less & much more.
Join Swapnil Sinha (Head of Conversion, Google India) to learn how enterprises can use Google Analytics Premium to make better data-driven decisions.
You'll Learn:
* What is GA Premium
* Difference between Standard & Premium Version
* Who Should Use Google Analytics Premium?
* Key Features & Applications of Google Analytics Premium
A solid foundation is the key to any major success. Start building that foundation with Web Analytics 101, a series of concepts and techniques. Explore the top advantages and disadvantages to four common web measurement tactics in Web Analytics 101 – Measuring Web Traffic.
This document provides an introduction and overview of Google Analytics. It begins with introductions from the presenter and explains why learning Google Analytics is important. The rest of the document dives into key topics such as how Google Analytics works, how to install it, the different types of web data and traffic sources it can track, and how to navigate and customize the various reports and features within Google Analytics. Resources for further learning about Google Analytics and obtaining certification are also provided.
The document discusses a webserver traffic tracking system that will analyze traffic and errors on a website. The system will track the total number of visitors, most popular pages, hourly/daily/weekly visitor numbers. It will also log and notify owners of any runtime errors, providing details like the page, line of code, and error type. The system aims to help owners and administrators better understand website usage and performance, and more quickly resolve any issues. It will generate reports on visitor demographics, traffic patterns, and error logs to provide insights on how to optimize the website.
This document provides an overview of Google Analytics, including what it is, how it works, its applications and advanced features. It discusses how GA collects data through JavaScript tags, generates metrics and reports, and how these can help businesses measure and improve website traffic and performance. It also covers setting up and configuring GA, as well as advanced topics like custom reports, filters, goals, funnels, campaign tracking, benchmarks and event tracking.
This document summarizes a lunch and learn presentation about Google Analytics. It introduces Google Analytics and why it is useful for understanding website traffic and performance. It provides an overview of key Google Analytics concepts like properties, views, dimensions, metrics and common metrics. It also summarizes how to navigate the Google Analytics interface and view standard reports on audiences, acquisitions, behavior and conversions. Additionally, it covers setting up conversion goals and custom reports. The presentation aims to provide attendees with foundational knowledge of Google Analytics and how to use it to analyze their website.
Adobe Digital Analytics - SiteCatalyst, Test & Target WorkshopDigital Vidya
Care about leveraging Digital Marketing. You can find this deck presented by Kunal Mehta, Digital Analyst, Lead Trainer at Digital Vidya at the workshop conducted for Genpact's team. Interested to be a part of such insightful workshops? Visit us now at http://www.digitalvidya.com .
Omniture is an online marketing and web analytics company that was acquired by Adobe in 2009. It offers various products for web analytics, testing, data mining, search optimization, recommendations, and more. Its flagship product is SiteCatalyst, which provides real-time intelligence about online strategies and marketing initiatives to help marketers optimize their websites.
This document provides an introduction to Google Analytics (GA) and Google Tag Manager (GTM). It outlines the course agenda which includes an overview of GA terms, concepts, and setup. It also covers dashboard and reporting, campaign tracking, and a case study. The document concludes with an introduction to GTM concepts like containers, tags, variables, and triggers for codeless website tracking.
Web analytics involves collecting and analyzing digital data about user behavior on websites and mobile apps. It is important for measuring the effectiveness of marketing campaigns and ensuring websites meet their objectives, such as increasing sales for ecommerce sites. Google Analytics is a popular web analytics tool that tracks user data through a JavaScript code added to websites. It provides visualization tools and insights about key metrics like users, sessions, pageviews, bounce rate, and exit rate, broken down by dimensions such as channels, devices, and locations.
Why use big data tools to do web analytics? And how to do it using Snowplow a...yalisassoon
There are a number of mature web analytics products that have been on the market for ~20 years. Big data tools have only really taken off in the last 5 years. So why use big data tools mine web analytics data?
In this presentation, I explore the limitations of traditional approaches to web analytics, and explain how big data tools can be used to address those limitations and drive more value from the underlying data. I explain how a combination of Snowplow and Qubole can be used to do this in practice
Web analytics is the measurement and analysis of internet data to understand and optimize website usage. It provides information on traffic, page views, and popularity trends which is useful for market research and assessing advertising campaigns. Web analytics tools can measure return on investment, identify top referral sources, optimize conversions, and save on customer support costs. Popular free and paid tools include Google Analytics, Compete, Quantcast, StatCounter, WebTrends, ClickTale, and Crazyegg which provide metrics on traffic, user behavior, and usability.
The document provides instructions for setting up and using a Google Analytics account. It begins by explaining how to create an account and install the tracking code on websites. It then discusses how Google Analytics works and the types of reports available, including real-time, audience, traffic sources, content, and conversions/goals reports. The document emphasizes setting up goals to track important user actions and optimize for conversions. Overall, the document is an introduction to Google Analytics and how to get the most value from tracking and analyzing website traffic.
web analysis document | web analysis document | web analysis document | web a...nazen2
This document provides an overview of analyzing website traffic through Google Analytics and SEMRush. It discusses understanding website traffic sources and user behavior to improve digital marketing strategies. Key topics covered include an introduction to website analytics, how Google Analytics works, examples of common reports in Google Analytics like audience, acquisition, behavior and conversion reports, and how to analyze website traffic through SEMRush. The document also includes learning objectives and an activity describing exploring website traffic analysis on the Google Analytics demo account and answering related questions.
This document provides an overview of Google Analytics and how to use it to measure website traffic and goals. It discusses key metrics like pageviews, visits, traffic sources and conversions. It also covers how to set up tracking of goals and campaigns using techniques like link tagging and event tracking. The goal is to help users understand their website traffic and how to define business goals to improve performance.
Google Analytics is a tool that collects and analyzes website usage statistics. It provides more interactive and customizable reports than traditional log file analyzers, which required technical expertise. Google Analytics inserts JavaScript on webpages that sends usage data to Google servers. This data includes URLs visited, time spent, device details, and more. Administrators can then view reports on metrics like pageviews, visits, and visitor demographics. The tool helps answer questions about how users engage with a site but cannot track certain offline interactions.
Lavacon 2012 How Documentation Teams Can Use Web Analytics to Expand their Co...bzebian
n this session, Karen Buchanan and Bob Zebian of IBM will describe how Web analytics play an increasing role in improving documentation quality, and how documentation teams can expand their value across the enterprise by sharing this information with other teams such as Quality Assurance, Development, Product Management, and Executive Management.
This document discusses personal web usage mining, which involves analyzing individual user's web browsing and navigation data recorded on the client side, rather than server side web logs. It describes logging a user's local and remote web activities into an activity log, warehousing that data, mining it for patterns and profiles, and building tools to help and enhance the individual user's web experience. The goal is true personalization by understanding each user's interests and preferences to provide customized recommendations and assistance.
Industrial Tech SW: Category Renewal and CreationChristian Dahlen
Every industrial revolution has created a new set of categories and a new set of players.
Multiple new technologies have emerged, but Samsara and C3.ai are only two companies which have gone public so far.
Manufacturing startups constitute the largest pipeline share of unicorns and IPO candidates in the SF Bay Area, and software startups dominate in Germany.
Discover innovative uses of Revit in urban planning and design, enhancing city landscapes with advanced architectural solutions. Understand how architectural firms are using Revit to transform how processes and outcomes within urban planning and design fields look. They are supplementing work and putting in value through speed and imagination that the architects and planners are placing into composing progressive urban areas that are not only colorful but also pragmatic.
Garments ERP Software in Bangladesh _ Pridesys IT Ltd.pdfPridesys IT Ltd.
Pridesys Garments ERP is one of the leading ERP solution provider, especially for Garments industries which is integrated with
different modules that cover all the aspects of your Garments Business. This solution supports multi-currency and multi-location
based operations. It aims at keeping track of all the activities including receiving an order from buyer, costing of order, resource
planning, procurement of raw materials, production management, inventory management, import-export process, order
reconciliation process etc. It’s also integrated with other modules of Pridesys ERP including finance, accounts, HR, supply-chain etc.
With this automated solution you can easily track your business activities and entire operations of your garments manufacturing
proces
[To download this presentation, visit:
https://www.oeconsulting.com.sg/training-presentations]
This PowerPoint compilation offers a comprehensive overview of 20 leading innovation management frameworks and methodologies, selected for their broad applicability across various industries and organizational contexts. These frameworks are valuable resources for a wide range of users, including business professionals, educators, and consultants.
Each framework is presented with visually engaging diagrams and templates, ensuring the content is both informative and appealing. While this compilation is thorough, please note that the slides are intended as supplementary resources and may not be sufficient for standalone instructional purposes.
This compilation is ideal for anyone looking to enhance their understanding of innovation management and drive meaningful change within their organization. Whether you aim to improve product development processes, enhance customer experiences, or drive digital transformation, these frameworks offer valuable insights and tools to help you achieve your goals.
INCLUDED FRAMEWORKS/MODELS:
1. Stanford’s Design Thinking
2. IDEO’s Human-Centered Design
3. Strategyzer’s Business Model Innovation
4. Lean Startup Methodology
5. Agile Innovation Framework
6. Doblin’s Ten Types of Innovation
7. McKinsey’s Three Horizons of Growth
8. Customer Journey Map
9. Christensen’s Disruptive Innovation Theory
10. Blue Ocean Strategy
11. Strategyn’s Jobs-To-Be-Done (JTBD) Framework with Job Map
12. Design Sprint Framework
13. The Double Diamond
14. Lean Six Sigma DMAIC
15. TRIZ Problem-Solving Framework
16. Edward de Bono’s Six Thinking Hats
17. Stage-Gate Model
18. Toyota’s Six Steps of Kaizen
19. Microsoft’s Digital Transformation Framework
20. Design for Six Sigma (DFSS)
To download this presentation, visit:
https://www.oeconsulting.com.sg/training-presentations
𝐔𝐧𝐯𝐞𝐢𝐥 𝐭𝐡𝐞 𝐅𝐮𝐭𝐮𝐫𝐞 𝐨𝐟 𝐄𝐧𝐞𝐫𝐠𝐲 𝐄𝐟𝐟𝐢𝐜𝐢𝐞𝐧𝐜𝐲 𝐰𝐢𝐭𝐡 𝐍𝐄𝐖𝐍𝐓𝐈𝐃𝐄’𝐬 𝐋𝐚𝐭𝐞𝐬𝐭 𝐎𝐟𝐟𝐞𝐫𝐢𝐧𝐠𝐬
Explore the details in our newly released product manual, which showcases NEWNTIDE's advanced heat pump technologies. Delve into our energy-efficient and eco-friendly solutions tailored for diverse global markets.
Navigating the world of forex trading can be challenging, especially for beginners. To help you make an informed decision, we have comprehensively compared the best forex brokers in India for 2024. This article, reviewed by Top Forex Brokers Review, will cover featured award winners, the best forex brokers, featured offers, the best copy trading platforms, the best forex brokers for beginners, the best MetaTrader brokers, and recently updated reviews. We will focus on FP Markets, Black Bull, EightCap, IC Markets, and Octa.
The Genesis of BriansClub.cm Famous Dark WEb PlatformSabaaSudozai
BriansClub.cm, a famous platform on the dark web, has become one of the most infamous carding marketplaces, specializing in the sale of stolen credit card data.
The Most Inspiring Entrepreneurs to Follow in 2024.pdfthesiliconleaders
In a world where the potential of youth innovation remains vastly untouched, there emerges a guiding light in the form of Norm Goldstein, the Founder and CEO of EduNetwork Partners. His dedication to this cause has earned him recognition as a Congressional Leadership Award recipient.
SATTA MATKA SATTA FAST RESULT KALYAN TOP MATKA RESULT KALYAN SATTA MATKA FAST RESULT MILAN RATAN RAJDHANI MAIN BAZAR MATKA FAST TIPS RESULT MATKA CHART JODI CHART PANEL CHART FREE FIX GAME SATTAMATKA ! MATKA MOBI SATTA 143 spboss.in TOP NO1 RESULT FULL RATE MATKA ONLINE GAME PLAY BY APP SPBOSS
Storytelling is an incredibly valuable tool to share data and information. To get the most impact from stories there are a number of key ingredients. These are based on science and human nature. Using these elements in a story you can deliver information impactfully, ensure action and drive change.
IMPACT Silver is a pure silver zinc producer with over $260 million in revenue since 2008 and a large 100% owned 210km Mexico land package - 2024 catalysts includes new 14% grade zinc Plomosas mine and 20,000m of fully funded exploration drilling.
Anny Serafina Love - Letter of Recommendation by Kellen Harkins, MS.AnnySerafinaLove
This letter, written by Kellen Harkins, Course Director at Full Sail University, commends Anny Love's exemplary performance in the Video Sharing Platforms class. It highlights her dedication, willingness to challenge herself, and exceptional skills in production, editing, and marketing across various video platforms like YouTube, TikTok, and Instagram.
The Steadfast and Reliable Bull: Taurus Zodiac Signmy Pandit
Explore the steadfast and reliable nature of the Taurus Zodiac Sign. Discover the personality traits, key dates, and horoscope insights that define the determined and practical Taurus, and learn how their grounded nature makes them the anchor of the zodiac.
Best practices for project execution and deliveryCLIVE MINCHIN
A select set of project management best practices to keep your project on-track, on-cost and aligned to scope. Many firms have don't have the necessary skills, diligence, methods and oversight of their projects; this leads to slippage, higher costs and longer timeframes. Often firms have a history of projects that simply failed to move the needle. These best practices will help your firm avoid these pitfalls but they require fortitude to apply.
Presentation by Herman Kienhuis (Curiosity VC) on Investing in AI for ABS Alu...Herman Kienhuis
Presentation by Herman Kienhuis (Curiosity VC) on developments in AI, the venture capital investment landscape and Curiosity VC's approach to investing, at the alumni event of Amsterdam Business School (University of Amsterdam) on June 13, 2024 in Amsterdam.
2. • Since the dawn of the World Wide Web, site owners have been
trying to quantify Web Traffic.
• Remember when sites reported ‘Hits’?
• Stage 1 (1995-2002):
• Server-side measurement – count the # of server requests
generated
• Stage 2 (2002-Present)
• Client (browser)-side “tagging”
• Stage 3 (2008-Present)
• Client+server hybrid measurement and Tag Management
How To Measure Web Traffic?
3. Web Logs
……….
……….
……….
……….
Web Logs
……….
……….
……….
……….
Server-side Measurement
Web
Server
Browser
Browser
Browser
5 Requests
Description
• Browser makes requests of
web server to render page
• Web server “logs” how
many requests were made.
• The birth of log file analysis!
Advantages
• Easy/cheap to implement
• Best option available at the time
Disadvantages
• “Hits” not equivalent to “pages”
• No concept of the User, Visit, etc. at the
log level – must be processed to be
useful
• Also captures non-human traffic
• Content Caching can skew web log
numbers
Web Logs
……….
……….
……….
……….
4. Server-side Measurement
Log Files:
• Hard to read, but contain rich information
• Data is written to the log in the sequence each event was observed
Requires Processing to be Useful
• There are a lot of inexpensive tools on the market that will
perform log file analysis (processing) for you, but they can’t
handle large amounts of data or create sophisticated metrics.
• Many companies now generate so much log data that it can’t be
processed by traditional tools – new approaches had to be invented
(more on that later.)
5. What’s Does a Server Log Look Like?
Google crawler
indexing the site
User that came so
the site from
Google
Page view from a
user that was
already on the site
Fields Contained in this Log File:
• IP Address – somewhat useful for IDing users (cookies can also be used but have their own problems.)
• Timestamp – when the event occurred. Beware the timezone of the server!
• Access Request – “GET” me the page using HTTP/1.1 protocol
• Result Status – “200” is success; 404 is Not Found; many other codes exist
• Bytes Transferred – 10801 bytes were transferred in the 2nd log entry
• Referring URL – the previous page the user was on. Not always captured.
• User Agent String – the browser, operating system, & language. Mostly reliable.
6. Client-side Measurement
Web
Server
Browser
Browser
Browser
Description
• Browser makes requests of
web server to render page
• Upon rendering, the page
activates a “tag” .
• The tag sends data to a
measurement server, whose
sole job is to collect and
process web data.
Advantages
• Tags tend to be more reflective of
actual “human” behavior
• Caching not an issue
• Back-end processing is typically
more sophisticated & scalable
• Can have multiple tags per page
• Rich JS information can be collected
Disadvantages
• Each page must be tagged
• Some tags increase Page Load Time
• Cost of tagging and processing (getting
better)
Measure-
ment
System
TAG
TAG
TAG
7. What is a Page Tag?
• A Page Tag is a piece of code that resides in the HTML on the page. It
frequently relies on helper technologies such as Javascript to expand its
capabilities.
• Since a page tag “makes a call”, it CAN slow down how fast your page
loads. Make sure you keep an eye on “PLT” – Page Load Time.
• Large sites typically have many page tags on them:
• Web Analytics (Omniture, WebTrends, CoreMetrics, GA, etc.)
• Custom Targeting (e.g. BlueKai, AudienceManager)
• 3rd Party Ad Networks (e.g. Atlas, DoubleClick, etc.)
• Marketing Campaign Funnel (Ad Networks, Search Engines)
• Testing/Experimentation (Adobe, WebTrends, etc)
• Etc
• Etc
8. What Does a Page Tag Look Like?
Let’s go
Behind
the
Scenes
10. What Does a Page Tag Look Like?
Google Analytics tag is
located at the bottom
of the EventBrite page.
11. Client-Server “Hybrid” Measurement
Description
• Web logs and page tracking
are enabled with a common
Page ID
• Data is combined after
collection in a central
storage & processing
environment.
• Best of both worlds?
Advantages
• Useful when the content you’re serving is
different for each customer (only the
server knows the differences)
• Enables “whole page unification” across
Ads & Content
• Very powerful when combined with
Experimentation & Targeting
Disadvantages
• More expensive
• Requires excellent data “mastering”
• Lots of storage needed!
• Lots of data skill needed!
Web
Server
Browser
Browser
Browser
Measure-
ment
System
TAG
TAG
TAG
Web Logs
……….
……….
……….
……….
Web Logs
……….
……….
……….
……….
Web Logs
……….
……….
……….
……….
Integrated
Data Store
12. • Putting a Page Tag on every URL is a tedious job. Many sites
have thousands (or more) URLs.
• Adding, changing, or removing tags typically requires modifying
the HTML of each page… this is time consuming.
• Content Management Systems can streamline some of this, but
do not offer robust Tag Management capabilities.
• If you’re manually editing tags, mistakes can tend to pile up over
time, requiring regular “audits”
• Solution? Centralized Tag Management
Tag Management
13. • Companies such as Adobe and Ensighten offer Centralized Tag
Management Solutions.
• Instead of putting code on the page, the TMS puts a “container” on the
page, which calls the tags you wish to invoke. You manage the tags
from a central server.
• If you have lots of URLs and lots of Tags, leveraging a TMS can drive
tremendous efficiency and fewer mistakes.
Tag Management
Web
Server
Browser
Browser
Browser
Measure-
ment
System
TAG
TAG
TAG
Web Logs
……….
……….
……….
……….
Web Logs
……….
……….
……….
……….
Web Logs
……….
……….
……….
……….
Integrated
Data Store
Tag
Management
System
14. • Identifying “Users” (or Visitors) is one of the biggest challenges
in Web Analytics!
• The Perfect User ID doesn’t yet exist (Facebook notwithstanding)
• Cookies are an old technology but still very prevalent.
• Challenges:
• Users are now using many devices to access the same site (home
computer, work computer, tablet, phone, etc.)
• Sometimes a device is shared across more than one user
(example: a home computer.)
• Unless the user logs in on every device, it’s impossible to know
exactly how many users you have and track them individually.
Cookies & User Identification
15. • What is a cookie?
• A cookie is a small text file that resides in your browser’s cache:
• The first time you visit a web site, it “sets” the cookie. On each
subsequent visit, it “reads” the cookie.
• If you clear your cookies and then visit the site again, the web site
doesn’t recognize you and “sets” a new cookie.
• First party cookie – a cookie that is set & read by the site you are
visiting.
• Third party cookie – a cookie that gets set & read by a third party that
the first party site has included. Sometimes the call to the 3rd party site is
invisible.
Cookies & User Identification
cookie text
16. Cookie Deletion
• Studies have shown that 10-20% of users churn their cookies
frequently – after every session or every day. This churn can lead
to a large number of cookies in your results.
• Example: assume your site has 100 “real” users. During a one
month period…
• 80 of the users will have one cookie each = 80 cookies
• 20 of the users will churn their cookies every day, and create 30
cookies each = 600 cookies.
• Total = 680 cookies, 88% of which look like new users!
Cookies & User Identification
17. Basic Web Metrics
Examples & Definitions
Cookie 001 Cookie 001
Pageview
1
PV 2 PV
3
Day 1 Day 2
Visit (or
Session)
Visit (or
Session)
Visitor (or User)
Pageview
4
PV 5 PV
6
Measures – created by direct
measurement of activity
• Pageviews (count)
• Visitors (count unique)
Calculated Metrics – created by dividing
one measure by another measure
• Pageviews/User
• Pageviews/Session
• Sessions/User
Derived Metrics – created by taking a
metric and a dimension (usually Time),
and creating a new Derived metric.
• Sessions (count)
• Frequency; Days of Use
Indices – created by normalizing a group
of metric observations (usually to 100)
and calculating an observation’s value
relative to the top normalized value.
Example Definitions
18. Measures, Metrics, & Indices
The number of possible Web Metrics is large and increasing. Multiply by
the number of Dimensions, and there is a nearly infinite number of things
and analyst can look at!
• Visitors (Users)
• Customer Sat
• Subscribers
• Pageviews/User
• Sessions/User
• Bounce Rate
• Pageviews
• Transactions
• Subscribers
Measures Metrics Indices
• Visits (Sessions)
• Minutes
• Days of Use
Common Dimensions
Time
Geography
Product
Customer
Customer Segment
Content Type
Channel
Transaction Type
Campaign
Sales Owner
Custom Events
Product
Customer
Brand &
Campaign
• Top 10% Pages
• Engagement
• Net Promoter
Monetization
• Top 10% Users
• Engagement
• Customer Value
• % Logged In
• Impressions
• Revenue
• Click Position
• Rev/User (ARPU)
• Rev/kPV
• CPM
• % Heavy Users
• Retention
• % of Visits
• Share
• Reach
• Impressions
• Clicks
• Acquisitions
• Click-thru Rate
• Cost/Acquisition
• Campaign ROI
• Top Campaigns
• Price per Click
• Ad Market Share
• Rev/Advertiser
• Top 10% Pages
• Top Advertisers
19. • Prioritize. Make sure your business leaders have designated their
top metrics (commonly called KPIs – Key Performance Indicators)
• See books by Eric T. Peterson for more help here.
• Build a Tree that shows how all of your metrics interrelate.
Connect them to revenue and profit. Focus on the DRIVERS and
LEADING INDICATORS.
• Revenue is a Lagging Indicator!
• Customer Satisfaction is a Leading Indicator.
• New Customers is a Driver.
• Useful Technique with Web Data: DE-AVERAGE
How to Cope?
20. The Benefits of De-Averaging
10%
1%
10%
2%
10%
4%
10%
4%
10%
5%
10%
8%
10%
9%
10%
10%
10%
20%
10%
40%
0%
10%
20%
30%
40%
50%
60%
70%
80%
90%
100%
Users Pages
30%
40%
11%
100% 100%
Top
Decile
Bottom
Decile
Source: compilation of various analyses
70%
• There really is no
“average” Internet
user.
• Small numbers of
users can drive a
lot of traffic.
• Break down your
important metrics
into deciles to gain
new levels of
insight.
21. Days of Use
Current
Year
Actual
Next
Year
Goal % gro
>8 (Light) 7m 6m (15%)
8-21 (Med) 3m 4m 33%
>22 (Heavy) 1m 2m 100%
Total 11m 12m 10%
Using De-Averaging to Create New Metrics
Threshold metrics add a “mix” focus to business goals, which
can have major impact on growth.
-
5.0
10.0
15.0
20.0
25.0
30.0
35.0
1 3 5 7 9 11 13 15 17 19 21 23 25 27 29
8.0 days of
use
Visitors by Days of Use
22.0 days
of use
# low
users
# medium
users
# high users
MED+HIGH
total users
HIGH
users
Setting goals on Threshold metrics allows
you to change the mix of users, while also
growing & migrating the user base upward.
Assuming flat PV/user, changing the mix
of the user base would increase
pageviews by 50%, while total users only
grow by 10%.
Applying to Business Goals
22. The Law of “De-Averages”
Be suspicious of averages – taking them at face value can
sometimes lead to wrong conclusions.
1. Always understand how a metric will be used, and whether a average (mean,
median, or mode) is the best way to present the metric.
2. Always make an attempt to understand the shape of the distribution behind the
metric’s average, and if that distribution is changing over time.
3. Where possible, break a metric out into quintiles or deciles, based on frequency
of observations or based on users. Map the deciles to usage, to create a
customized version of the “80/20” rule for that metric.
4. If the story of the de-average is significantly different than the story of the
average, ensure business owners and other action drivers are sufficiently
educated.
5. Where needed, set primary or secondary business goals on threshold metrics and
specific segments, to further drive desired performance improvements.
24. Your Site
An Online Purchase Funnel
Site Visit
#1
Site Visit
#2
Purchase
Landing
Page
Display Ads
& Rich
Media
Paid Search
& Content
Ads
Mobile
Ads*
E-Mail
Marketing
Direct Navigation
“Conversion”
Day 1 Days 2-7 Days 7+
Ad Impression Landing Page Site Visits
Optimize!
Ad Networks
Awareness Consideration Conversion
Optimize!Optimize! Target! Target!
25. How to improve an Online Purchase Funnel:
• Create multiple (even targeted) landing pages. The language on your
landing page needs to match the Display Ad, Email, or Keyword that
brought the user there!
• Example: if a user searched on ‘Shoes’ and clicked on your ad, the landing
page should be the Shoes section, not your general storefront.
• Improving stick rates early in the funnel lead to better performance
later in the funnel.
• Understand the user “paths” that lead to conversion. Start with what’s
working, and decompose it into high conversion paths and low
conversion paths. Test & iterate.
• Constantly test (optimize) your checkout/conversion page(s). This is a
very important page – small improvements can mean a lot of money.
• Targeting can improve performance at every stage.
Improving Your Purchase Funnel
26. Optimization is the practice of using hypothesis testing and
experimentation to continuously improve site and campaign
performance.
Tactics include A/B and Multivariate Testing
Continuous Improvement methodology
Benefits
Sustained performance improvement
Predictable, controlled routine
Lower risk from changes
Works well with Targeting
Optimization
27. A
Did “Mobile” or “Online” get more pre-header clicks?
B
“Mobile”
“Online”
Which Test Won???
Optimization Examples
28. A
Did “Mobile” or “Online” get more pre-header clicks?
“Mobile”
Version A received a 173% increase in unique clicks
Test was conducted after learning 25% of members
read email on their mobile devices
Optimization Examples
29. Which Test Won???
A
Do we get more leads with sub-navigation?
BWithout Sub-Navigation With Sub-Navigation
Optimization Examples
30. Do we get more leads with sub-navigation?
B With Sub-Navigation
Version B increased leads by
39%.
Dell noticed a correlation
between leads and visitors
seeing 5 specific pages on the
site.
Good site analytics leads to
strong hypotheses!
Optimization Examples
32. A
Sarah
A
• Sarah drove 36% more account signups than Blair
Do people like Sarah or Blair better?
(which image increased account sign-ups?)
Optimization Examples
33. • Optimization should be an ongoing program – you will continue
to get benefit as long as you do it.
• As you get more sophisticated, you can run many experiments at
once. But don’t get sloppy with the samples
• Be patient – some tests (especially UX changes) take many
months to show results.
• Get agreement up front on the Evaluation Criteria with Business
and IT decision-makers.
• Be aware of confounding factors such as site changes that occur
independently of your experiments. They can pollute your
metrics and lead to incorrect conclusions.
• Targeting increases the power of Optimization.
Optimization Tips
34. • Bring data sources together to drive even more value.
• Connect as much data as possible to the Person level.
• Web & Mobile experiences offer a trove of useful data.
• Exercise this power in a way that improves the customer
experience without violating privacy standards.
Putting It All Together!
Demographics Technographics Preferences Current Intent Current Location
Age
Gender
Zip
Education
Income
Device
Operating System
Screen Size
Bandwidth
Hobbies
Lifestyle
Life Stage
Recent Transactions
Recent Views
Queries
Time of Day
Current Location
Speed
Direction
35. • Some customer attributes change very slowly (e.g. Demographics)
• Some attributes change very quickly (e.g. Current Location)
The Current Frontier:
• Algorithms that map data to the “Person”
• Company-wide data integration (Big Data!)
• Designing analytics systems to take advantage of fast-changing customer
attributes.
• Web, Phone, and Tablet experiences that all recognize you as the same
person.
• High-end visualization & segmentation tools.
Leveraging all of these capabilities to PREDICT what the customer
wants next.
This is the Frontier!
36. Living the Dream (Predictive Analytics)
Moving from Mass Marketing to
Predictive Marketing
“Every Customer A Segment”
3 - Prediction
• Gather & monitor customer
context
• Evaluate explicit customer
signals in the correct context
• Generate predictions of what
the customer is most likely to
need or do next
• Rapidly test and iterate
• Apply learning from each
customer to next customer in
near-realtime
LEAP
“10x ROI”
“Cast Different Nets”
2 - SegmentationSTEP
• Analyze historical customer
data to determine segments
• Create a strategy for each
segment, and goals to move
customers between segments
• Generate different messaging
for each segment
• Review performance and re-
craft messages, or re-segment
customer base
“3x ROI”
“Spray & Pray”
1 - Mass Market
• Perform market research from
sample of customers to
determine needs
• Create marketing messaging
that addresses the most
common needs
• Review performance and
adjust messaging, in context of
newest research
“1x ROI”
37. • To understand Web Analytics, you have to understand how the
data is generated. But don’t get lost among the trees.
• User Identification is an ongoing challenge and should be seen as
an area that will require mental bandwidth, creativity, and
innovation to get right.
• Don’t take Web Metrics at face value. Get nimble at de-
composing them and understanding the underlying trends.
• Optimization (A/B testing) programs take time to develop, but
pay off handsomely in the long run. Start learning sooner than
later.
• The grand prize when you put everything together is multi-
channel, predictive, customer-level analytics. This is the future of
business, not just analytics!
In Summary