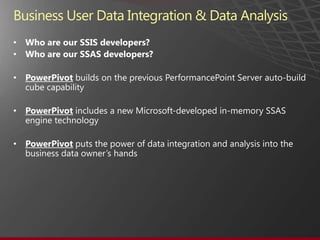
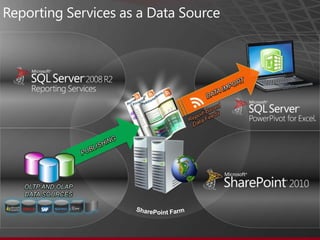
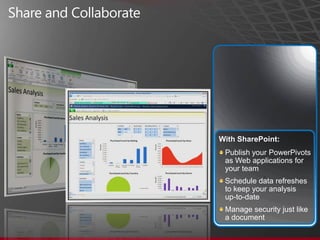
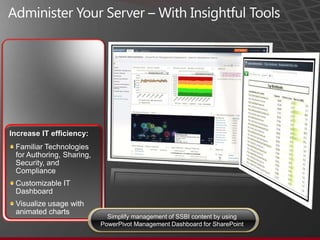
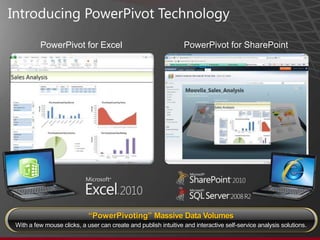
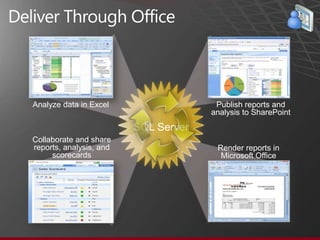
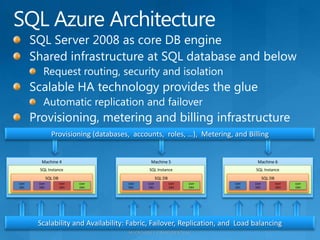
Data Integration with Microsoft PowerPivotMark KromerMicrosoft Technology SpecialistEmail: mkromer@microsoft.comSQL Blog: http://mssqldude.wordpress.comBI Blog: http://www.sqlmag.com/blogs/sql-server-bi.aspx
AgendaPowerPivotWhat is it?What is it used for?How do I get it?SQL Server 2008 R2 ReportingSSRS 2008Report BuilderOffice & SharePointCloud BISQL AzureProject HoustonProject DallasDEMOSPutting it all together with PowerPivot
Before We Begin …Who has heard of PowerPivot?Who has used it?Anyone have it in production today?What is the world’s most popular BI tool?CognosHyperionMicrostrategyExcelEXCELWhat is the world’s most popular BI delivery tool?Hyperion WorkspaceOracle WebLogic PortalSharePointSHAREPOINT
PowerPivot for Excel 2010PowerPivoting Massive Data VolumesWith a few mouse clicks, a user can create and publish intuitive and interactive self-service analysis solutions.
Business User Data Integration & Data AnalysisWho are our SSIS developers?Who are our SSAS developers?PowerPivot builds on the previous PerformancePoint Server auto-build cube capabilityPowerPivot includes a new Microsoft-developed in-memory SSAS engine technologyPowerPivot puts the power of data integration and analysis into the business data owner’s hands
Reporting Services as a Data SourceDATA IMPORTReport-BasedData FeedsPUBLISHINGOLTP AND OLAPDATA SOURCESSharePoint Farm
Share and CollaborateWith SharePoint:Publish your PowerPivots as Web applications for your teamSchedule data refreshes to keep your analysis up-to-dateManage security just like a document
Administer Your Server – With Insightful ToolsIncrease IT efficiency:Familiar Technologies for Authoring, Sharing, Security, and ComplianceCustomizable IT DashboardVisualize usage with animated chartsSimplify management of SSBI content by usingPowerPivot Management Dashboard for SharePoint
Introducing PowerPivotTechnology PowerPivot for ExcelPowerPivot for SharePoint“PowerPivoting” Massive Data VolumesWith a few mouse clicks, a user can create and publish intuitive and interactive self-service analysis solutions.
Deliver Through OfficeAnalyze data in ExcelPublish reports andanalysis to SharePointSQL ServerCollaborate and share reports, analysis, and scorecardsRender reports inMicrosoft Office
Capitalizing on Existing Reports with Report Part Gallery SourceReportNew ReportReusingReport ComponentsReusing common report elements helps to accelerate report creation, cut down costs, and increase end-user adoption. SharePoint provides the central location for sharing and editing reports and automatically synchronizes published content objects.
Self-service reportingPowerPivot & SharePoint lists as data sourcesReport Part Gallery for “grab and go” report design experienceFamiliar Microsoft Office InterfaceRich Visualizations
SQL Azure ArchitectureSQL Server 2008 as core DB engineShared infrastructure at SQL database and belowRequest routing, security and isolationScalable HA technology provides the glueAutomatic replication and failoverProvisioning, metering and billing infrastructureMachine 5Machine 6Machine 4SQL InstanceSQL InstanceSQL InstanceSQL DBSQL DBSQL DBUserDB1UserDB2UserDB3UserDB4UserDB1UserDB2UserDB3UserDB4UserDB1UserDB2UserDB3UserDB4Provisioning (databases,  accounts,  roles, …),  Metering, and BillingScalability and Availability: Fabric, Failover, Replication, and  Load balancing
© 2010 Microsoft Corporation. All rights reserved. This presentation is for informational purposes only. Microsoft makes no warranties, express or implied, in this summary.

Philly codecamp oct2010

  • 1.
    Data Integration withMicrosoft PowerPivotMark KromerMicrosoft Technology SpecialistEmail: mkromer@microsoft.comSQL Blog: http://mssqldude.wordpress.comBI Blog: http://www.sqlmag.com/blogs/sql-server-bi.aspx
  • 2.
    AgendaPowerPivotWhat is it?Whatis it used for?How do I get it?SQL Server 2008 R2 ReportingSSRS 2008Report BuilderOffice & SharePointCloud BISQL AzureProject HoustonProject DallasDEMOSPutting it all together with PowerPivot
  • 3.
    Before We Begin…Who has heard of PowerPivot?Who has used it?Anyone have it in production today?What is the world’s most popular BI tool?CognosHyperionMicrostrategyExcelEXCELWhat is the world’s most popular BI delivery tool?Hyperion WorkspaceOracle WebLogic PortalSharePointSHAREPOINT
  • 4.
    PowerPivot for Excel2010PowerPivoting Massive Data VolumesWith a few mouse clicks, a user can create and publish intuitive and interactive self-service analysis solutions.
  • 5.
    Business User DataIntegration & Data AnalysisWho are our SSIS developers?Who are our SSAS developers?PowerPivot builds on the previous PerformancePoint Server auto-build cube capabilityPowerPivot includes a new Microsoft-developed in-memory SSAS engine technologyPowerPivot puts the power of data integration and analysis into the business data owner’s hands
  • 6.
    Reporting Services asa Data SourceDATA IMPORTReport-BasedData FeedsPUBLISHINGOLTP AND OLAPDATA SOURCESSharePoint Farm
  • 7.
    Share and CollaborateWithSharePoint:Publish your PowerPivots as Web applications for your teamSchedule data refreshes to keep your analysis up-to-dateManage security just like a document
  • 8.
    Administer Your Server– With Insightful ToolsIncrease IT efficiency:Familiar Technologies for Authoring, Sharing, Security, and ComplianceCustomizable IT DashboardVisualize usage with animated chartsSimplify management of SSBI content by usingPowerPivot Management Dashboard for SharePoint
  • 9.
    Introducing PowerPivotTechnology PowerPivotfor ExcelPowerPivot for SharePoint“PowerPivoting” Massive Data VolumesWith a few mouse clicks, a user can create and publish intuitive and interactive self-service analysis solutions.
  • 10.
    Deliver Through OfficeAnalyzedata in ExcelPublish reports andanalysis to SharePointSQL ServerCollaborate and share reports, analysis, and scorecardsRender reports inMicrosoft Office
  • 11.
    Capitalizing on ExistingReports with Report Part Gallery SourceReportNew ReportReusingReport ComponentsReusing common report elements helps to accelerate report creation, cut down costs, and increase end-user adoption. SharePoint provides the central location for sharing and editing reports and automatically synchronizes published content objects.
  • 12.
    Self-service reportingPowerPivot &SharePoint lists as data sourcesReport Part Gallery for “grab and go” report design experienceFamiliar Microsoft Office InterfaceRich Visualizations
  • 13.
    SQL Azure ArchitectureSQLServer 2008 as core DB engineShared infrastructure at SQL database and belowRequest routing, security and isolationScalable HA technology provides the glueAutomatic replication and failoverProvisioning, metering and billing infrastructureMachine 5Machine 6Machine 4SQL InstanceSQL InstanceSQL InstanceSQL DBSQL DBSQL DBUserDB1UserDB2UserDB3UserDB4UserDB1UserDB2UserDB3UserDB4UserDB1UserDB2UserDB3UserDB4Provisioning (databases, accounts, roles, …), Metering, and BillingScalability and Availability: Fabric, Failover, Replication, and Load balancing
  • 14.
    © 2010 MicrosoftCorporation. All rights reserved. This presentation is for informational purposes only. Microsoft makes no warranties, express or implied, in this summary.

Editor's Notes

  • #5 Purpose of the Slide: Introduce PowerPivot for Excel 2010 as a data analysis tool that delivers unmatched computational power directly within Microsoft Excel.Key Points: Leveraging familiar Excel features, users can transform enormous quantities of data with incredible speed into meaningful information to get the answers they need in secondsExcel-based in-memory analysis overcomes existing limitations for massive data analysis on the desktop with efficient compression algorithms to load even the biggest data sets into memory.Data Analysis Expressions (DAX) puts powerful relational capabilities into the hands of power users who want to create advanced analytics applications.SharePoint integration enables users to share data models and analysis, and because the solutions are in SharePoint, users can configure refresh cycles to ensure the data remains current automatically.Virtually unlimited support of data sources provides the foundation to load and combine source data from any location for massive data analysis on the desktop, including relational databases, multidimensional sources, cloud services, data feeds, Excel files, text files, and data from the Web.PowerPivot Management Dashboard enables IT administrators to monitor and manage shared applications to ensure security, high availability, and performance.Conclusion: Microsoft SQL Server PowerPivot technology empowers users to get the answers they need, gain deeper insight into any business aspect, and compress decision cycles.
  • #7 Purpose of the slideOutline how IT departments can provide users with access to data in systems that are notoriously hard to get to, such as enterprise resource planning (ERP) systems and customer relationship management (CRM) systems. Key Points: All Reports created by using Report Builder 3.0 and Reporting Services included in SQL Server 2008 R2 expose data feeds to import the report data conveniently into PowerPivot for Excel 2010Reports can encapsulate mission-critical enterprise data sources and consolidate heterogeneous data sources for analysisIntegrating varied data sources in reports that serve as data feeds for analysis helps to speed up common or complex analysis tasks and increases consistencyConclusion: By taking advantage of SQL Server Reporting Services data feeds, organizations can provide users with secure access to the mission-critical information they need.
  • #8 Purpose of the slideHighlight the benefits of SharePoint Server 2010 to facilitate seamless and secure sharing and collaboration on user-generated BI solutions. Key Points: SharePoint 2010 makes it safe and easy for users to work together and boosts the productivity of project teams and business unitsStandard SharePoint permissions and workflows enable IT departments to coordinate how users share their solutionsAutomatic data refresh even for source systems over the Internet ensures accurate analysis and decision-makingReuse of workbooks and reports accelerates solution delivery, cuts development costs, and facilitates timely decisionsConclusion: To exploit all the BI capabilities available with PowerPivot for Excel 2010, deploy SQL Server 2008 R2 in a SharePoint 2010 environment.
  • #9 Purpose of the Slide: Cover the PowerPivot Management Dashboard in more detail.Key Points: IT administrators can determine author, data sources, and users of shared PowerPivot workbooksServer status information includes CPU and memory utilization, system capacity and performance, as well as workbook and user activity over timeQuality of service information covers query response times, current server state, as well as largest and most popular solutionsSolution statistics and monitoring reveal document information and data sources, activity and top users, as well as query performance per workbookConclusion: The PowerPivot Management Dashboard simplifies the management of self-service BI content.
  • #10 Purpose of the slideClarify that Microsoft SQL Server PowerPivot technology includes both an Excel add-in and server-based technology that integrates with SharePoint Server 2010. Key Points: SQL Server PowerPivot for Excel 2010 is a data analysis add-in that delivers unmatched computational power directly within Microsoft Excel SQL Server PowerPivot for Excel 2010 is available for download free of charge at www.powerpivot.com. SQL Server PowerPivot for SharePoint integrates with Excel Services on the SharePoint server to enable seamless and secure sharing and collaboration on user-generated BI solutions directly in the browserSQL Server PowerPivot for SharePoint is included in SQL Server 2008 R2Conclusion: SQL Server PowerPivot technology is the key to managed self-service BI, empowering users, enabling seamless and secure sharing and collaboration on user-generated BI solutions , and helping IT organizations increase efficiency through the PowerPivot Management Dashboard.
  • #12 Slide script:The report part gallery delivers a unique self-service reporting experience for end users by allowing them to search, access, and reuse pre-built report parts stored on a SharePoint Server. Users can filter and search for specific content and through a drag and drop interface, they can grab any of the desired components needed to further enhance their reports. The reusable parts retain all the underlying data source, the datasets, queries, formatting and layout and design characteristics - as well as any parameters and sub-reporting components - to ensure that the parts work independently and deliver the expected results. What this means is that the end user doesn't have to spend a lot of time thinking about how to create some of the more complex elements associated with parameters, subreports, interactivity, and so on.  In just a few clicks they can build some very nice-looking, interactive, professional reports using the powerful wizards in Report Builder 3.0 and the existing report elements from the Report Part Gallery. 
  • #13 Slide Script:In just a few clicks they can build some very nice-looking, interactive, professional reports using the powerful wizards in Report Builder 3.0 and the existing report elements from the Report Part Gallery.  What’s great about this is that users can take different elements that they like from multiple reports - regardless of the version of Reporting Services used to create those reports – and use them as building blocks for creating some very nice-looking, interactive, professional reports in just a few clicks…giving a whole new meaning to self-service reporting. This approach delivers greater efficiency to IT Professionals because it takes them out of the business of constantly modifying existing reports or creating similar reports for end users. Instead they can create some nicely designed report parts that can be used more broadly across the organization. This is a great segue to our final focus area for enabling Managed Self Service BI. 
  • #14 From the customer’s perspective, SQL Azure provides logical databases for application data storage. In reality, each customer’s data is actually stored in multiple SQL Server databases, which are distributed across multiple physical servers. Many customers may share the same physical database, but the data is presented to the customer through a logical database that abstracts the physical storage architecture and uses automatic load balancing and connection routing to access the distributed data. Security and isolation is managed automatically.The key impact of this model for the customer is a move from managing physical servers to focus on logical management of data storage through policies.Shared infrastructure at SQL database and belowEach user database is replicated to one or more servers (configurable based on SLA)Client requests are routed to current “primary server” for read and write operations (based on SQL session)Security, lockdown and isolation enforced in SQL tierHighly scalable and state-of-the-art HA technologyAutomatic failure detection; client request re-routed to new primary on failure High SLA guarantee using logical replication (hot standby replicas)Automatic management, self-healing and load balancing across shared resource poolSDS provides provisioning, metering and billing infrastructure