Graduation project
•Download as PPTX, PDF•
1 like•313 views

INDAVI is a new Data Visualization Framework developed by Me and My team at Computer Science Faculty in Helwan University.
Report
Share
Report
Share

Recommended
Hobbit presentation at Apache Big Data Europe 2016
The document discusses the HOBBIT platform for benchmarking big data platforms. It aims to provide a unified benchmarking platform as a community-driven effort. The platform will include reference datasets and implementations of key performance indicators to standardize benchmarking and allow comparison of results. It will focus on benchmarking tasks related to big linked data and the entire data lifecycle.
Benchmarking Linked Data Introductory Remarks
An overview of the workshop as presented at the 1st International Workshop on Benchmarking Linked Data (BLINK).
(HOBBIT project has received funding from the European Union’s Horizon 2020 research and innovation programme under grant agreement No 688227.)
Workshop Report Benchmarking Linked Data
A summary of the workshop as presented at the 1st International Workshop on Benchmarking Linked Data (BLINK).
(HOBBIT project has received funding from the European Union’s Horizon 2020 research and innovation programme under grant agreement No 688227.)
Lecture09 computer applicationsie1_dratifshahzad
This document summarizes a lecture on computer applications in industrial engineering. It discusses classes and objects in C#, adding controls to Windows forms, and control properties and layout. It also mentions event handling in graphical user interfaces and generated code in Visual Studio forms. The document is a recap of topics covered and encourages students to contact the lecturer with any questions.
2013 05-27-yhat-about
The document discusses a web platform called Yhat that allows data scientists to easily integrate predictive models into software applications. Yhat provides tools to deploy models written in R, Python, or Excel as web services with a simple API. This addresses the challenge of porting models between languages that developers currently face. Yhat has seen growing interest since its launch three months ago, with over 30,000 monthly visitors and 117 models deployed.
Data Lifecycle is not a Cycle, but a Plane!
This is a presentation based on an abstract published on ICEI 2018 that introduces a new iterative and highly flexible data life cycle
zbresume112716
This document is a resume for Zarin Bhuiyan summarizing their education and experience. Zarin is studying Electrical and Computer Engineering at Olin College of Engineering and has experience in areas such as software development, circuits, 3D printing, and research. Notable experiences include developing SOLIDWORKS tutorials as an intern at Dassault Systemes and working on teams to build a robotic turtle and design services for caregivers.
Uncertainty Visualization Framework for Improving Situational Awarenes...
Uncertainty Visualization Framework for Improving Situational Awareness in Emergency Management Systems
Visualización de la información RDCM
Este documento trata sobre la visualización de la información. Define la visualización de la información como la representación gráfica de un conjunto de datos, ya sean simples o complejos, con el objetivo de analizarlos. Explica las etapas del proceso de visualización: recopilación de datos, procesamiento, y representación visual. También presenta ejemplos como tablas, gráficos y árboles, e identifica elementos clave como la satisfacción del usuario y modelos conceptuales. Concluye que la cultura futura estará definida por las interfaces
Visualizing Data: The 7 stages of data visualization
El documento resume los conceptos clave de la visualización de datos según Ben Fry. Describe los 7 pasos del proceso de visualización de datos, incluyendo adquirir, analizar, filtrar, extraer, representar, refinar e interactuar. También cubre los fundamentos de la visualización de datos según Fry, como usar la menor cantidad de datos posible para comunicar un mensaje significativo.
Visualizacion de la Infomación. De los datos al conocimiento.
La visualización de la información es un disciplina realmente fascinante cuyo interés no ha hecho más que despegar. Si por ejemplo buscamos infographics o data visualization en internet podremos comprobar que el interés crece día a día. Mires donde mires hay información visual que reclama tu atención. La comunicación efectiva e inmediata a través de una simple y fácil visualización prima frente a largos textos de compleja asimilación. Pero… ¿Qué es realmente la visualización de la información? En tus manos tienes una obra práctica que te ayudará a introducirte en la visualización de la información, el proceso de trabajo con datos y las herramientas más comunes.
http://www.editorialuoc.cat/visualizacindelainformacin-p-1674.html?cPath=1
Business intelligence data analytics-visualization
Business Intelligence, Cloud Computing, Data Analytics, Data Scrubbing, Data Mining, Big Data & Intelligence, How to use Data into Information, Decision Based, Methods for Business Intelligence, Advanced Analytics, OLAP, Multidimensional Data, Data Visualization.
Visualizaciones
Este documento discute cómo los recursos de visualización de datos, como gráficos, mapas y nubes de palabras, pueden usarse para contar historias complejas de una manera entendible. Se presentan ejemplos como las visualizaciones de datos del médico Hans Rosling y el artista Jonathan Harris. También se describen formatos comunes como mapas, gráficos de barras y líneas, así como nuevos formatos emergentes. El documento argumenta que la visualización de datos permite procesar grandes cantidades de información y encontrar historias en datos aburridos
Role of Visualization in Data Management
The document outlines the various stages of data management from collection to analysis and how visualization can aid at each stage. It discusses using visualizations like trees, graphs and networks to plan the data management process and understand relationships between datasets during collection. During collection, visualization can also help understand results from data mining algorithms and the structure of files. At the assurance stage, graphical summaries produced from statistical operations on datasets can be used for security and quality checks. Visualizations like multi-dimensional maps and volumes can then be used for process monitoring and quality assurance. Visualization is also discussed as a way to understand and analyze large web archives by examining file hierarchies and types during preservation. Finally, different visualizations can be applied during analysis depending on user needs
Web semántica
Este documento describe los componentes y aplicaciones de la Web Semántica. Explica que la Web Semántica es una extensión de la Web existente que utiliza lenguajes formales como RDF, OWL y XML para estructurar el contenido y representar el conocimiento de manera que las máquinas puedan procesar y comprender la información de forma más efectiva. Esto permitirá el desarrollo de agentes inteligentes y servicios automatizados que puedan buscar y procesar información de manera más precisa.
Gmcghee bayvis meetup_111027
Presentation slides:Telling Stories with Data
Geoff McGhee is the Creative Director of Media and Communications and a former John S. Knight Journalism fellow at Stanford University.
CAPA DE PRESENTACIÓN
La capa de presentación del modelo OSI proporciona una estandarización en la transmisión de datos entre sistemas. Se encarga de representar la información de forma reconocible al ocuparse de los aspectos semánticos y sintácticos de la comunicación, como la compresión, cifrado y estructura de los datos. También puede implementar aplicaciones de criptografía.
Data Visualization for Business - Pallav Nadhani
The document discusses data visualization for business purposes. It notes that data visualization combines art, science, math and technology to visually display measurable quantities using tools like points, lines, curves and color to understand, substantiate hypotheses and discover from data. The document outlines different types of visualizations and provides tips for effective business data visualization like knowing your audience, choosing the right type of visualization, and exploring ways to enhance it. It stresses tailoring visualizations to the goals, roles and needs of different business departments and positions.
Quiénes somos - DataLab Community
Nueva introducción de DataLab Community del 2017. Somos una comunidad abierta de Ciencia de Datos. Generamos colaboración entre profesionales y aprendices, compartiendo conocimientos, desarrollando habilidades y vinculando para impulsar la Ciencia de Datos.
Design activity framework for visualization design
This document presents a design activity framework for visualization design. It outlines four main design activities: understand, ideate, make, and deploy. Each activity has a specific motivation and outcomes. A variety of methods are provided that can be used within each design activity, including both generative and evaluative methods. The framework is intended to provide structure and flexibility to the visualization design process.
Visual analytics: poniendo en valor el dato a través de la visualización
Este documento presenta un taller sobre visualización analítica de datos. Explica brevemente la historia de la visualización de información, desde Priestley en el siglo XVIII hasta Wilkinson en el siglo XX. Define conceptos clave como visualización de datos, visualización de información, geovisualización y visual analytics. Describe el proceso de visualización, incluyendo la transformación de datos univariados, bivariados y multivariados, y la codificación de valores y relaciones a través de líneas, mapas y diagramas. El documento también cubre principios
Ejemplos Data Visualization
Este documento trata sobre la importancia de la visualización de datos. Menciona que al visualizar los datos se producen revelaciones y que la visualización de datos no es solo una tarea de cartógrafos, programadores o estadísticos, sino que cualquiera puede visualizar sus propios datos. También destaca que la visualización de datos es tan importante como los datos mismos y proporciona algunos ejemplos de herramientas y sitios web para la visualización de datos.
Big data visualization framework
Big data visualization frameworks allow for analyzing and visualizing large datasets. The document discusses a big data visualization framework created by Abhinav Krishna to enable analyzing and visualizing large amounts of data. The framework helps users understand insights and patterns in big data through interactive visualizations.
Visualizacion de datos
La visualización de datos es el estudio de la representación visual de datos para comunicar información de manera clara y efectiva a través de medios gráficos. Requiere experiencia en múltiples disciplinas como el diseño, la comunicación y la información. La visualización de datos tiene como objetivo no solo comunicar la información de manera clara, sino también estimular la participación y atención del espectador.
Ciclo de vida del dato en ambientes de Business Intelligence
Taller práctico "Ciclo de vida del dato en ambientes de Business Intelligence" como primer paso a la capacitación de una organización para la explotación de los datos para aumentar la inteligencia de negocios.
Frontend Architecture and Data Visualization
Frontend Architecture and Data Visualization at Altocloud. Altocloud connects your business with the right customers at the right time in their journey – improving conversions and enhancing customer experience.
Data Visualization & Content Analytics: Nuxeo Platform LTS 2015
This document discusses Nuxeo Data Visualization. It provides structured and consistent data from a content repository that is available for users whenever needed. It features visual dashboards that provide insights into data to help with decision making. Specific elements discussed include repository, search, and workflow data visualizations that are securely scalable and have powerful search and filtering capabilities. Nuxeo Elements are also discussed as a way to build custom elements and applications using standards like Web Components and Polymer.
Construyendo un panel de visualización de indicadores clave
Taller práctico "Construyendo un panel de visualización de indicadores clave" como tercer paso a la capacitación de una organización para la explotación de los datos para aumentar la inteligencia de negocios.
Smart service systems 20150504 v3
The document summarizes a presentation given by Jim Spohrer from IBM on smart service systems and cognitive assistants. Some key points:
- A service science perspective considers how service systems, value co-creation, and capabilities evolve through interactions between entities that have different capabilities, constraints, rights, and responsibilities.
- Cognitive systems and cognitive assistants can help augment and scale human expertise.
- IBM is working on developing cognitive assistants that can help with different occupations by assisting with various tasks.
- The vision is for cognitive technologies and assistants to augment and scale human expertise across many domains.
Big data analytics
The document discusses big data analytics and tools. It introduces the concept of an "Internet of Corporate Things" and expanding analytics beyond just corporate data. It emphasizes that new tools and approaches are needed to take advantage of big data. The document provides guidance on starting a big data analytics initiative, including choosing a pilot use case, designing a new data architecture with a data lake, building an analytics center of excellence, and training analysts. It also summarizes various big data analytics tools for storage, delivery, and analyzing large datasets.
More Related Content
Viewers also liked
Visualización de la información RDCM
Este documento trata sobre la visualización de la información. Define la visualización de la información como la representación gráfica de un conjunto de datos, ya sean simples o complejos, con el objetivo de analizarlos. Explica las etapas del proceso de visualización: recopilación de datos, procesamiento, y representación visual. También presenta ejemplos como tablas, gráficos y árboles, e identifica elementos clave como la satisfacción del usuario y modelos conceptuales. Concluye que la cultura futura estará definida por las interfaces
Visualizing Data: The 7 stages of data visualization
El documento resume los conceptos clave de la visualización de datos según Ben Fry. Describe los 7 pasos del proceso de visualización de datos, incluyendo adquirir, analizar, filtrar, extraer, representar, refinar e interactuar. También cubre los fundamentos de la visualización de datos según Fry, como usar la menor cantidad de datos posible para comunicar un mensaje significativo.
Visualizacion de la Infomación. De los datos al conocimiento.
La visualización de la información es un disciplina realmente fascinante cuyo interés no ha hecho más que despegar. Si por ejemplo buscamos infographics o data visualization en internet podremos comprobar que el interés crece día a día. Mires donde mires hay información visual que reclama tu atención. La comunicación efectiva e inmediata a través de una simple y fácil visualización prima frente a largos textos de compleja asimilación. Pero… ¿Qué es realmente la visualización de la información? En tus manos tienes una obra práctica que te ayudará a introducirte en la visualización de la información, el proceso de trabajo con datos y las herramientas más comunes.
http://www.editorialuoc.cat/visualizacindelainformacin-p-1674.html?cPath=1
Business intelligence data analytics-visualization
Business Intelligence, Cloud Computing, Data Analytics, Data Scrubbing, Data Mining, Big Data & Intelligence, How to use Data into Information, Decision Based, Methods for Business Intelligence, Advanced Analytics, OLAP, Multidimensional Data, Data Visualization.
Visualizaciones
Este documento discute cómo los recursos de visualización de datos, como gráficos, mapas y nubes de palabras, pueden usarse para contar historias complejas de una manera entendible. Se presentan ejemplos como las visualizaciones de datos del médico Hans Rosling y el artista Jonathan Harris. También se describen formatos comunes como mapas, gráficos de barras y líneas, así como nuevos formatos emergentes. El documento argumenta que la visualización de datos permite procesar grandes cantidades de información y encontrar historias en datos aburridos
Role of Visualization in Data Management
The document outlines the various stages of data management from collection to analysis and how visualization can aid at each stage. It discusses using visualizations like trees, graphs and networks to plan the data management process and understand relationships between datasets during collection. During collection, visualization can also help understand results from data mining algorithms and the structure of files. At the assurance stage, graphical summaries produced from statistical operations on datasets can be used for security and quality checks. Visualizations like multi-dimensional maps and volumes can then be used for process monitoring and quality assurance. Visualization is also discussed as a way to understand and analyze large web archives by examining file hierarchies and types during preservation. Finally, different visualizations can be applied during analysis depending on user needs
Web semántica
Este documento describe los componentes y aplicaciones de la Web Semántica. Explica que la Web Semántica es una extensión de la Web existente que utiliza lenguajes formales como RDF, OWL y XML para estructurar el contenido y representar el conocimiento de manera que las máquinas puedan procesar y comprender la información de forma más efectiva. Esto permitirá el desarrollo de agentes inteligentes y servicios automatizados que puedan buscar y procesar información de manera más precisa.
Gmcghee bayvis meetup_111027
Presentation slides:Telling Stories with Data
Geoff McGhee is the Creative Director of Media and Communications and a former John S. Knight Journalism fellow at Stanford University.
CAPA DE PRESENTACIÓN
La capa de presentación del modelo OSI proporciona una estandarización en la transmisión de datos entre sistemas. Se encarga de representar la información de forma reconocible al ocuparse de los aspectos semánticos y sintácticos de la comunicación, como la compresión, cifrado y estructura de los datos. También puede implementar aplicaciones de criptografía.
Data Visualization for Business - Pallav Nadhani
The document discusses data visualization for business purposes. It notes that data visualization combines art, science, math and technology to visually display measurable quantities using tools like points, lines, curves and color to understand, substantiate hypotheses and discover from data. The document outlines different types of visualizations and provides tips for effective business data visualization like knowing your audience, choosing the right type of visualization, and exploring ways to enhance it. It stresses tailoring visualizations to the goals, roles and needs of different business departments and positions.
Quiénes somos - DataLab Community
Nueva introducción de DataLab Community del 2017. Somos una comunidad abierta de Ciencia de Datos. Generamos colaboración entre profesionales y aprendices, compartiendo conocimientos, desarrollando habilidades y vinculando para impulsar la Ciencia de Datos.
Design activity framework for visualization design
This document presents a design activity framework for visualization design. It outlines four main design activities: understand, ideate, make, and deploy. Each activity has a specific motivation and outcomes. A variety of methods are provided that can be used within each design activity, including both generative and evaluative methods. The framework is intended to provide structure and flexibility to the visualization design process.
Visual analytics: poniendo en valor el dato a través de la visualización
Este documento presenta un taller sobre visualización analítica de datos. Explica brevemente la historia de la visualización de información, desde Priestley en el siglo XVIII hasta Wilkinson en el siglo XX. Define conceptos clave como visualización de datos, visualización de información, geovisualización y visual analytics. Describe el proceso de visualización, incluyendo la transformación de datos univariados, bivariados y multivariados, y la codificación de valores y relaciones a través de líneas, mapas y diagramas. El documento también cubre principios
Ejemplos Data Visualization
Este documento trata sobre la importancia de la visualización de datos. Menciona que al visualizar los datos se producen revelaciones y que la visualización de datos no es solo una tarea de cartógrafos, programadores o estadísticos, sino que cualquiera puede visualizar sus propios datos. También destaca que la visualización de datos es tan importante como los datos mismos y proporciona algunos ejemplos de herramientas y sitios web para la visualización de datos.
Big data visualization framework
Big data visualization frameworks allow for analyzing and visualizing large datasets. The document discusses a big data visualization framework created by Abhinav Krishna to enable analyzing and visualizing large amounts of data. The framework helps users understand insights and patterns in big data through interactive visualizations.
Visualizacion de datos
La visualización de datos es el estudio de la representación visual de datos para comunicar información de manera clara y efectiva a través de medios gráficos. Requiere experiencia en múltiples disciplinas como el diseño, la comunicación y la información. La visualización de datos tiene como objetivo no solo comunicar la información de manera clara, sino también estimular la participación y atención del espectador.
Ciclo de vida del dato en ambientes de Business Intelligence
Taller práctico "Ciclo de vida del dato en ambientes de Business Intelligence" como primer paso a la capacitación de una organización para la explotación de los datos para aumentar la inteligencia de negocios.
Frontend Architecture and Data Visualization
Frontend Architecture and Data Visualization at Altocloud. Altocloud connects your business with the right customers at the right time in their journey – improving conversions and enhancing customer experience.
Data Visualization & Content Analytics: Nuxeo Platform LTS 2015
This document discusses Nuxeo Data Visualization. It provides structured and consistent data from a content repository that is available for users whenever needed. It features visual dashboards that provide insights into data to help with decision making. Specific elements discussed include repository, search, and workflow data visualizations that are securely scalable and have powerful search and filtering capabilities. Nuxeo Elements are also discussed as a way to build custom elements and applications using standards like Web Components and Polymer.
Construyendo un panel de visualización de indicadores clave
Taller práctico "Construyendo un panel de visualización de indicadores clave" como tercer paso a la capacitación de una organización para la explotación de los datos para aumentar la inteligencia de negocios.
Viewers also liked (20)
Visualizing Data: The 7 stages of data visualization
Visualizing Data: The 7 stages of data visualization
Visualizacion de la Infomación. De los datos al conocimiento.
Visualizacion de la Infomación. De los datos al conocimiento.
Business intelligence data analytics-visualization
Business intelligence data analytics-visualization
Design activity framework for visualization design
Design activity framework for visualization design
Visual analytics: poniendo en valor el dato a través de la visualización
Visual analytics: poniendo en valor el dato a través de la visualización
Ciclo de vida del dato en ambientes de Business Intelligence
Ciclo de vida del dato en ambientes de Business Intelligence
Data Visualization & Content Analytics: Nuxeo Platform LTS 2015
Data Visualization & Content Analytics: Nuxeo Platform LTS 2015
Construyendo un panel de visualización de indicadores clave
Construyendo un panel de visualización de indicadores clave
Similar to Graduation project
Smart service systems 20150504 v3
The document summarizes a presentation given by Jim Spohrer from IBM on smart service systems and cognitive assistants. Some key points:
- A service science perspective considers how service systems, value co-creation, and capabilities evolve through interactions between entities that have different capabilities, constraints, rights, and responsibilities.
- Cognitive systems and cognitive assistants can help augment and scale human expertise.
- IBM is working on developing cognitive assistants that can help with different occupations by assisting with various tasks.
- The vision is for cognitive technologies and assistants to augment and scale human expertise across many domains.
Big data analytics
The document discusses big data analytics and tools. It introduces the concept of an "Internet of Corporate Things" and expanding analytics beyond just corporate data. It emphasizes that new tools and approaches are needed to take advantage of big data. The document provides guidance on starting a big data analytics initiative, including choosing a pilot use case, designing a new data architecture with a data lake, building an analytics center of excellence, and training analysts. It also summarizes various big data analytics tools for storage, delivery, and analyzing large datasets.
NUS-ISS Learning Day 2015 - IoT with Pi
The presentation gives an overview of the Raspberry Pi SOC computer and demonstrate connecting various devices to it.
Spohrer icer 20150810 v1
ICER 2015 Keynote
Computing Education Research
Programming Education, Future Trends, Societal Building Blocks
Naples forum on service 20150610 v4
boosting the creativity and productivity of people in smart service systems at the Naples Forum on Service, Naples, Italy June 10, 2015
Accelerating SDLC for Large Public Sector Enterprise Applications
This document discusses how big data analytics tools like Splunk can be used to accelerate the software development lifecycle for large public sector applications. It provides examples of how Splunk was used to improve productivity by enabling immediate log access across many servers and files. Splunk also created real-time performance dashboards to help identify root causes of issues. Additional analytics revealed insights like peak usage times and patterns, user behaviors on forms, and browser/device details. The summary concludes that these tools can improve IT and business while providing lessons on proper Splunk setup and logging the right application data.
Csig 20150723 v2
The document discusses IBM's Cognitive Systems Institute Group (CSIG) and its director Jim Spohrer. CSIG works to build cognitive systems and platforms using techniques from fields like natural language processing, machine learning, and neuromorphic computing. The goal is to develop cognitive assistants that can augment human expertise to help solve complex problems. Universities are seen as important partners in this work through collaborations on research and by inspiring students to help build smarter service systems for the future.
How much does it cost to build a mobile app?
How much does it cost to build a mobile app? That's probably the most asked question for mobile app developers. This presentation give insight into mobile app development process and how business people/clients can get better answers by providing more information when asking for app development cost estimates.
Bringing Cities, Libraries and Citizens Together through Open Data Hackathons
This document discusses how open data hackathons can bring cities, libraries, and citizens together. It provides details about Edmonton Public Library's partnership with the City of Edmonton to host International Open Data Day hackathons in 2014 and 2015. A variety of projects were created at these events to visualize and analyze open data. Surveys found that participants enjoyed networking and learning new skills. To improve future events, suggestions included providing more structure, guidance on open data, and ensuring enough time for projects. The hackathons helped the library and city collaborate to engage the community and realize the potential of open data.
DOES15 - Sherry Chang - Intel’s Journey to Large Scale DevOps Transformation
Sherry Chang, Enterprise Architect, Intel
Is it possible to transform large enterprises with 100’s of in-flight projects across myriad technology stacks and entrenched processes, requiring massive workforce re-skilling? In this session, I’ll share approaches we employed to increase the likelihood of success through DevOps adoption by:
-Offering of a common Continuous Delivery Service, similar to industry offerings from Codeship.io, CloudBees, and others
-Establishing a Maturity Model to help teams incrementally adopt DevOps practices
-Coaching teams through Kaizen sessions to eliminate bottlenecks and waste in their value stream
Preparing Big Data for Analysis with Easyl
This document discusses different approaches to data preparation for business intelligence. It describes manual data preparation as time-intensive and not scalable. Large IT projects can automate data preparation but require high initial costs. Technology solutions provide a middle ground by offering collaborative data preparation tools that are quicker and cheaper than large projects but require new skills. The document then discusses Progress Easyl as an example technology solution, highlighting its features like uniting different data sources, filtering and enriching data, and sharing reports.
WSO2CON 2024 - OSU & WSO2: A Decade Journey in Integration & Innovation
WSO2CON 2024 - OSU & WSO2: A Decade Journey in Integration & Innovation
Repository Power: How Repositories can support Open Access Mandates (OR2015 O...
OpenAIRE presentation at the Open Repositories Conference (OR2015), in Indianapolis, 10/Jun/2015 - Session - P4B: Supporting Open Scholarship and Open Science. Presented by Wolfram Horstmann (Univ. Goettingen) on behalf of the paper authors: Najla Rettberg, Jochen Schirrwagen, Pedro Principe, Eloy Rodrigues, José Carvalho, Paolo Manghi, Natalia Manola.
The Internet of Things and Developers: What the Enterprise Needs to Know
Developers hold the key to realizing IoT. What do enterprises need to know?
Whatever your IoT vision is for the business, developers are the ones who are going to help make it a reality.
We uncover the results of an extensive first-party research where we explore the current state of IoT and how it differs from popular perception.
The webcast, led by Evans data and Apigee will address:
- What is the current state of IoT development?
- Is an IoT developer different from a mobile developer?
- What expectations exist around APIs, big data, cloud?
- How can enterprises realize value from IoT development decisions?
Download podcast: http://bit.ly/1EDYdHc
STKI Summit 2014 Infra Trends - How CIO Deliver - complete infra trends
How CIO Deliver -STKI Summit 2014- Full presentation- Storage, Servers, Desktops, Software, IT Procurement, Organizational Structure, cloud, etc.
E2D3 introduction
E2D3 is Opensource, Intaractive, Dynamic Data Visualization platform on Excel.
It's Easy, Useful, and Intuitive.
Use E2D3 app for powerful presentation of your data.
Session T6 - Artificial Intelligence Meets Project Controls
Charlie Sundling is the CEO of Pipeline Software and has over 25 years experience in computer science and project management. He will give a presentation on an artificial intelligence system developed jointly with US civil nuclear operators to improve management of complex reactor refueling projects. The presentation will discuss how the AI system was able to monitor thousands of tasks and communicate with hundreds of workers in parallel to analyze schedules every 30 seconds and distribute updates, taking over work that would otherwise require 200 additional human project managers. The case study showed results including a 90% reduction in status chasing, improved visibility and resource utilization, and avoiding project delays worth millions of dollars.
The Rationale for Continuous Delivery (The culture and practice of good softw...
Video and slides synchronized, mp3 and slide download available at URL http://bit.ly/1Ff5T3D.
Dave Farley discusses the problems raised by inefficient processes creating poor quality output, too late to capitalise on the expected business value, and proposes solutions to them. Filmed at qconlondon.com.
Dave Farley is a thought-leader in the field of Continuous Delivery, DevOps and Software Development in general. He is co-author of the Jolt-award winning book 'Continuous Delivery', a regular conference speaker, blogger and a contributor to the Reactive Manifesto.
Emergent Design: History, Concepts, and Principles
Software design is about change. A good design facilitates adding features—and adding new developers to the team. Yet any change to the code impacts design and could damage existing functionality. Without design idioms and practices, the code can degrade into a "big ball of spaghetti” and a maintenance nightmare. Your team must know which decisions to make early in design and which to defer. Rob Myers reviews “families” of design attributes and practices, showing the common principles within each. Exploring emergent design by tracing how the concept itself has evolved and matured over time, Rob covers traditional attributes of good object-oriented code (cohesion, encapsulation, polymorphism, coupling); design patterns and the wisdom discovered within; S.O.L.I.D. principles—all culminating in emergent design, where simple (not easy) practices meet the simplest of guidelines, such as Kent Beck’s “Four Rules of Simple Design.” And the result is code that is easy to understand and delightful to work on.
Eecs6893 big dataanalytics-lecture1
This document provides an overview of a lecture on big data analytics given by Dr. Ching-Yung Lin. The key points covered in the lecture include:
- Definitions and characteristics of big data based on the 3V's of volume, velocity and variety.
- Techniques used for big data such as massive parallelism, distributed storage and processing, machine learning and data visualization.
- Factors that have enabled big data to become prominent in recent years like greater data collection, open source software and commodity hardware.
- Examples of big data platforms, databases and analytics techniques including Hadoop, Spark, NoSQL databases and graph databases.
- The large and growing market for big data
Similar to Graduation project (20)
Accelerating SDLC for Large Public Sector Enterprise Applications
Accelerating SDLC for Large Public Sector Enterprise Applications
Bringing Cities, Libraries and Citizens Together through Open Data Hackathons
Bringing Cities, Libraries and Citizens Together through Open Data Hackathons
DOES15 - Sherry Chang - Intel’s Journey to Large Scale DevOps Transformation
DOES15 - Sherry Chang - Intel’s Journey to Large Scale DevOps Transformation
WSO2CON 2024 - OSU & WSO2: A Decade Journey in Integration & Innovation
WSO2CON 2024 - OSU & WSO2: A Decade Journey in Integration & Innovation
Repository Power: How Repositories can support Open Access Mandates (OR2015 O...
Repository Power: How Repositories can support Open Access Mandates (OR2015 O...
The Internet of Things and Developers: What the Enterprise Needs to Know
The Internet of Things and Developers: What the Enterprise Needs to Know
STKI Summit 2014 Infra Trends - How CIO Deliver - complete infra trends
STKI Summit 2014 Infra Trends - How CIO Deliver - complete infra trends
Session T6 - Artificial Intelligence Meets Project Controls
Session T6 - Artificial Intelligence Meets Project Controls
The Rationale for Continuous Delivery (The culture and practice of good softw...
The Rationale for Continuous Delivery (The culture and practice of good softw...
Emergent Design: History, Concepts, and Principles
Emergent Design: History, Concepts, and Principles
Recently uploaded
一比一原版(Dalhousie毕业证书)达尔豪斯大学毕业证如何办理
原版定制【微信:41543339】【(Dalhousie毕业证书)达尔豪斯大学毕业证】【微信:41543339】成绩单、外壳、offer、留信学历认证(永久存档真实可查)采用学校原版纸张、特殊工艺完全按照原版一比一制作(包括:隐形水印,阴影底纹,钢印LOGO烫金烫银,LOGO烫金烫银复合重叠,文字图案浮雕,激光镭射,紫外荧光,温感,复印防伪)行业标杆!精益求精,诚心合作,真诚制作!多年品质 ,按需精细制作,24小时接单,全套进口原装设备,十五年致力于帮助留学生解决难题,业务范围有加拿大、英国、澳洲、韩国、美国、新加坡,新西兰等学历材料,包您满意。
【我们承诺采用的是学校原版纸张(纸质、底色、纹路),我们拥有全套进口原装设备,特殊工艺都是采用不同机器制作,仿真度基本可以达到100%,所有工艺效果都可提前给客户展示,不满意可以根据客户要求进行调整,直到满意为止!】
【业务选择办理准则】
一、工作未确定,回国需先给父母、亲戚朋友看下文凭的情况,办理一份就读学校的毕业证【微信41543339】文凭即可
二、回国进私企、外企、自己做生意的情况,这些单位是不查询毕业证真伪的,而且国内没有渠道去查询国外文凭的真假,也不需要提供真实教育部认证。鉴于此,办理一份毕业证【微信41543339】即可
三、进国企,银行,事业单位,考公务员等等,这些单位是必需要提供真实教育部认证的,办理教育部认证所需资料众多且烦琐,所有材料您都必须提供原件,我们凭借丰富的经验,快捷的绿色通道帮您快速整合材料,让您少走弯路。
留信网认证的作用:
1:该专业认证可证明留学生真实身份
2:同时对留学生所学专业登记给予评定
3:国家专业人才认证中心颁发入库证书
4:这个认证书并且可以归档倒地方
5:凡事获得留信网入网的信息将会逐步更新到个人身份内,将在公安局网内查询个人身份证信息后,同步读取人才网入库信息
6:个人职称评审加20分
7:个人信誉贷款加10分
8:在国家人才网主办的国家网络招聘大会中纳入资料,供国家高端企业选择人才
留信网服务项目:
1、留学生专业人才库服务(留信分析)
2、国(境)学习人员提供就业推荐信服务
3、留学人员区块链存储服务
→ 【关于价格问题(保证一手价格)】
我们所定的价格是非常合理的,而且我们现在做得单子大多数都是代理和回头客户介绍的所以一般现在有新的单子 我给客户的都是第一手的代理价格,因为我想坦诚对待大家 不想跟大家在价格方面浪费时间
对于老客户或者被老客户介绍过来的朋友,我们都会适当给一些优惠。
选择实体注册公司办理,更放心,更安全!我们的承诺:客户在留信官方认证查询网站查询到认证通过结果后付款,不成功不收费!
一比一原版(Harvard毕业证书)哈佛大学毕业证如何办理
毕业原版【微信:41543339】【(Harvard毕业证书)哈佛大学毕业证】【微信:41543339】成绩单、外壳、offer、留信学历认证(永久存档真实可查)采用学校原版纸张、特殊工艺完全按照原版一比一制作(包括:隐形水印,阴影底纹,钢印LOGO烫金烫银,LOGO烫金烫银复合重叠,文字图案浮雕,激光镭射,紫外荧光,温感,复印防伪)行业标杆!精益求精,诚心合作,真诚制作!多年品质 ,按需精细制作,24小时接单,全套进口原装设备,十五年致力于帮助留学生解决难题,业务范围有加拿大、英国、澳洲、韩国、美国、新加坡,新西兰等学历材料,包您满意。
【我们承诺采用的是学校原版纸张(纸质、底色、纹路),我们拥有全套进口原装设备,特殊工艺都是采用不同机器制作,仿真度基本可以达到100%,所有工艺效果都可提前给客户展示,不满意可以根据客户要求进行调整,直到满意为止!】
【业务选择办理准则】
一、工作未确定,回国需先给父母、亲戚朋友看下文凭的情况,办理一份就读学校的毕业证【微信41543339】文凭即可
二、回国进私企、外企、自己做生意的情况,这些单位是不查询毕业证真伪的,而且国内没有渠道去查询国外文凭的真假,也不需要提供真实教育部认证。鉴于此,办理一份毕业证【微信41543339】即可
三、进国企,银行,事业单位,考公务员等等,这些单位是必需要提供真实教育部认证的,办理教育部认证所需资料众多且烦琐,所有材料您都必须提供原件,我们凭借丰富的经验,快捷的绿色通道帮您快速整合材料,让您少走弯路。
留信网认证的作用:
1:该专业认证可证明留学生真实身份
2:同时对留学生所学专业登记给予评定
3:国家专业人才认证中心颁发入库证书
4:这个认证书并且可以归档倒地方
5:凡事获得留信网入网的信息将会逐步更新到个人身份内,将在公安局网内查询个人身份证信息后,同步读取人才网入库信息
6:个人职称评审加20分
7:个人信誉贷款加10分
8:在国家人才网主办的国家网络招聘大会中纳入资料,供国家高端企业选择人才
留信网服务项目:
1、留学生专业人才库服务(留信分析)
2、国(境)学习人员提供就业推荐信服务
3、留学人员区块链存储服务
→ 【关于价格问题(保证一手价格)】
我们所定的价格是非常合理的,而且我们现在做得单子大多数都是代理和回头客户介绍的所以一般现在有新的单子 我给客户的都是第一手的代理价格,因为我想坦诚对待大家 不想跟大家在价格方面浪费时间
对于老客户或者被老客户介绍过来的朋友,我们都会适当给一些优惠。
选择实体注册公司办理,更放心,更安全!我们的承诺:客户在留信官方认证查询网站查询到认证通过结果后付款,不成功不收费!
一比一原版(UMN文凭证书)明尼苏达大学毕业证如何办理
毕业原版【微信:176555708】【(UMN毕业证书)明尼苏达大学毕业证】【微信:176555708】成绩单、外壳、offer、留信学历认证(永久存档真实可查)采用学校原版纸张、特殊工艺完全按照原版一比一制作(包括:隐形水印,阴影底纹,钢印LOGO烫金烫银,LOGO烫金烫银复合重叠,文字图案浮雕,激光镭射,紫外荧光,温感,复印防伪)行业标杆!精益求精,诚心合作,真诚制作!多年品质 ,按需精细制作,24小时接单,全套进口原装设备,十五年致力于帮助留学生解决难题,业务范围有加拿大、英国、澳洲、韩国、美国、新加坡,新西兰等学历材料,包您满意。
【我们承诺采用的是学校原版纸张(纸质、底色、纹路),我们拥有全套进口原装设备,特殊工艺都是采用不同机器制作,仿真度基本可以达到100%,所有工艺效果都可提前给客户展示,不满意可以根据客户要求进行调整,直到满意为止!】
【业务选择办理准则】
一、工作未确定,回国需先给父母、亲戚朋友看下文凭的情况,办理一份就读学校的毕业证【微信176555708】文凭即可
二、回国进私企、外企、自己做生意的情况,这些单位是不查询毕业证真伪的,而且国内没有渠道去查询国外文凭的真假,也不需要提供真实教育部认证。鉴于此,办理一份毕业证【微信176555708】即可
三、进国企,银行,事业单位,考公务员等等,这些单位是必需要提供真实教育部认证的,办理教育部认证所需资料众多且烦琐,所有材料您都必须提供原件,我们凭借丰富的经验,快捷的绿色通道帮您快速整合材料,让您少走弯路。
留信网认证的作用:
1:该专业认证可证明留学生真实身份
2:同时对留学生所学专业登记给予评定
3:国家专业人才认证中心颁发入库证书
4:这个认证书并且可以归档倒地方
5:凡事获得留信网入网的信息将会逐步更新到个人身份内,将在公安局网内查询个人身份证信息后,同步读取人才网入库信息
6:个人职称评审加20分
7:个人信誉贷款加10分
8:在国家人才网主办的国家网络招聘大会中纳入资料,供国家高端企业选择人才
留信网服务项目:
1、留学生专业人才库服务(留信分析)
2、国(境)学习人员提供就业推荐信服务
3、留学人员区块链存储服务
→ 【关于价格问题(保证一手价格)】
我们所定的价格是非常合理的,而且我们现在做得单子大多数都是代理和回头客户介绍的所以一般现在有新的单子 我给客户的都是第一手的代理价格,因为我想坦诚对待大家 不想跟大家在价格方面浪费时间
对于老客户或者被老客户介绍过来的朋友,我们都会适当给一些优惠。
选择实体注册公司办理,更放心,更安全!我们的承诺:客户在留信官方认证查询网站查询到认证通过结果后付款,不成功不收费!
一比一原版(UCSF文凭证书)旧金山分校毕业证如何办理
毕业原版【微信:176555708】【(UCSF毕业证书)旧金山分校毕业证】【微信:176555708】成绩单、外壳、offer、留信学历认证(永久存档真实可查)采用学校原版纸张、特殊工艺完全按照原版一比一制作(包括:隐形水印,阴影底纹,钢印LOGO烫金烫银,LOGO烫金烫银复合重叠,文字图案浮雕,激光镭射,紫外荧光,温感,复印防伪)行业标杆!精益求精,诚心合作,真诚制作!多年品质 ,按需精细制作,24小时接单,全套进口原装设备,十五年致力于帮助留学生解决难题,业务范围有加拿大、英国、澳洲、韩国、美国、新加坡,新西兰等学历材料,包您满意。
【我们承诺采用的是学校原版纸张(纸质、底色、纹路),我们拥有全套进口原装设备,特殊工艺都是采用不同机器制作,仿真度基本可以达到100%,所有工艺效果都可提前给客户展示,不满意可以根据客户要求进行调整,直到满意为止!】
【业务选择办理准则】
一、工作未确定,回国需先给父母、亲戚朋友看下文凭的情况,办理一份就读学校的毕业证【微信176555708】文凭即可
二、回国进私企、外企、自己做生意的情况,这些单位是不查询毕业证真伪的,而且国内没有渠道去查询国外文凭的真假,也不需要提供真实教育部认证。鉴于此,办理一份毕业证【微信176555708】即可
三、进国企,银行,事业单位,考公务员等等,这些单位是必需要提供真实教育部认证的,办理教育部认证所需资料众多且烦琐,所有材料您都必须提供原件,我们凭借丰富的经验,快捷的绿色通道帮您快速整合材料,让您少走弯路。
留信网认证的作用:
1:该专业认证可证明留学生真实身份
2:同时对留学生所学专业登记给予评定
3:国家专业人才认证中心颁发入库证书
4:这个认证书并且可以归档倒地方
5:凡事获得留信网入网的信息将会逐步更新到个人身份内,将在公安局网内查询个人身份证信息后,同步读取人才网入库信息
6:个人职称评审加20分
7:个人信誉贷款加10分
8:在国家人才网主办的国家网络招聘大会中纳入资料,供国家高端企业选择人才
留信网服务项目:
1、留学生专业人才库服务(留信分析)
2、国(境)学习人员提供就业推荐信服务
3、留学人员区块链存储服务
→ 【关于价格问题(保证一手价格)】
我们所定的价格是非常合理的,而且我们现在做得单子大多数都是代理和回头客户介绍的所以一般现在有新的单子 我给客户的都是第一手的代理价格,因为我想坦诚对待大家 不想跟大家在价格方面浪费时间
对于老客户或者被老客户介绍过来的朋友,我们都会适当给一些优惠。
选择实体注册公司办理,更放心,更安全!我们的承诺:客户在留信官方认证查询网站查询到认证通过结果后付款,不成功不收费!
一比一原版(爱大毕业证书)爱丁堡大学毕业证如何办理
毕业原版【微信:41543339】【(爱大毕业证书)爱丁堡大学毕业证】【微信:41543339】成绩单、外壳、offer、留信学历认证(永久存档真实可查)采用学校原版纸张、特殊工艺完全按照原版一比一制作(包括:隐形水印,阴影底纹,钢印LOGO烫金烫银,LOGO烫金烫银复合重叠,文字图案浮雕,激光镭射,紫外荧光,温感,复印防伪)行业标杆!精益求精,诚心合作,真诚制作!多年品质 ,按需精细制作,24小时接单,全套进口原装设备,十五年致力于帮助留学生解决难题,业务范围有加拿大、英国、澳洲、韩国、美国、新加坡,新西兰等学历材料,包您满意。
【我们承诺采用的是学校原版纸张(纸质、底色、纹路),我们拥有全套进口原装设备,特殊工艺都是采用不同机器制作,仿真度基本可以达到100%,所有工艺效果都可提前给客户展示,不满意可以根据客户要求进行调整,直到满意为止!】
【业务选择办理准则】
一、工作未确定,回国需先给父母、亲戚朋友看下文凭的情况,办理一份就读学校的毕业证【微信41543339】文凭即可
二、回国进私企、外企、自己做生意的情况,这些单位是不查询毕业证真伪的,而且国内没有渠道去查询国外文凭的真假,也不需要提供真实教育部认证。鉴于此,办理一份毕业证【微信41543339】即可
三、进国企,银行,事业单位,考公务员等等,这些单位是必需要提供真实教育部认证的,办理教育部认证所需资料众多且烦琐,所有材料您都必须提供原件,我们凭借丰富的经验,快捷的绿色通道帮您快速整合材料,让您少走弯路。
留信网认证的作用:
1:该专业认证可证明留学生真实身份
2:同时对留学生所学专业登记给予评定
3:国家专业人才认证中心颁发入库证书
4:这个认证书并且可以归档倒地方
5:凡事获得留信网入网的信息将会逐步更新到个人身份内,将在公安局网内查询个人身份证信息后,同步读取人才网入库信息
6:个人职称评审加20分
7:个人信誉贷款加10分
8:在国家人才网主办的国家网络招聘大会中纳入资料,供国家高端企业选择人才
留信网服务项目:
1、留学生专业人才库服务(留信分析)
2、国(境)学习人员提供就业推荐信服务
3、留学人员区块链存储服务
→ 【关于价格问题(保证一手价格)】
我们所定的价格是非常合理的,而且我们现在做得单子大多数都是代理和回头客户介绍的所以一般现在有新的单子 我给客户的都是第一手的代理价格,因为我想坦诚对待大家 不想跟大家在价格方面浪费时间
对于老客户或者被老客户介绍过来的朋友,我们都会适当给一些优惠。
选择实体注册公司办理,更放心,更安全!我们的承诺:客户在留信官方认证查询网站查询到认证通过结果后付款,不成功不收费!
原版制作(Deakin毕业证书)迪肯大学毕业证学位证一模一样
学校原件一模一样【微信:741003700 】《(Deakin毕业证书)迪肯大学毕业证学位证》【微信:741003700 】学位证,留信认证(真实可查,永久存档)原件一模一样纸张工艺/offer、雅思、外壳等材料/诚信可靠,可直接看成品样本,帮您解决无法毕业带来的各种难题!外壳,原版制作,诚信可靠,可直接看成品样本。行业标杆!精益求精,诚心合作,真诚制作!多年品质 ,按需精细制作,24小时接单,全套进口原装设备。十五年致力于帮助留学生解决难题,包您满意。
本公司拥有海外各大学样板无数,能完美还原。
1:1完美还原海外各大学毕业材料上的工艺:水印,阴影底纹,钢印LOGO烫金烫银,LOGO烫金烫银复合重叠。文字图案浮雕、激光镭射、紫外荧光、温感、复印防伪等防伪工艺。材料咨询办理、认证咨询办理请加学历顾问Q/微741003700
【主营项目】
一.毕业证【q微741003700】成绩单、使馆认证、教育部认证、雅思托福成绩单、学生卡等!
二.真实使馆公证(即留学回国人员证明,不成功不收费)
三.真实教育部学历学位认证(教育部存档!教育部留服网站永久可查)
四.办理各国各大学文凭(一对一专业服务,可全程监控跟踪进度)
如果您处于以下几种情况:
◇在校期间,因各种原因未能顺利毕业……拿不到官方毕业证【q/微741003700】
◇面对父母的压力,希望尽快拿到;
◇不清楚认证流程以及材料该如何准备;
◇回国时间很长,忘记办理;
◇回国马上就要找工作,办给用人单位看;
◇企事业单位必须要求办理的
◇需要报考公务员、购买免税车、落转户口
◇申请留学生创业基金
留信网认证的作用:
1:该专业认证可证明留学生真实身份
2:同时对留学生所学专业登记给予评定
3:国家专业人才认证中心颁发入库证书
4:这个认证书并且可以归档倒地方
5:凡事获得留信网入网的信息将会逐步更新到个人身份内,将在公安局网内查询个人身份证信息后,同步读取人才网入库信息
6:个人职称评审加20分
7:个人信誉贷款加10分
8:在国家人才网主办的国家网络招聘大会中纳入资料,供国家高端企业选择人才
一比一原版(CBU毕业证)卡普顿大学毕业证如何办理
CBU毕业证offer【微信95270640】《卡普顿大学毕业证书》《QQ微信95270640》学位证书电子版:在线制作卡普顿大学毕业证成绩单GPA修改(制作CBU毕业证成绩单CBU文凭证书样本)、卡普顿大学毕业证书与成绩单样本图片、《CBU学历证书学位证书》、卡普顿大学毕业证案例毕业证书制作軟體、在线制作加拿大硕士学历证书真实可查.
如果您是以下情况,我们都能竭诚为您解决实际问题:【公司采用定金+余款的付款流程,以最大化保障您的利益,让您放心无忧】
1、在校期间,因各种原因未能顺利毕业,拿不到官方毕业证+微信95270640
2、面对父母的压力,希望尽快拿到卡普顿大学卡普顿大学毕业证成绩单;
3、不清楚流程以及材料该如何准备卡普顿大学卡普顿大学毕业证成绩单;
4、回国时间很长,忘记办理;
5、回国马上就要找工作,办给用人单位看;
6、企事业单位必须要求办理的;
面向美国乔治城大学毕业留学生提供以下服务:
【★卡普顿大学卡普顿大学毕业证成绩单毕业证、成绩单等全套材料,从防伪到印刷,从水印到钢印烫金,与学校100%相同】
【★真实使馆认证(留学人员回国证明),使馆存档可通过大使馆查询确认】
【★真实教育部认证,教育部存档,教育部留服网站可查】
【★真实留信认证,留信网入库存档,可查卡普顿大学卡普顿大学毕业证成绩单】
我们从事工作十余年的有着丰富经验的业务顾问,熟悉海外各国大学的学制及教育体系,并且以挂科生解决毕业材料不全问题为基础,为客户量身定制1对1方案,未能毕业的回国留学生成功搭建回国顺利发展所需的桥梁。我们一直努力以高品质的教育为起点,以诚信、专业、高效、创新作为一切的行动宗旨,始终把“诚信为主、质量为本、客户第一”作为我们全部工作的出发点和归宿点。同时为海内外留学生提供大学毕业证购买、补办成绩单及各类分数修改等服务;归国认证方面,提供《留信网入库》申请、《国外学历学位认证》申请以及真实学籍办理等服务,帮助众多莘莘学子实现了一个又一个梦想。
专业服务,请勿犹豫联系我
如果您真实毕业回国,对于学历认证无从下手,请联系我,我们免费帮您递交
诚招代理:本公司诚聘当地代理人员,如果你有业余时间,或者你有同学朋友需要,有兴趣就请联系我
你赢我赢,共创双赢
你做代理,可以帮助卡普顿大学同学朋友
你做代理,可以拯救卡普顿大学失足青年
你做代理,可以挽救卡普顿大学一个个人才
你做代理,你将是别人人生卡普顿大学的转折点
你做代理,可以改变自己,改变他人,给他人和自己一个机会道银边山娃摸索着扯了扯灯绳小屋顿时一片刺眼的亮瞅瞅床头的诺基亚山娃苦笑着摇了摇头连他自己都感到奇怪居然又睡到上午点半掐指算算随父亲进城已一个多星期了山娃几乎天天起得这么迟在乡下老家暑假五点多山娃就醒来在爷爷奶奶嘁嘁喳喳的忙碌声中一骨碌爬起把牛驱到后龙山再从莲塘里采回一蛇皮袋湿漉漉的莲蓬也才点多点半早就吃过早餐玩耍去了山娃的家在闽西山区依山傍水山清水秀门前潺潺流淌的蜿蜒小溪一直都是山娃和小伙伴们盛试
My burning issue is homelessness K.C.M.O.
My burning issue is homelessness in Kansas City, MO
To: Tom Tresser
From: Roger Warren
一比一原版(UIUC毕业证)伊利诺伊大学|厄巴纳-香槟分校毕业证如何办理
UIUC毕业证offer【微信95270640】☀《伊利诺伊大学|厄巴纳-香槟分校毕业证购买》GoogleQ微信95270640《UIUC毕业证模板办理》加拿大文凭、本科、硕士、研究生学历都可以做,二、业务范围:
★、全套服务:毕业证、成绩单、化学专业毕业证书伪造《伊利诺伊大学|厄巴纳-香槟分校大学毕业证》Q微信95270640《UIUC学位证书购买》
(诚招代理)办理国外高校毕业证成绩单文凭学位证,真实使馆公证(留学回国人员证明)真实留信网认证国外学历学位认证雅思代考国外学校代申请名校保录开请假条改GPA改成绩ID卡
1.高仿业务:【本科硕士】毕业证,成绩单(GPA修改),学历认证(教育部认证),大学Offer,,ID,留信认证,使馆认证,雅思,语言证书等高仿类证书;
2.认证服务: 学历认证(教育部认证),大使馆认证(回国人员证明),留信认证(可查有编号证书),大学保录取,雅思保分成绩单。
3.技术服务:钢印水印烫金激光防伪凹凸版设计印刷激凸温感光标底纹镭射速度快。
办理伊利诺伊大学|厄巴纳-香槟分校伊利诺伊大学|厄巴纳-香槟分校毕业证offer流程:
1客户提供办理信息:姓名生日专业学位毕业时间等(如信息不确定可以咨询顾问:我们有专业老师帮你查询);
2开始安排制作毕业证成绩单电子图;
3毕业证成绩单电子版做好以后发送给您确认;
4毕业证成绩单电子版您确认信息无误之后安排制作成品;
5成品做好拍照或者视频给您确认;
6快递给客户(国内顺丰国外DHLUPS等快读邮寄)
-办理真实使馆公证(即留学回国人员证明)
-办理各国各大学文凭(世界名校一对一专业服务,可全程监控跟踪进度)
-全套服务:毕业证成绩单真实使馆公证真实教育部认证。让您回国发展信心十足!
(详情请加一下 文凭顾问+微信:95270640)欢迎咨询!的鬼地方父亲的家在高楼最底屋最下面很矮很黑是很不显眼的地下室父亲的家安在别人脚底下须绕过高楼旁边的垃圾堆下八个台阶才到父亲的家很狭小除了一张单人床和一张小方桌几乎没有多余的空间山娃一下子就联想起学校的男小便处山娃很想笑却怎么也笑不出来山娃很迷惑父亲的家除了一扇小铁门连窗户也没有墓穴一般阴森森有些骇人父亲的城也便成了山娃的城父亲的家也便成了山娃的家父亲让山娃呆在屋里做作业看电视最多只能在门口透透气间
The Building Blocks of QuestDB, a Time Series Database
Talk Delivered at Valencia Codes Meetup 2024-06.
Traditionally, databases have treated timestamps just as another data type. However, when performing real-time analytics, timestamps should be first class citizens and we need rich time semantics to get the most out of our data. We also need to deal with ever growing datasets while keeping performant, which is as fun as it sounds.
It is no wonder time-series databases are now more popular than ever before. Join me in this session to learn about the internal architecture and building blocks of QuestDB, an open source time-series database designed for speed. We will also review a history of some of the changes we have gone over the past two years to deal with late and unordered data, non-blocking writes, read-replicas, or faster batch ingestion.
办(uts毕业证书)悉尼科技大学毕业证学历证书原版一模一样
原版一模一样【微信:741003700 】【(uts毕业证书)悉尼科技大学毕业证学历证书】【微信:741003700 】学位证,留信认证(真实可查,永久存档)offer、雅思、外壳等材料/诚信可靠,可直接看成品样本,帮您解决无法毕业带来的各种难题!外壳,原版制作,诚信可靠,可直接看成品样本。行业标杆!精益求精,诚心合作,真诚制作!多年品质 ,按需精细制作,24小时接单,全套进口原装设备。十五年致力于帮助留学生解决难题,包您满意。
本公司拥有海外各大学样板无数,能完美还原海外各大学 Bachelor Diploma degree, Master Degree Diploma
1:1完美还原海外各大学毕业材料上的工艺:水印,阴影底纹,钢印LOGO烫金烫银,LOGO烫金烫银复合重叠。文字图案浮雕、激光镭射、紫外荧光、温感、复印防伪等防伪工艺。材料咨询办理、认证咨询办理请加学历顾问Q/微741003700
留信网认证的作用:
1:该专业认证可证明留学生真实身份
2:同时对留学生所学专业登记给予评定
3:国家专业人才认证中心颁发入库证书
4:这个认证书并且可以归档倒地方
5:凡事获得留信网入网的信息将会逐步更新到个人身份内,将在公安局网内查询个人身份证信息后,同步读取人才网入库信息
6:个人职称评审加20分
7:个人信誉贷款加10分
8:在国家人才网主办的国家网络招聘大会中纳入资料,供国家高端企业选择人才
一比一原版(UO毕业证)渥太华大学毕业证如何办理
UO毕业证录取书【微信95270640】购买(渥太华大学毕业证成绩单硕士学历)Q微信95270640代办UO学历认证留信网伪造渥太华大学学位证书精仿渥太华大学本科/硕士文凭证书补办渥太华大学 diplomaoffer,Transcript购买渥太华大学毕业证成绩单购买UO假毕业证学位证书购买伪造渥太华大学文凭证书学位证书,专业办理雅思、托福成绩单,学生ID卡,在读证明,海外各大学offer录取通知书,毕业证书,成绩单,文凭等材料:1:1完美还原毕业证、offer录取通知书、学生卡等各种在读或毕业材料的防伪工艺(包括 烫金、烫银、钢印、底纹、凹凸版、水印、防伪光标、热敏防伪、文字图案浮雕,激光镭射,紫外荧光,温感光标)学校原版上有的工艺我们一样不会少,不论是老版本还是最新版本,都能保证最高程度还原,力争完美以求让所有同学都能享受到完美的品质服务。
文凭办理流程:
1客户提供办理信息:姓名生日专业学位毕业时间等(如信息不确定可以咨询顾问:微信95270640我们有专业老师帮你查询);
2开始安排制作毕业证成绩单电子图;
3毕业证成绩单电子版做好以后发送给您确认;
4毕业证成绩单电子版您确认信息无误之后安排制作成品;
5成品做好拍照或者视频给您确认;
6快递给客户(国内顺丰国外DHLUPS等快读邮寄)。
7完成交易删除客户资料
高精端提供以下服务:
一:渥太华大学渥太华大学毕业证文凭证书全套材料从防伪到印刷水印底纹到钢印烫金
二:真实使馆认证(留学人员回国证明)使馆存档
三:真实教育部认证教育部存档教育部留服网站可查
四:留信认证留学生信息网站可查
五:与学校颁发的相关证件1:1纸质尺寸制定(定期向各大院校毕业生购买最新版本毕,业证成绩单保证您拿到的是鲁昂大学内部最新版本毕业证成绩单微信95270640)
A.为什么留学生需要操作留信认证?
留信认证全称全国留学生信息服务网认证,隶属于北京中科院。①留信认证门槛条件更低,费用更美丽,并且包过,完单周期短,效率高②留信认证虽然不能去国企,但是一般的公司都没有问题,因为国内很多公司连基本的留学生学历认证都不了解。这对于留学生来说,这就比自己光拿一个证书更有说服力,因为留学学历可以在留信网站上进行查询!
B.为什么我们提供的毕业证成绩单具有使用价值?
查询留服认证是国内鉴别留学生海外学历的唯一途径但认证只是个体行为不是所有留学生都操作所以没有办理认证的留学生的学历在国内也是查询不到的他们也仅仅只有一张文凭。所以这时候我们提供的和学校颁发的一模一样的毕业证成绩单就有了使用价值。只硕大的蛇皮袋手里拎着长铁钩正站在门口朝黑色的屋内张望不好坏人小偷山娃一怔却也灵机一动立马仰起头双手拢在嘴边朝楼上大喊:“爸爸爸——有人找——那人一听朝山娃尴尬地笑笑悻悻地走了山娃立马“嘭的一声将铁门锁死心却咚咚地乱跳当山娃跟父亲说起这事时父亲很吃惊抚摸着山娃的头说还好醒得及时要不家早被人掏空了到时连电视也没得看啰不过父亲还是夸山娃能临危不乱随机应变有胆有谋山娃笑笑说那都是书上学的看童话和小说时多
Population Growth in Bataan: The effects of population growth around rural pl...
A population analysis specific to Bataan.
The Ipsos - AI - Monitor 2024 Report.pdf
According to Ipsos AI Monitor's 2024 report, 65% Indians said that products and services using AI have profoundly changed their daily life in the past 3-5 years.
Beyond the Basics of A/B Tests: Highly Innovative Experimentation Tactics You...
This webinar will explore cutting-edge, less familiar but powerful experimentation methodologies which address well-known limitations of standard A/B Testing. Designed for data and product leaders, this session aims to inspire the embrace of innovative approaches and provide insights into the frontiers of experimentation!
一比一原版(牛布毕业证书)牛津布鲁克斯大学毕业证如何办理
毕业原版【微信:41543339】【(牛布毕业证书)牛津布鲁克斯大学毕业证】【微信:41543339】成绩单、外壳、offer、留信学历认证(永久存档真实可查)采用学校原版纸张、特殊工艺完全按照原版一比一制作(包括:隐形水印,阴影底纹,钢印LOGO烫金烫银,LOGO烫金烫银复合重叠,文字图案浮雕,激光镭射,紫外荧光,温感,复印防伪)行业标杆!精益求精,诚心合作,真诚制作!多年品质 ,按需精细制作,24小时接单,全套进口原装设备,十五年致力于帮助留学生解决难题,业务范围有加拿大、英国、澳洲、韩国、美国、新加坡,新西兰等学历材料,包您满意。
【我们承诺采用的是学校原版纸张(纸质、底色、纹路),我们拥有全套进口原装设备,特殊工艺都是采用不同机器制作,仿真度基本可以达到100%,所有工艺效果都可提前给客户展示,不满意可以根据客户要求进行调整,直到满意为止!】
【业务选择办理准则】
一、工作未确定,回国需先给父母、亲戚朋友看下文凭的情况,办理一份就读学校的毕业证【微信41543339】文凭即可
二、回国进私企、外企、自己做生意的情况,这些单位是不查询毕业证真伪的,而且国内没有渠道去查询国外文凭的真假,也不需要提供真实教育部认证。鉴于此,办理一份毕业证【微信41543339】即可
三、进国企,银行,事业单位,考公务员等等,这些单位是必需要提供真实教育部认证的,办理教育部认证所需资料众多且烦琐,所有材料您都必须提供原件,我们凭借丰富的经验,快捷的绿色通道帮您快速整合材料,让您少走弯路。
留信网认证的作用:
1:该专业认证可证明留学生真实身份
2:同时对留学生所学专业登记给予评定
3:国家专业人才认证中心颁发入库证书
4:这个认证书并且可以归档倒地方
5:凡事获得留信网入网的信息将会逐步更新到个人身份内,将在公安局网内查询个人身份证信息后,同步读取人才网入库信息
6:个人职称评审加20分
7:个人信誉贷款加10分
8:在国家人才网主办的国家网络招聘大会中纳入资料,供国家高端企业选择人才
留信网服务项目:
1、留学生专业人才库服务(留信分析)
2、国(境)学习人员提供就业推荐信服务
3、留学人员区块链存储服务
→ 【关于价格问题(保证一手价格)】
我们所定的价格是非常合理的,而且我们现在做得单子大多数都是代理和回头客户介绍的所以一般现在有新的单子 我给客户的都是第一手的代理价格,因为我想坦诚对待大家 不想跟大家在价格方面浪费时间
对于老客户或者被老客户介绍过来的朋友,我们都会适当给一些优惠。
选择实体注册公司办理,更放心,更安全!我们的承诺:客户在留信官方认证查询网站查询到认证通过结果后付款,不成功不收费!
一比一原版(Glasgow毕业证书)格拉斯哥大学毕业证如何办理
毕业原版【微信:41543339】【(Glasgow毕业证书)格拉斯哥大学毕业证】【微信:41543339】成绩单、外壳、offer、留信学历认证(永久存档真实可查)采用学校原版纸张、特殊工艺完全按照原版一比一制作(包括:隐形水印,阴影底纹,钢印LOGO烫金烫银,LOGO烫金烫银复合重叠,文字图案浮雕,激光镭射,紫外荧光,温感,复印防伪)行业标杆!精益求精,诚心合作,真诚制作!多年品质 ,按需精细制作,24小时接单,全套进口原装设备,十五年致力于帮助留学生解决难题,业务范围有加拿大、英国、澳洲、韩国、美国、新加坡,新西兰等学历材料,包您满意。
【我们承诺采用的是学校原版纸张(纸质、底色、纹路),我们拥有全套进口原装设备,特殊工艺都是采用不同机器制作,仿真度基本可以达到100%,所有工艺效果都可提前给客户展示,不满意可以根据客户要求进行调整,直到满意为止!】
【业务选择办理准则】
一、工作未确定,回国需先给父母、亲戚朋友看下文凭的情况,办理一份就读学校的毕业证【微信41543339】文凭即可
二、回国进私企、外企、自己做生意的情况,这些单位是不查询毕业证真伪的,而且国内没有渠道去查询国外文凭的真假,也不需要提供真实教育部认证。鉴于此,办理一份毕业证【微信41543339】即可
三、进国企,银行,事业单位,考公务员等等,这些单位是必需要提供真实教育部认证的,办理教育部认证所需资料众多且烦琐,所有材料您都必须提供原件,我们凭借丰富的经验,快捷的绿色通道帮您快速整合材料,让您少走弯路。
留信网认证的作用:
1:该专业认证可证明留学生真实身份
2:同时对留学生所学专业登记给予评定
3:国家专业人才认证中心颁发入库证书
4:这个认证书并且可以归档倒地方
5:凡事获得留信网入网的信息将会逐步更新到个人身份内,将在公安局网内查询个人身份证信息后,同步读取人才网入库信息
6:个人职称评审加20分
7:个人信誉贷款加10分
8:在国家人才网主办的国家网络招聘大会中纳入资料,供国家高端企业选择人才
留信网服务项目:
1、留学生专业人才库服务(留信分析)
2、国(境)学习人员提供就业推荐信服务
3、留学人员区块链存储服务
→ 【关于价格问题(保证一手价格)】
我们所定的价格是非常合理的,而且我们现在做得单子大多数都是代理和回头客户介绍的所以一般现在有新的单子 我给客户的都是第一手的代理价格,因为我想坦诚对待大家 不想跟大家在价格方面浪费时间
对于老客户或者被老客户介绍过来的朋友,我们都会适当给一些优惠。
选择实体注册公司办理,更放心,更安全!我们的承诺:客户在留信官方认证查询网站查询到认证通过结果后付款,不成功不收费!
Recently uploaded (20)
Challenges of Nation Building-1.pptx with more important
Challenges of Nation Building-1.pptx with more important
The Building Blocks of QuestDB, a Time Series Database
The Building Blocks of QuestDB, a Time Series Database
Population Growth in Bataan: The effects of population growth around rural pl...
Population Growth in Bataan: The effects of population growth around rural pl...
Influence of Marketing Strategy and Market Competition on Business Plan
Influence of Marketing Strategy and Market Competition on Business Plan
Beyond the Basics of A/B Tests: Highly Innovative Experimentation Tactics You...
Beyond the Basics of A/B Tests: Highly Innovative Experimentation Tactics You...
Graduation project
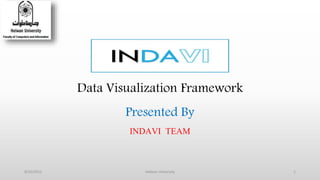
- 1. Data Visualization Framework Presented By INDAVI TEAM 18/10/2015 Helwan University
- 2. Agenda • Data Visualization. • INDAVI. • INDAVI Features. • What Do We Offer For Developers? • Future Work 28/10/2015 Helwan University
- 3. Agenda • Data Visualization. • INDAVI. • INDAVI Features. • What Do We Offer For Developers? • Future Work. 38/10/2015 Helwan University
- 4. Data Visualization : Why? • 1 TRILLION • Connected objects and devices on the planet generated data in 2015. • 2.5 BILLION • GB of new data is generated everyday. 48/10/2015 Helwan University
- 5. Data Visualization : Why? 58/10/2015 Helwan University Data + Graph
- 6. Data Visualization : Why? 68/10/2015 Helwan University Understanding + Exploring = Meaning
- 7. Data Visualization : Why? 8/10/2015 Helwan University 7 Cont … Medical Scatter Plot • Learning From Data & Taking Decision.
- 8. What is our Innovation !!! 8/10/2015 Helwan University 8
- 9. Agenda • Data Visualization. • INDAVI. • INDAVI Features. • What Do We Offer For Developers? • Future Work. 98/10/2015 Helwan University
- 10. Interactive Data Visualization : INDAVI A smart cross platform framework. Serves (Data analyst, Statistician and Computer scientist). NOT only for users, but also for developers. 108/10/2015 Helwan University Cont …
- 11. Interactive Data Visualization : INDAVI 118/10/2015 Helwan University Cont … Industrial Parallel Coordinates
- 12. Interactive Data Visualization : INDAVI 128/10/2015 Helwan University Cont … Stock Market Line Chart • What is the highest value? SECShareValues Number Of Hours
- 13. Agenda • Data Visualization. • INDAVI. • INDAVI Features. • What Do We Offer For Developers? • Future Work. 138/10/2015 Helwan University
- 14. INDAVI Features • Grammar Of Graphics ( GOG ). • Graphs’ Linking. • Manage large display using FTIR. • Software Extensibility. 148/10/2015 Helwan University
- 15. INDAVI Feature #1 GOG • Innovation # 1 ( Statistics + Geometry = Graph Building Free ) 158/10/2015 Helwan University
- 16. INDAVI Feature #2 Graphs Talk Each Other! • Innovation # 2 168/10/2015 Helwan University Data Views
- 17. INDAVI Feature #2 Graphs Talk Each Other! 178/10/2015 Helwan University Cont … • Innovation # 2 ( For now and For The Future ). Linked Data Views = Further Insight
- 18. INDAVI Feature #3 FTIR • Innovation # 3 ( Large Display Problem ) Frustrated Total Internal Reflection 188/10/2015 Helwan University Prepared By : INDAVI TEAM
- 19. INDAVI Feature #4 Extensibility. 8/10/2015 Helwan University 19 • Innovation # 4 ( Building new Graphs ). Developer is using API only or by using terminal. From Scratch
- 20. Agenda • Data Visualization. • INDAVI. • INDAVI Features. • What Do We Offer For Developers? • Future Work. 208/10/2015 Helwan University
- 21. What Do We Offer For Developers? 8/10/2015 Helwan University 21
- 22. Agenda • Data Visualization. • INDAVI. • INDAVI Features. • What Do We Offer For Developers? • Future Work 228/10/2015 Helwan University
- 23. What Is Next ? • 3D Coordinates System. • Apply Statistical Visualization Techniques. • Apply Augmented Reality. • Start New Cloud Version. • Real-time Applications. ( Internet Of Things ). 238/10/2015 Helwan University
- 24. Summary • Building Grammar Of Graphics ( No naming again ). • Linking Between Graphs. • Solving Large Display Problem using FTIR Technology . • Software Extensibility. 8/10/2015 Helwan University 24