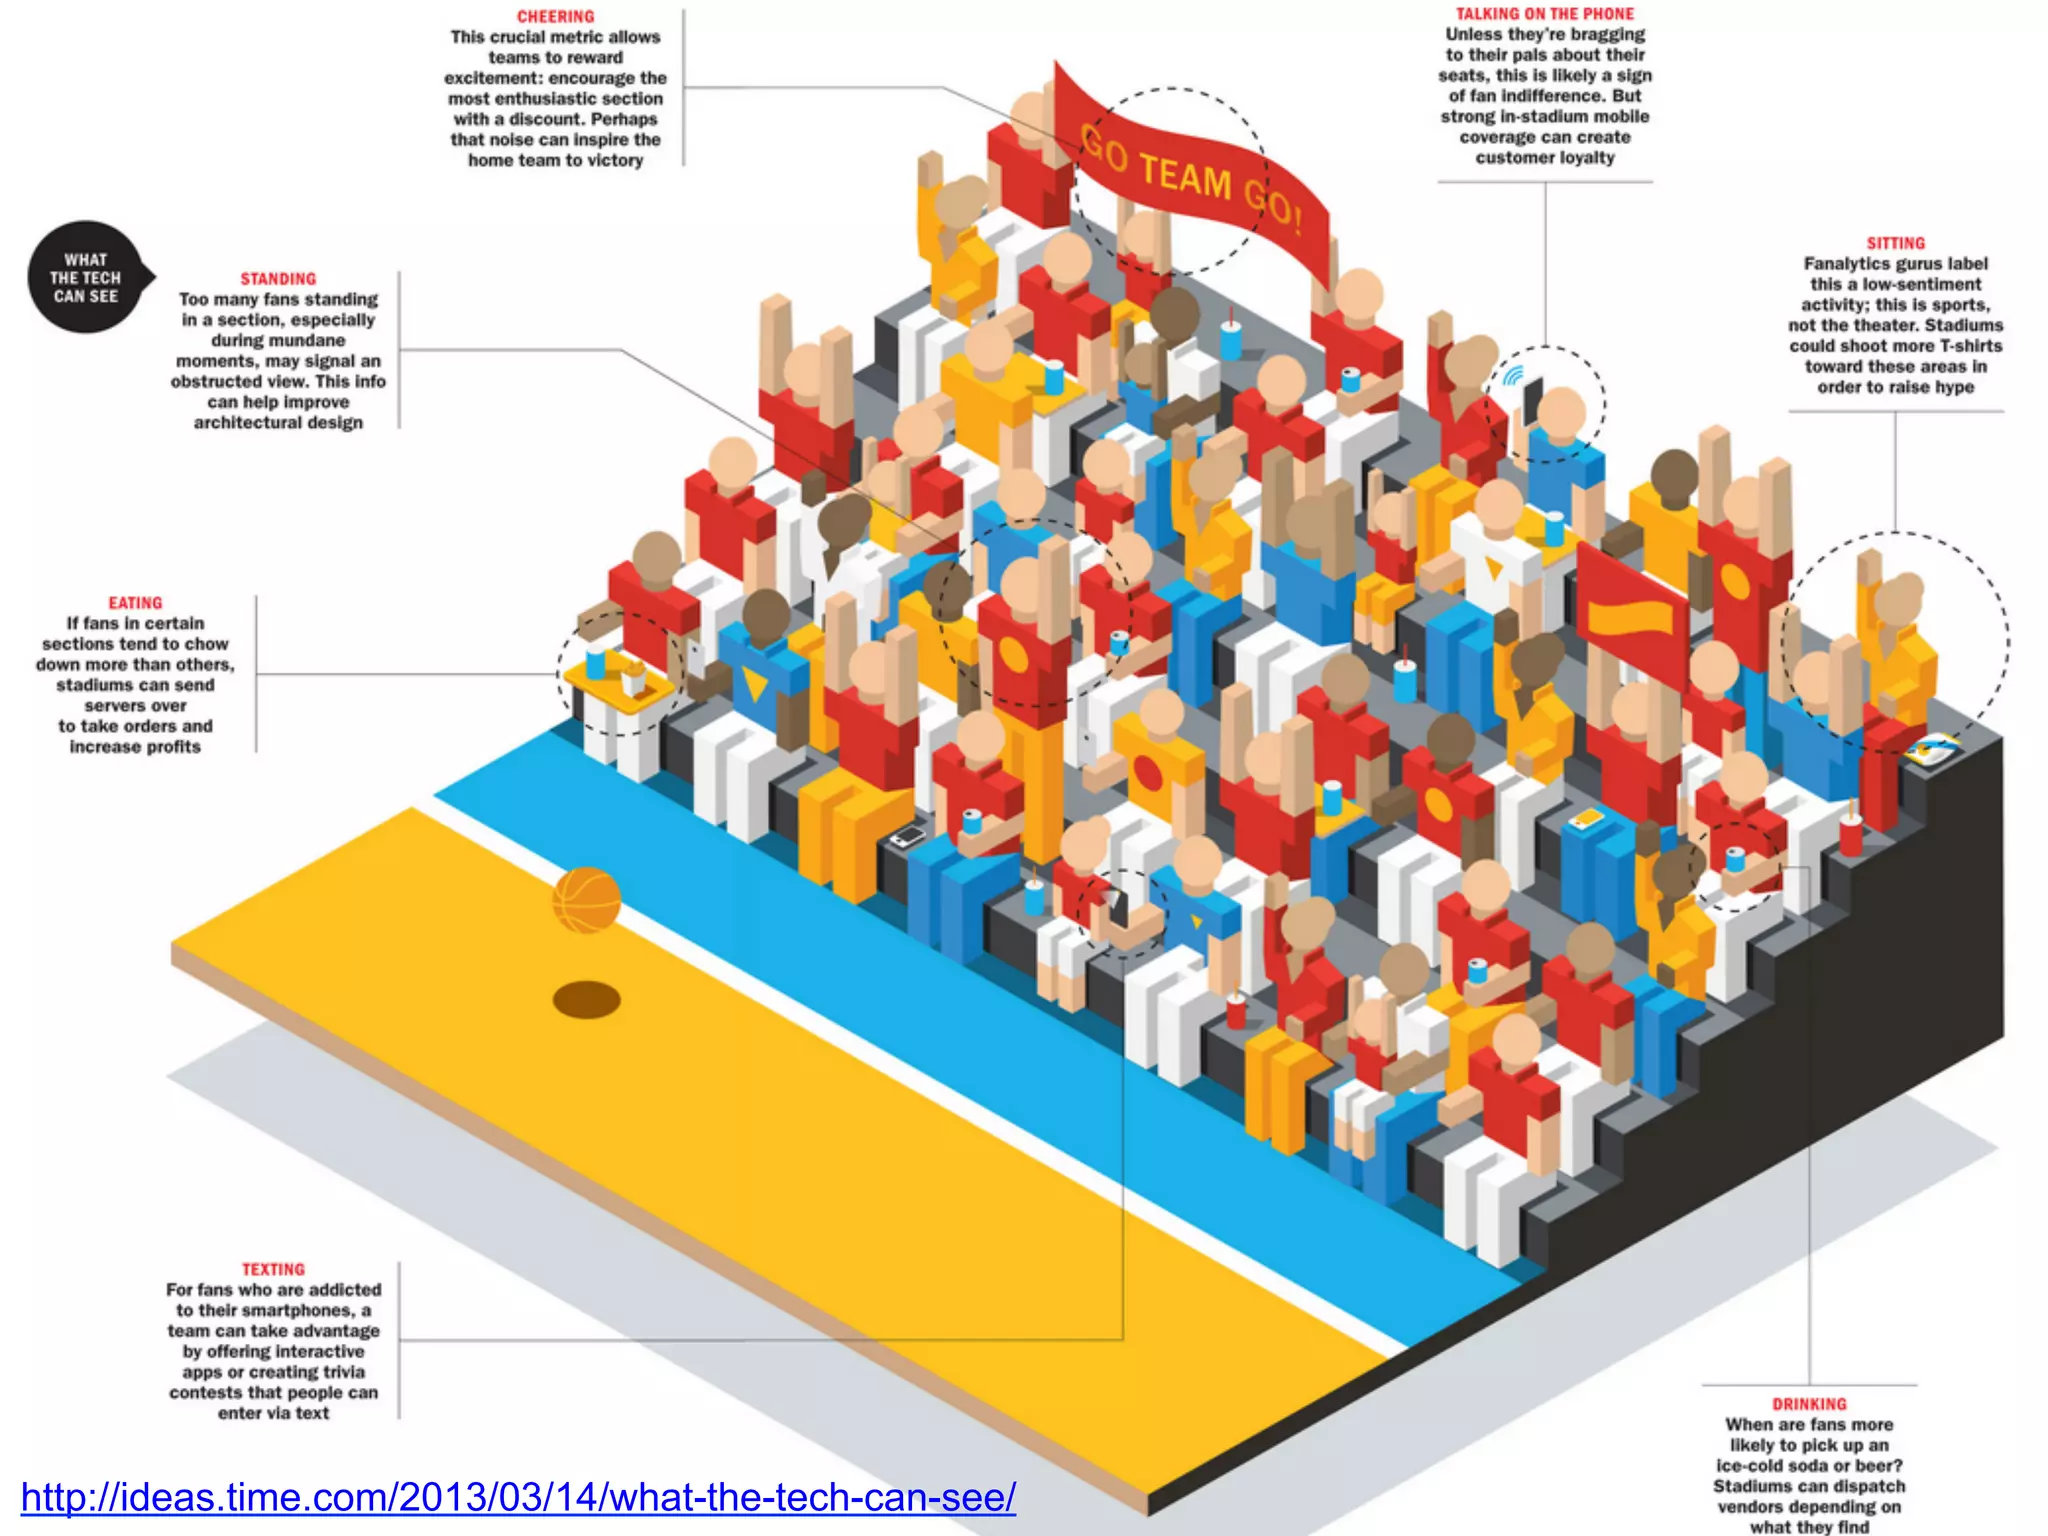
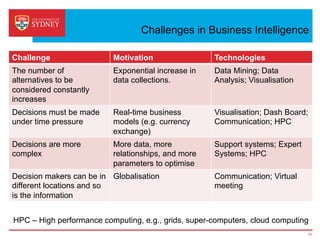
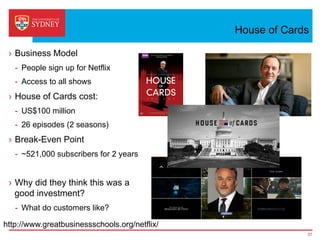
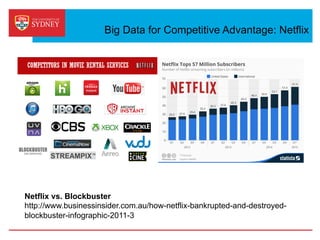
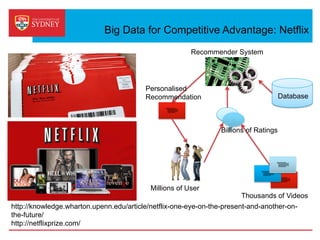
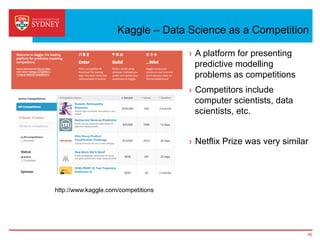
1http://ideas.time.com/2013/03/14/what-the-tech-can-see/
FACULTY OF
ENGINEERING &
INFORMATION
TECHNOLOGIES
Introduction to Information Systems
Week 7. Business Intelligence & Analytics and Decision Support Systems
COMP5206
Ashnil Kumar
Week 5 Outline
›  Lecture
-  Business Intelligence & Analytics and Decision Support Systems
-  Book chapters (5th Edi. Rainer, Prince and Cegielski):
-  Chapter 12. Business Analytics
›  Tutorial 3: Grand Challenges for Information Systems and Analytics
-  Pre-reading:
-  H. Chen et al., "Business Intelligence and Analytics: From Big Data to Big
Impact", MIS Quarterly 36(4):1165-1188.
-  Supplementary Readings
-  Discussion
3
Agenda
Week Topic Supplementary Activity
1. 5 Mar Introduction to ‘ Information Technologies and Systems’ and Course Overview
Organisational Strategy and Competitive Advantage
2. 12 Mar E-Business and E-Commerce
Electronic Payments
Tute 1. Internet-enabled Business models
3. 19 Mar Mobile Computing and Mobile Commerce Tute 2. System Thinking – Application to Online Education
4. 26 Mar Web Technologies; Social Computing
Telecommunications and Networking (Infrastructure)
Demo 1. Microsoft Excel Pivot Introduction
Lab 1. Market Data analysis with Pivot
5. 2 April Information Security; Ethics and Privacy in ITS
Course Review for the Quiz
Ass 1. (Research Report) – Intro / Topic Selection
Demo 2. Microsoft Excel Statistical Data Analysis
Lab 2. Microsoft Excel Statistical Data Analysis
Easter Vacation
6. 16 Apr Data and Knowledge Management Mid-semester Quiz
7. 23 Apr Business Intelligence / Analytics (Big Data)
Decision Support Systems (DSS)
Tute 3. Grand Challenges for Information Systems / Analytics
8. 30 Apr Acquiring Information Systems; System Development Life Cycle Ass 2. (Lab) – Intro
Demo 3. Microsoft Power Pivot Introduction
Lab 3. Microsoft Power Pivot Introduction
9. 7 May Information Systems within an Organisation
Customer Relationship Management (CRM)
Lab 4. All Labs (Cognos Insight as extra exercise for advanced students)
10. 14 May Enterprise Resource Planning (ERP)
Enterprise Content Management (ECM)
Ass 1. Presentations – Session 1
Ass 1. (Individual Research Report / Group Video) – Submission
11. 21 May Supply Chain Management (SCM) Ass 1. Presentations – Session 2
12. 28 May Information Technologies and Systems in a specialised Sector* Ass 1. Presentations – Session 3
Ass 2. Submission
13. 4 June Course Revision and Exam preparations Ass 1. Presentations – Session 4
UoS Outline
4
Apple ResearchKit
5
›  Open Source Software Framework
-  Collect data frequently
-  Share data
-  Create Apps
One Billion Mobile Users
6
http://recode.net/2014/03/26/the-other-facebook-news-one-billion-mobile-users/
›  Increasing use of mobile
devices is an
opportunity for:
-  Data collection
-  Analytics delivery
›  Personalization!
-  Based on analysis.
Funf Open Sensing Framework
›  A framework to integrate sensing data from your mobile phone and
converting it into meaningful data e.g., visualisation, notification, use in an
application, and reporting.
›  Data can be used to make decisions and assist in your activities
›  What is ‘meaningful data’?
-  Necessary to make informed choices, i.e., ‘intelligence’.
http://funf.org/about.html
Business Intelligence, Analytics and Decision
Support
Some Definitions
›  Business Intelligence
-  The set of methods and tools for transforming data into useful information for
business analysis purposes.
›  Analytics
-  The systematic computational analysis of data or statistics.
›  Decision Support Systems
-  A set of related computer programs and the data required to assist with analysis
and decision-making within an organization.
Customer Service
Public Relations
Marketing
Executive
“I want to respond to
what customers are
saying about our
product and resolve
their issues.”
“I want to measure
the effectiveness of
our campaigns and
promotions.”
“I want to measure
sentiment towards our
company among the
public and among
analysts.”
“I want to know
that my company
is respected and
our customers are
happy.”
Brand / Product Manager
“I need to know what
consumers like and dislike
about my competitors
products so I can make
ours better. ”
Why do we need Business Intelligence?
10
Challenges in Business Intelligence
11
Challenge Motivation Technologies
The number of
alternatives to be
considered constantly
increases
Exponential increase in
data collections.
Data Mining; Data
Analysis; Visualisation
Decisions must be made
under time pressure
Real-time business
models (e.g. currency
exchange)
Visualisation; Dash Board;
Communication; HPC
Decisions are more
complex
More data, more
relationships, and more
parameters to optimise
Support systems; Expert
Systems; HPC
Decision makers can be in
different locations and so
is the information
Globalisation Communication; Virtual
meeting
HPC – High performance computing, e.g., grids, super-computers, cloud computing
The Manager’s Job and Decision Making
›  The three basic roles of managers (Mintzberg 1973):
-  Interpersonal: figurehead, leader, liaison
-  Informational: monitor, disseminator, spokesperson
-  Decisional: disturbance handler, resource allocator, negotiator
›  Decision
-  A choice between two or more alternatives
-  Made by either an individual or a group
-  Decision making as a systematic process (Simon, 1977)
-  Intelligence gathering
-  Design
-  Choice
12
Decision Making Process
13
What is the problem?
What are my options?
Pick an option and
decide how to
implement it.
Did it work?
Types of Decision Making Problems
›  Fuzzy, complex problems for which there are no
tried-and-tested solutions.
14
Highly
structured
Semi-structured
Highly
unstructured
›  Routine and repetitive problems for which
standard solutions exist.
›  Problems in which only some of the decision
process phases are structured.
The Nature of Decisions
›  Different people make different kinds of decisions
›  Strategic planning
-  Decisions concerning long range goals, development of policies for growth, and
resource allocation.
›  Management control
-  Decisions concerning acquiring and using resources efficiently to accomplish
organizational goals
›  Operational control
-  Executing specific tasks efficiently and effectively.
15
A Framework for IS Decision Analysis
16
EIS - Executive IS; MIS – Management IS; DSS – Decision Support System; ES – Expert System
Senior executives
Middle management
Low-level management
How Business Intelligence Works
17
Variety
of data
sources
Data
cubes
Inform
user
Analysis
Interaction
Architecture of a Typical BI IS
18
S. Chaudhuri, et a., An Overview of Business Intelligence Technology, ACM Communications, 2011.
H.J. Watson and B.H. Wixom, The Current State of Business Intelligence, Computer 40(9):96-9,
2007
Business Intelligence Information Systems
›  Multi-dimensional data analysis / Online Analytical Processing (OLAP)
-  Week 5 lecture
›  Data mining
›  Decision Support and Expert systems
›  Data / Information Visualisation
19
Types of BI IS
Data Mining
›  The process of discovering interesting patterns (or knowledge) from large
amounts of data.
-  Predicting trends and behaviours
-  Identifying previously unknown patterns and relationships
›  Data sources
-  databases
-  data warehouses
-  the Web
-  other information repositories
-  dynamic streams
20
Data Mining
›  Information Obtained:
-  Association: Things that tend to occur together
-  Sequences: Events linked over time
-  Classification: Patterns that correspond to a known group
-  Clustering: The discovery of groups within the data, new classifications
-  Forecasting: Prediction of unknown values given existing data
-  Summarisation: Compact representations of data
-  Outliers: Discovery of anomalies, data that do not fit the general pattern
›  Algorithms:
-  Association rule mining, k-means clustering, relevance vector machines, logistic,
regression, neural networks, deep learning (especially for learning optimal
representations)
21
A Story
›  Data:
-  1.2 million market baskets
-  Dates and times
-  25 stores
›  Mining:
-  Identify products that are bought together
›  Result:
-  Between 5pm and 7pm, customers that bought diapers were likely to buy beer.
22
Analysis of Shopping Baskets Truth disputed!
Data Mining Versus Statistical Analysis
› Statistical Analysis
-  Tests for statistical correctness of
models
-  Are statistical assumptions of
models correct?
-  Hypothesis testing
-  Is the relationship significant?
-  Tends to rely on sampling
-  Techniques are not optimised for
large amounts of data
-  Requires strong statistical skills
› Data Mining
-  Originally developed to act as
expert systems to solve problems
-  Less interested in the mechanics
of the technique
-  If it makes sense then let’s use it
-  Does not require assumptions to
be made about data
-  Can find patterns in very large
amounts of data
-  Requires understanding of data
and business problem
23
Some additional (easy to read) information:
http://www.dbta.com/Editorial/Trends-and-Applications/What-is-Data-Analysis-and-Data-
Mining-73503.aspx
http://technet.microsoft.com/en-us/library/ms175595.aspx
Architecture of Data Mining Systems
This is usually the source of data.
The data may require cleaning and
integration.
Is responsible for fetching relevant data based
on user request
Performs functionalities like characterization,
association, classification, prediction etc.
Tests for interestingness of a pattern
Communicates between users and data mining
system. Visualizes results or perform
exploration on data and schemas.
This is the information
of domain we are
mining like concept
hierarchies, to
organize attributes
onto various levels of
abstraction
Also contains user
beliefs, which can be
used to access
interestingness of
pattern or thresholds
Decision Support Systems (DSS)
›  Information systems that combine models and data in an attempt to solve
semi-structured and some unstructured problems with extensive user
involvement (interaction).
›  DSS Capabilities
-  What-if analysis – Impact of a change in the assumptions (input data) on the
proposed solution
-  Sensitivity analysis – Impact that changes in one (or more) parts of a model have
on other parts
-  Goal-seeking analysis – Find the value of the inputs necessary to achieve a
desired output
-  Optimisation analysis – Find the best value for one or more variables given
certain constraints.
25
Decision Support Systems
Components and the Decision Making Process
Data Warehouse /
Knowledge Base
Model /
Inference Engine
Visualization
User
Data Sources Intelligence – gathering facts, information,
statistics, etc.
Design– deciding which methods, formulas,
analysis techniques, algorithms, etc. to use.
Choice – selecting
the most promising
outcome from a list of
alternatives.
26
Group & Organizational DSS
›  Group DSS / Organisational DSS
-  Interactive IS that supports the process of finding solutions by a group of
decision makers
-  Improving communication; Coordination; Problem solving
-  Interaction is important!
27
http://www.youtube.com/watch?v=_53dvndkcrY
IBM Watson – BI, Data Retrieval and Text Mining
›  Watson uses many different techniques to assess the evidence and data it
has been provided
›  The confidence of its predictions is key to Watson’s success
›  Speed – Watson demonstrates that real time is possible, even for very
complex problems
›  Incremental improvement over time is critical
http://smartdatacollective.com/jamestaylor/32712/what-does-ibm-watson-mean-decision-management-and-
analytics
28
https://www.youtube.com/watch?v=_Xcmh1LQB9I
Data / Information Visualisation
Digital Dashboard
›  Provide rapid access to timely information.
›  Provide direct access to management reports.
›  Very user friendly and supported by graphics.
30
http://www.google.com/analytics/index.html
Google Analytics
›  Simple to add
-  Copy a code into the header of your html
›  Powerful Dashboard
-  Real-time (beta) feed of your activity
-  Report generated daily
›  Giving information and knowledge to adapt and improve
-  Estimating the number of visits based on history
-  Know where the interests are e.g., what country
-  What page is interesting
31
Social Media BI
›  Multi-source collection of mentions and popularity metrics
-  Social networks – Twitter, Facebook, YouTube, Google Buzz
-  Consumer review and news – reviews, blogs, forums, news media
-  Likes, followers, subscribers, views, plays, etc.
›  Powerful sentiment and semantic analysis
-  SAP Business Objects Text Analysis
-  Natural language processing engine
›  Dimensional analysis of metrics
-  Trend View & Dashboard
-  Live View & Explorer
-  Competitive comparison
›  Automated alerts
-  Trigger based on breach of dynamic threshold
32
Google Dashboard
https://code.google.com/apis/ajax/playground/?type=visualization#pie_chart
http://code.google.com/apis/chart/interactive/docs/gallery.html
33
Computer Graphics International 2014
34
http://rp-www.cs.usyd.edu.au/~cgi14/welcome/index.php
Real-time data available from Google Analytics can be used to understand and prepare conference
visits based on interests.
Business Intelligence Examples
Is the cost justified?
House of Cards
›  Business Model
-  People sign up for Netflix
-  Access to all shows
›  House of Cards cost:
-  US$100 million
-  26 episodes (2 seasons)
›  Break-Even Point
-  ~521,000 subscribers for 2 years
›  Why did they think this was a
good investment?
-  What do customers like?
37
http://www.greatbusinessschools.org/netflix/
Big Data for Competitive Advantage: Netflix
Netflix vs. Blockbuster
http://www.businessinsider.com.au/how-netflix-bankrupted-and-destroyed-
blockbuster-infographic-2011-3
Big Data for Competitive Advantage: Netflix
http://knowledge.wharton.upenn.edu/article/netflix-one-eye-on-the-present-and-another-on-
the-future/
http://netflixprize.com/
Recommender System
Millions of User
Thousands of Videos
Billions of Ratings
Database
Personalised
Recommendation
https://www.youtube.com/watch?v=922zVn00Yy8
Improving Customer Satisfaction with Big Data
›  If people lose too often,
they will be unhappy.
›  Competitor might become
more attractive.
›  How do you identify
players that are “at risk” of
defecting?
University of Kentucky
›  http://www.youtube.com/watch?v=etdpAkn-F-Q
›  Perspectives from different stakeholders
-  Personalized student services (academic and non-academic)
-  Increased retention
-  Revenue (feedback into University improvements)
Dell™ Education Data Management (EDM)
41
Social Media BI – CRM Integration
›  Ability to track brands on social media to understand customer sentiments.
›  Each user is given a ‘status’ which indicates how influential you are e.g.,
your number of friends or followers (Facebook, Twitter), your work
(LinkedIn) and other details.
›  Network analysis.
42
http://www.mantis-tgi.com/mantis-
products/pulse-analytics/
Social Media BI – Business Value
›  Improve marketing and customer service
-  Listen to consumer sentiment
-  Respond quickly to customer service issues
-  Measure effectiveness of marketing campaigns
›  Track sentiment across market segments
-  Brand, geography, language, most mentioned topics
›  Track competitive sentiment
-  Understand what consumers like and dislike about competitors
›  Reduce product design lifecycle
-  Get consumer feedback in real-time
“Social media tools are
having a huge impact on
customer service and
employee hiring to
marketing and product
development.”
Jason Peck
6 Buckets of Social Media
Measurement
January 19, 2011
43
Social Media – Age of Ultron
44
http://onemilliontweetmap.com/
Kaggle – Data Science as a Competition
45
http://www.kaggle.com/competitions
›  A platform for presenting
predictive modelling
problems as competitions
›  Competitors include
computer scientists, data
scientists, etc.
›  Netflix Prize was very similar
Shared Bicycle Programs
›  Data mining the patterns
of bike rentals around
the city.
›  The detection of bike
location and movement
could then be used to
analyse the “pulse” or
the pattern of the people
around the city.
›  BI was used to improve
bike planning and also
city event planning.
46
J. Froehlich, J. Neumann and N. Oliver, Measuring the Pulse of the City through Shared Bicycle
Programs ,UrbanSense08, 2008
Shared Bicycle Programs
47
Big Data for Quantifying the Beautiful Game
›  Real-time data collection for sports
analysis.
›  Tracking and visualising the impact
of different soccer players.
›  Data mining and analysis used for
developing team strategy, matching
opponents injury prevention etc.
48
http://www.wired.com/playbook/2012/09/major-league-socccer-micoach/all/
http://matchcenter.mlssoccer.com/matchcenter/2015-04-18-fc-dallas-vs-toronto-fc/stats
Big Data for Quantifying the Beautiful Game
49
How Companies Learn Your Secrets
›  Target tracks customers using their credit card, name, or email address.
›  Purchase history complemented with demographic information Target has
collected from them or bought from other sources.
http://www.nytimes.com/2012/02/19/magazine/shopping-habits.html?pagewanted=1&_r=2&hp&
›  Example Aim:
-  Predict pregnancy so
marketing can be targeted
BEFORE the child is born.
Computer Aided Diagnosis (CAD)
51
E. Kotter & M. Langer, “Computer aided detection and diagnosis in radiology”, Eur Radiolo., 2011
A. Kumar, J. Kim, L. Wen M. Fulham, and D. Feng, “A graph-based approach for the retrieval of multi-modality
medical images”, Medical Image Analysis 18(2):330-342.
›  Expert Systems and Decision
Support in imaging
›  Automated CAD systems
provide their own analysis for
some imaging modalities such
as High-Resolution CT
(HRCT) and Mammography.
›  Example: System provides a
‘second opinion’ about
suspected lung cancer
›  Trained on similar cases in the
database.
›  PET-CT example below.
Example: EXINI bone
EXINI Diagnostics: http://exini.com/
52
Time Oct 04 May 05 Oct 05
Bone Scintigraphy
Automated
Analysis
Example: EXINI bone
EXINI Diagnostics: http://exini.com/
53
Detailed
Quantified
Information
Bone structures outlined
Hot spots marked
High probability of metastases
Example: EXINI bone
EXINI Diagnostics: http://exini.com/
54
Automatically
Generated
Report
Banking
›  Intense competition in the sector.
›  HSBC need to cross-sell more effectively by identifying profiles that would
be interested in higher yielding investments.
›  Needed to retain customers with “maturing” products.
›  Using SPSS products, HSBC found that it could reduce direct mail costs
by 30% while still bringing in 95% of the campaign’s revenue.
›  Less “junk” mail related to happier customers. Increased loyalty.
http://www-01.ibm.com/software/analytics/spss/
55
Daimler’s Quality Information System (QUIS)
›  AQUA Miner analysed data on the vehicle:
-  RPM, Vibration, Temperature, etc
-  Used to detect defects
-  Eliminating problems during production
-  Data scientists are the “new” test drivers
56
http://www.teradatamagazine.com/v11n01/Features/Daimler-Drives-High-Performance/
Inside the Shadowy World of Data Brokers
›  Also called information broker or information
reseller,
›  Business that collects personal information about
consumers
›  Sells that information to other organizations
›  Public and non-public sources
-  courthouse records
-  website cookies
-  loyalty card programs
›  Profile individuals for marketing purposes
›  Profiles sold to businesses for targeted marketing
57
http://www.cio.com/article/750322/Inside_the_Shadowy_World_of_Data_Brokers
Data Broker: TowerData
58
http://intelligence.towerdata.com/
Tutorial 3
Tutorial
›  Topic: Grand Challenges for Information Systems / Analytics
›  Preparation
-  Read the article uploaded to LMS
-  Answer the multiple-choice quiz
›  Tutorial
-  Supplementary reading material
-  Group discussion
-  Answer questions (as a group) via Socrative
-  Live discussion
Tutorial
›  Each group should visit https://b.socrative.com/
-  Room Code:
›  Read the articles and discuss the following questions. Enter your
responses into Socrative.
1.  Describe the main challenges in big data analytics. Provide examples from the
lectures, the pre-reading, or the articles.
2.  What characteristics of big data are responsible for these challenges?
3.  What are some current approaches to addressing big data challenges? Have
they “solved” the problem?
4.  In your opinion, which is the most important challenge in data analytics? Why?
61

data mining

  • 1.
  • 2.
    FACULTY OF ENGINEERING & INFORMATION TECHNOLOGIES Introductionto Information Systems Week 7. Business Intelligence & Analytics and Decision Support Systems COMP5206 Ashnil Kumar
  • 3.
    Week 5 Outline › Lecture -  Business Intelligence & Analytics and Decision Support Systems -  Book chapters (5th Edi. Rainer, Prince and Cegielski): -  Chapter 12. Business Analytics ›  Tutorial 3: Grand Challenges for Information Systems and Analytics -  Pre-reading: -  H. Chen et al., "Business Intelligence and Analytics: From Big Data to Big Impact", MIS Quarterly 36(4):1165-1188. -  Supplementary Readings -  Discussion 3 Agenda
  • 4.
    Week Topic SupplementaryActivity 1. 5 Mar Introduction to ‘ Information Technologies and Systems’ and Course Overview Organisational Strategy and Competitive Advantage 2. 12 Mar E-Business and E-Commerce Electronic Payments Tute 1. Internet-enabled Business models 3. 19 Mar Mobile Computing and Mobile Commerce Tute 2. System Thinking – Application to Online Education 4. 26 Mar Web Technologies; Social Computing Telecommunications and Networking (Infrastructure) Demo 1. Microsoft Excel Pivot Introduction Lab 1. Market Data analysis with Pivot 5. 2 April Information Security; Ethics and Privacy in ITS Course Review for the Quiz Ass 1. (Research Report) – Intro / Topic Selection Demo 2. Microsoft Excel Statistical Data Analysis Lab 2. Microsoft Excel Statistical Data Analysis Easter Vacation 6. 16 Apr Data and Knowledge Management Mid-semester Quiz 7. 23 Apr Business Intelligence / Analytics (Big Data) Decision Support Systems (DSS) Tute 3. Grand Challenges for Information Systems / Analytics 8. 30 Apr Acquiring Information Systems; System Development Life Cycle Ass 2. (Lab) – Intro Demo 3. Microsoft Power Pivot Introduction Lab 3. Microsoft Power Pivot Introduction 9. 7 May Information Systems within an Organisation Customer Relationship Management (CRM) Lab 4. All Labs (Cognos Insight as extra exercise for advanced students) 10. 14 May Enterprise Resource Planning (ERP) Enterprise Content Management (ECM) Ass 1. Presentations – Session 1 Ass 1. (Individual Research Report / Group Video) – Submission 11. 21 May Supply Chain Management (SCM) Ass 1. Presentations – Session 2 12. 28 May Information Technologies and Systems in a specialised Sector* Ass 1. Presentations – Session 3 Ass 2. Submission 13. 4 June Course Revision and Exam preparations Ass 1. Presentations – Session 4 UoS Outline 4
  • 5.
    Apple ResearchKit 5 ›  OpenSource Software Framework -  Collect data frequently -  Share data -  Create Apps
  • 6.
    One Billion MobileUsers 6 http://recode.net/2014/03/26/the-other-facebook-news-one-billion-mobile-users/ ›  Increasing use of mobile devices is an opportunity for: -  Data collection -  Analytics delivery ›  Personalization! -  Based on analysis.
  • 7.
    Funf Open SensingFramework ›  A framework to integrate sensing data from your mobile phone and converting it into meaningful data e.g., visualisation, notification, use in an application, and reporting. ›  Data can be used to make decisions and assist in your activities ›  What is ‘meaningful data’? -  Necessary to make informed choices, i.e., ‘intelligence’. http://funf.org/about.html
  • 8.
  • 9.
    Some Definitions ›  BusinessIntelligence -  The set of methods and tools for transforming data into useful information for business analysis purposes. ›  Analytics -  The systematic computational analysis of data or statistics. ›  Decision Support Systems -  A set of related computer programs and the data required to assist with analysis and decision-making within an organization.
  • 10.
    Customer Service Public Relations Marketing Executive “Iwant to respond to what customers are saying about our product and resolve their issues.” “I want to measure the effectiveness of our campaigns and promotions.” “I want to measure sentiment towards our company among the public and among analysts.” “I want to know that my company is respected and our customers are happy.” Brand / Product Manager “I need to know what consumers like and dislike about my competitors products so I can make ours better. ” Why do we need Business Intelligence? 10
  • 11.
    Challenges in BusinessIntelligence 11 Challenge Motivation Technologies The number of alternatives to be considered constantly increases Exponential increase in data collections. Data Mining; Data Analysis; Visualisation Decisions must be made under time pressure Real-time business models (e.g. currency exchange) Visualisation; Dash Board; Communication; HPC Decisions are more complex More data, more relationships, and more parameters to optimise Support systems; Expert Systems; HPC Decision makers can be in different locations and so is the information Globalisation Communication; Virtual meeting HPC – High performance computing, e.g., grids, super-computers, cloud computing
  • 12.
    The Manager’s Joband Decision Making ›  The three basic roles of managers (Mintzberg 1973): -  Interpersonal: figurehead, leader, liaison -  Informational: monitor, disseminator, spokesperson -  Decisional: disturbance handler, resource allocator, negotiator ›  Decision -  A choice between two or more alternatives -  Made by either an individual or a group -  Decision making as a systematic process (Simon, 1977) -  Intelligence gathering -  Design -  Choice 12
  • 13.
    Decision Making Process 13 Whatis the problem? What are my options? Pick an option and decide how to implement it. Did it work?
  • 14.
    Types of DecisionMaking Problems ›  Fuzzy, complex problems for which there are no tried-and-tested solutions. 14 Highly structured Semi-structured Highly unstructured ›  Routine and repetitive problems for which standard solutions exist. ›  Problems in which only some of the decision process phases are structured.
  • 15.
    The Nature ofDecisions ›  Different people make different kinds of decisions ›  Strategic planning -  Decisions concerning long range goals, development of policies for growth, and resource allocation. ›  Management control -  Decisions concerning acquiring and using resources efficiently to accomplish organizational goals ›  Operational control -  Executing specific tasks efficiently and effectively. 15
  • 16.
    A Framework forIS Decision Analysis 16 EIS - Executive IS; MIS – Management IS; DSS – Decision Support System; ES – Expert System Senior executives Middle management Low-level management
  • 17.
    How Business IntelligenceWorks 17 Variety of data sources Data cubes Inform user Analysis Interaction
  • 18.
    Architecture of aTypical BI IS 18 S. Chaudhuri, et a., An Overview of Business Intelligence Technology, ACM Communications, 2011. H.J. Watson and B.H. Wixom, The Current State of Business Intelligence, Computer 40(9):96-9, 2007
  • 19.
    Business Intelligence InformationSystems ›  Multi-dimensional data analysis / Online Analytical Processing (OLAP) -  Week 5 lecture ›  Data mining ›  Decision Support and Expert systems ›  Data / Information Visualisation 19 Types of BI IS
  • 20.
    Data Mining ›  Theprocess of discovering interesting patterns (or knowledge) from large amounts of data. -  Predicting trends and behaviours -  Identifying previously unknown patterns and relationships ›  Data sources -  databases -  data warehouses -  the Web -  other information repositories -  dynamic streams 20
  • 21.
    Data Mining ›  InformationObtained: -  Association: Things that tend to occur together -  Sequences: Events linked over time -  Classification: Patterns that correspond to a known group -  Clustering: The discovery of groups within the data, new classifications -  Forecasting: Prediction of unknown values given existing data -  Summarisation: Compact representations of data -  Outliers: Discovery of anomalies, data that do not fit the general pattern ›  Algorithms: -  Association rule mining, k-means clustering, relevance vector machines, logistic, regression, neural networks, deep learning (especially for learning optimal representations) 21
  • 22.
    A Story ›  Data: - 1.2 million market baskets -  Dates and times -  25 stores ›  Mining: -  Identify products that are bought together ›  Result: -  Between 5pm and 7pm, customers that bought diapers were likely to buy beer. 22 Analysis of Shopping Baskets Truth disputed!
  • 23.
    Data Mining VersusStatistical Analysis › Statistical Analysis -  Tests for statistical correctness of models -  Are statistical assumptions of models correct? -  Hypothesis testing -  Is the relationship significant? -  Tends to rely on sampling -  Techniques are not optimised for large amounts of data -  Requires strong statistical skills › Data Mining -  Originally developed to act as expert systems to solve problems -  Less interested in the mechanics of the technique -  If it makes sense then let’s use it -  Does not require assumptions to be made about data -  Can find patterns in very large amounts of data -  Requires understanding of data and business problem 23 Some additional (easy to read) information: http://www.dbta.com/Editorial/Trends-and-Applications/What-is-Data-Analysis-and-Data- Mining-73503.aspx http://technet.microsoft.com/en-us/library/ms175595.aspx
  • 24.
    Architecture of DataMining Systems This is usually the source of data. The data may require cleaning and integration. Is responsible for fetching relevant data based on user request Performs functionalities like characterization, association, classification, prediction etc. Tests for interestingness of a pattern Communicates between users and data mining system. Visualizes results or perform exploration on data and schemas. This is the information of domain we are mining like concept hierarchies, to organize attributes onto various levels of abstraction Also contains user beliefs, which can be used to access interestingness of pattern or thresholds
  • 25.
    Decision Support Systems(DSS) ›  Information systems that combine models and data in an attempt to solve semi-structured and some unstructured problems with extensive user involvement (interaction). ›  DSS Capabilities -  What-if analysis – Impact of a change in the assumptions (input data) on the proposed solution -  Sensitivity analysis – Impact that changes in one (or more) parts of a model have on other parts -  Goal-seeking analysis – Find the value of the inputs necessary to achieve a desired output -  Optimisation analysis – Find the best value for one or more variables given certain constraints. 25
  • 26.
    Decision Support Systems Componentsand the Decision Making Process Data Warehouse / Knowledge Base Model / Inference Engine Visualization User Data Sources Intelligence – gathering facts, information, statistics, etc. Design– deciding which methods, formulas, analysis techniques, algorithms, etc. to use. Choice – selecting the most promising outcome from a list of alternatives. 26
  • 27.
    Group & OrganizationalDSS ›  Group DSS / Organisational DSS -  Interactive IS that supports the process of finding solutions by a group of decision makers -  Improving communication; Coordination; Problem solving -  Interaction is important! 27 http://www.youtube.com/watch?v=_53dvndkcrY
  • 28.
    IBM Watson –BI, Data Retrieval and Text Mining ›  Watson uses many different techniques to assess the evidence and data it has been provided ›  The confidence of its predictions is key to Watson’s success ›  Speed – Watson demonstrates that real time is possible, even for very complex problems ›  Incremental improvement over time is critical http://smartdatacollective.com/jamestaylor/32712/what-does-ibm-watson-mean-decision-management-and- analytics 28 https://www.youtube.com/watch?v=_Xcmh1LQB9I
  • 29.
    Data / InformationVisualisation
  • 30.
    Digital Dashboard ›  Providerapid access to timely information. ›  Provide direct access to management reports. ›  Very user friendly and supported by graphics. 30 http://www.google.com/analytics/index.html
  • 31.
    Google Analytics ›  Simpleto add -  Copy a code into the header of your html ›  Powerful Dashboard -  Real-time (beta) feed of your activity -  Report generated daily ›  Giving information and knowledge to adapt and improve -  Estimating the number of visits based on history -  Know where the interests are e.g., what country -  What page is interesting 31
  • 32.
    Social Media BI › Multi-source collection of mentions and popularity metrics -  Social networks – Twitter, Facebook, YouTube, Google Buzz -  Consumer review and news – reviews, blogs, forums, news media -  Likes, followers, subscribers, views, plays, etc. ›  Powerful sentiment and semantic analysis -  SAP Business Objects Text Analysis -  Natural language processing engine ›  Dimensional analysis of metrics -  Trend View & Dashboard -  Live View & Explorer -  Competitive comparison ›  Automated alerts -  Trigger based on breach of dynamic threshold 32
  • 33.
  • 34.
    Computer Graphics International2014 34 http://rp-www.cs.usyd.edu.au/~cgi14/welcome/index.php Real-time data available from Google Analytics can be used to understand and prepare conference visits based on interests.
  • 35.
  • 36.
    Is the costjustified?
  • 37.
    House of Cards › Business Model -  People sign up for Netflix -  Access to all shows ›  House of Cards cost: -  US$100 million -  26 episodes (2 seasons) ›  Break-Even Point -  ~521,000 subscribers for 2 years ›  Why did they think this was a good investment? -  What do customers like? 37 http://www.greatbusinessschools.org/netflix/
  • 38.
    Big Data forCompetitive Advantage: Netflix Netflix vs. Blockbuster http://www.businessinsider.com.au/how-netflix-bankrupted-and-destroyed- blockbuster-infographic-2011-3
  • 39.
    Big Data forCompetitive Advantage: Netflix http://knowledge.wharton.upenn.edu/article/netflix-one-eye-on-the-present-and-another-on- the-future/ http://netflixprize.com/ Recommender System Millions of User Thousands of Videos Billions of Ratings Database Personalised Recommendation
  • 40.
    https://www.youtube.com/watch?v=922zVn00Yy8 Improving Customer Satisfactionwith Big Data ›  If people lose too often, they will be unhappy. ›  Competitor might become more attractive. ›  How do you identify players that are “at risk” of defecting?
  • 41.
    University of Kentucky › http://www.youtube.com/watch?v=etdpAkn-F-Q ›  Perspectives from different stakeholders -  Personalized student services (academic and non-academic) -  Increased retention -  Revenue (feedback into University improvements) Dell™ Education Data Management (EDM) 41
  • 42.
    Social Media BI– CRM Integration ›  Ability to track brands on social media to understand customer sentiments. ›  Each user is given a ‘status’ which indicates how influential you are e.g., your number of friends or followers (Facebook, Twitter), your work (LinkedIn) and other details. ›  Network analysis. 42 http://www.mantis-tgi.com/mantis- products/pulse-analytics/
  • 43.
    Social Media BI– Business Value ›  Improve marketing and customer service -  Listen to consumer sentiment -  Respond quickly to customer service issues -  Measure effectiveness of marketing campaigns ›  Track sentiment across market segments -  Brand, geography, language, most mentioned topics ›  Track competitive sentiment -  Understand what consumers like and dislike about competitors ›  Reduce product design lifecycle -  Get consumer feedback in real-time “Social media tools are having a huge impact on customer service and employee hiring to marketing and product development.” Jason Peck 6 Buckets of Social Media Measurement January 19, 2011 43
  • 44.
    Social Media –Age of Ultron 44 http://onemilliontweetmap.com/
  • 45.
    Kaggle – DataScience as a Competition 45 http://www.kaggle.com/competitions ›  A platform for presenting predictive modelling problems as competitions ›  Competitors include computer scientists, data scientists, etc. ›  Netflix Prize was very similar
  • 46.
    Shared Bicycle Programs › Data mining the patterns of bike rentals around the city. ›  The detection of bike location and movement could then be used to analyse the “pulse” or the pattern of the people around the city. ›  BI was used to improve bike planning and also city event planning. 46 J. Froehlich, J. Neumann and N. Oliver, Measuring the Pulse of the City through Shared Bicycle Programs ,UrbanSense08, 2008
  • 47.
  • 48.
    Big Data forQuantifying the Beautiful Game ›  Real-time data collection for sports analysis. ›  Tracking and visualising the impact of different soccer players. ›  Data mining and analysis used for developing team strategy, matching opponents injury prevention etc. 48 http://www.wired.com/playbook/2012/09/major-league-socccer-micoach/all/ http://matchcenter.mlssoccer.com/matchcenter/2015-04-18-fc-dallas-vs-toronto-fc/stats
  • 49.
    Big Data forQuantifying the Beautiful Game 49
  • 50.
    How Companies LearnYour Secrets ›  Target tracks customers using their credit card, name, or email address. ›  Purchase history complemented with demographic information Target has collected from them or bought from other sources. http://www.nytimes.com/2012/02/19/magazine/shopping-habits.html?pagewanted=1&_r=2&hp& ›  Example Aim: -  Predict pregnancy so marketing can be targeted BEFORE the child is born.
  • 51.
    Computer Aided Diagnosis(CAD) 51 E. Kotter & M. Langer, “Computer aided detection and diagnosis in radiology”, Eur Radiolo., 2011 A. Kumar, J. Kim, L. Wen M. Fulham, and D. Feng, “A graph-based approach for the retrieval of multi-modality medical images”, Medical Image Analysis 18(2):330-342. ›  Expert Systems and Decision Support in imaging ›  Automated CAD systems provide their own analysis for some imaging modalities such as High-Resolution CT (HRCT) and Mammography. ›  Example: System provides a ‘second opinion’ about suspected lung cancer ›  Trained on similar cases in the database. ›  PET-CT example below.
  • 52.
    Example: EXINI bone EXINIDiagnostics: http://exini.com/ 52 Time Oct 04 May 05 Oct 05 Bone Scintigraphy Automated Analysis
  • 53.
    Example: EXINI bone EXINIDiagnostics: http://exini.com/ 53 Detailed Quantified Information Bone structures outlined Hot spots marked High probability of metastases
  • 54.
    Example: EXINI bone EXINIDiagnostics: http://exini.com/ 54 Automatically Generated Report
  • 55.
    Banking ›  Intense competitionin the sector. ›  HSBC need to cross-sell more effectively by identifying profiles that would be interested in higher yielding investments. ›  Needed to retain customers with “maturing” products. ›  Using SPSS products, HSBC found that it could reduce direct mail costs by 30% while still bringing in 95% of the campaign’s revenue. ›  Less “junk” mail related to happier customers. Increased loyalty. http://www-01.ibm.com/software/analytics/spss/ 55
  • 56.
    Daimler’s Quality InformationSystem (QUIS) ›  AQUA Miner analysed data on the vehicle: -  RPM, Vibration, Temperature, etc -  Used to detect defects -  Eliminating problems during production -  Data scientists are the “new” test drivers 56 http://www.teradatamagazine.com/v11n01/Features/Daimler-Drives-High-Performance/
  • 57.
    Inside the ShadowyWorld of Data Brokers ›  Also called information broker or information reseller, ›  Business that collects personal information about consumers ›  Sells that information to other organizations ›  Public and non-public sources -  courthouse records -  website cookies -  loyalty card programs ›  Profile individuals for marketing purposes ›  Profiles sold to businesses for targeted marketing 57 http://www.cio.com/article/750322/Inside_the_Shadowy_World_of_Data_Brokers
  • 58.
  • 59.
  • 60.
    Tutorial ›  Topic: GrandChallenges for Information Systems / Analytics ›  Preparation -  Read the article uploaded to LMS -  Answer the multiple-choice quiz ›  Tutorial -  Supplementary reading material -  Group discussion -  Answer questions (as a group) via Socrative -  Live discussion
  • 61.
    Tutorial ›  Each groupshould visit https://b.socrative.com/ -  Room Code: ›  Read the articles and discuss the following questions. Enter your responses into Socrative. 1.  Describe the main challenges in big data analytics. Provide examples from the lectures, the pre-reading, or the articles. 2.  What characteristics of big data are responsible for these challenges? 3.  What are some current approaches to addressing big data challenges? Have they “solved” the problem? 4.  In your opinion, which is the most important challenge in data analytics? Why? 61