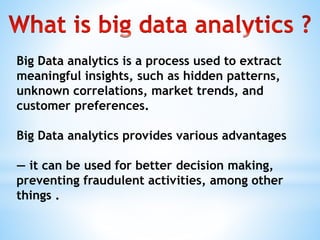
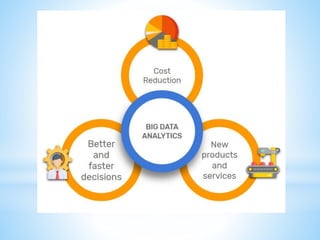
Big Data analytics is a process used to extract
meaningful insights, such as hidden patterns,
unknown correlations, market trends, and
customer preferences.
Big Data analytics provides various advantages
— it can be used for better decision making,
preventing fraudulent activities, among other
things .
 The term business intelligence refers to
technologies,application and practices for
collection,integration ,analysis, and
presentation of business information.
 Business intelligence are data driven and
decision support system(Dss).
 Business intelligence (BI) is an
umbrella term for the technology
that enables data preparation, data
mining, data management, and
data visualization.
 Business intelligence tools and
processes allow end users to
identify actionable information
from raw data, facilitating data-
driven decision-making within
organizations across various
industries.
 Business Intelligence (BI) Tool is a software
application that collects, transforms, and
presents data to help decision-makers
drive business growth. BI tool ingests large
amounts of structured and unstructured
data from varied sources, transforms it and
helps deduce actionable business insights
from the data.
 BI tool also offers data visualization, data
integration and reporting.
SAP Business Objects is a business intelligence
software which offers comprehesive reporting,
analysis and interactive data visualisation. The
platform focuses heavily on caterogies such as
Customer Experience (CX) and CRM, digital
supply chain, ERP and more. What’s really nice
about this platform is the self-service, role-based
dashboards its offers enabling users to build their
own dashaboards and applications. SAP is a
robust software intended for all roles (IT, end uses
and management) and offers tons of
functionalities in one platform. The complexity of
the product, however, does drive up the price so
be prepared for that.
Datapine is an all-in-one business
intelligence platform that facilitates the
complex process of data analytics even for
non-technical users. Thanks to a
comprehensive self-service analytics
approach, datapine’s solution enables data
analysts and business users alike to easily
integrate different data sources, perform
advanced data analysis, build interactive
business dashboards and generate
actionable business insights.
While SAS’ most popular offering is its
advanced predictive analytics, it also
provides a great business intelligence
platform. This well-seasoned self-service
tool, which was founded back in the 1970s,
allows users to leverage data and metrics to
make informed decisions about their
business. Using their set of APIs, users are
provided with lots of customisation options,
and SAS ensures high-level data integration
and advanced analytics & reporting. They
also have a great text analytics feature to
give you more contextual insights into your
data.
Yellowfin BI is a business intelligence tool and
‘end-to-end’ analytics platform that combines
visualisation, machine learning, and
collaboration. You can also easily filter
through tons of data with intuitive filtering
(e.g. checkboxes and radio buttons) as well
open up dashboards just about anywhere
(thanks to this tool’s flexibility in accessibility
(mobile, webpage, etc.). The nice thing about
this BI tool is that you can easily take
dashboards and visualisations to the next level
using a no code/low code development
environment.
Oracle BI is an enterprise portfolio of
technology and applications for business
intelligence. This technology gives users
pretty much all business intelligence
capabilities, such as dashboards,
proactive intelligence, ad hoc, and more.
Oracle is also great for companies who
need to analyse large data volumes (from
Oracle and non-Oracle sources) as it is a
very robust solution. Additional key
features include data archiving,
versioning, a self-service portal and
alerts/notifications.
Business intelligence software is a
type of application software designed
to retrieve, analyze, transform and
report data for business intelligence.
The applications generally read data
that has been previously stored, often
- though not necessarily - in a data
warehouse or data mart.
•Data mining: Using databases, statistics
and machine learning to uncover trends in
large datasets.
•Reporting: Sharing data analysis to
stakeholders so they can draw conclusions
and make decisions.
•Performance metrics and
benchmarking: Comparing current
performance data to historical data to track
performance against goals, typically using
customized dashboards.
•Descriptive analytics: Using preliminary
data analysis to find out what happened.
•Querying: Asking the data specific questions,
BI pulling the answers from the datasets.
•Statistical analysis: Taking the results from
descriptive analytics and further exploring the
data using statistics such as how this trend
happened and why.
•Data visualization: Turning data analysis into
visual representations such as charts, graphs,
and histograms to more easily consume data.
•Visual analysis: Exploring data through visual
storytelling to communicate insights on the fly
and stay in the flow of analysis.
•Data preparation: Compiling multiple data
sources, identifying the dimensions and
measurements, preparing it for data analysis.
Business Skills:
 Excellent communication and presentation skills
in order to share recommendations often based
on highly technical data with colleagues in an
approachable, easily digestible way
 Superior leadership abilities, as well as ability
to brainstorm and collaborate with team members
on a data science project
•Creative problem-solving skills and critical thinking
•Ability to work within a diverse, global workforce
that is oriented around customer satisfaction,
particularly as many business intelligence analysts
are asked to work directly with clients.
 Database design and data architecture
 Data mining and analytics
 Data security and privacy
 Data visualization, including tools such
as Tableau and Qlik
 Handle all variants of SQL
 Proficient in ETL (extract, transform, load)
 Understand which situations
need Hadoop, R, and SAS and use these
effectively
 Cloud computing and data storage
technology, such as Google’s BigQuery and
 Amazon’s Redshift
Business intelligence

Business intelligence

  • 3.
    Big Data analyticsis a process used to extract meaningful insights, such as hidden patterns, unknown correlations, market trends, and customer preferences. Big Data analytics provides various advantages — it can be used for better decision making, preventing fraudulent activities, among other things .
  • 5.
     The termbusiness intelligence refers to technologies,application and practices for collection,integration ,analysis, and presentation of business information.  Business intelligence are data driven and decision support system(Dss).
  • 6.
     Business intelligence(BI) is an umbrella term for the technology that enables data preparation, data mining, data management, and data visualization.  Business intelligence tools and processes allow end users to identify actionable information from raw data, facilitating data- driven decision-making within organizations across various industries.
  • 7.
     Business Intelligence(BI) Tool is a software application that collects, transforms, and presents data to help decision-makers drive business growth. BI tool ingests large amounts of structured and unstructured data from varied sources, transforms it and helps deduce actionable business insights from the data.  BI tool also offers data visualization, data integration and reporting.
  • 10.
    SAP Business Objectsis a business intelligence software which offers comprehesive reporting, analysis and interactive data visualisation. The platform focuses heavily on caterogies such as Customer Experience (CX) and CRM, digital supply chain, ERP and more. What’s really nice about this platform is the self-service, role-based dashboards its offers enabling users to build their own dashaboards and applications. SAP is a robust software intended for all roles (IT, end uses and management) and offers tons of functionalities in one platform. The complexity of the product, however, does drive up the price so be prepared for that.
  • 12.
    Datapine is anall-in-one business intelligence platform that facilitates the complex process of data analytics even for non-technical users. Thanks to a comprehensive self-service analytics approach, datapine’s solution enables data analysts and business users alike to easily integrate different data sources, perform advanced data analysis, build interactive business dashboards and generate actionable business insights.
  • 14.
    While SAS’ mostpopular offering is its advanced predictive analytics, it also provides a great business intelligence platform. This well-seasoned self-service tool, which was founded back in the 1970s, allows users to leverage data and metrics to make informed decisions about their business. Using their set of APIs, users are provided with lots of customisation options, and SAS ensures high-level data integration and advanced analytics & reporting. They also have a great text analytics feature to give you more contextual insights into your data.
  • 16.
    Yellowfin BI isa business intelligence tool and ‘end-to-end’ analytics platform that combines visualisation, machine learning, and collaboration. You can also easily filter through tons of data with intuitive filtering (e.g. checkboxes and radio buttons) as well open up dashboards just about anywhere (thanks to this tool’s flexibility in accessibility (mobile, webpage, etc.). The nice thing about this BI tool is that you can easily take dashboards and visualisations to the next level using a no code/low code development environment.
  • 18.
    Oracle BI isan enterprise portfolio of technology and applications for business intelligence. This technology gives users pretty much all business intelligence capabilities, such as dashboards, proactive intelligence, ad hoc, and more. Oracle is also great for companies who need to analyse large data volumes (from Oracle and non-Oracle sources) as it is a very robust solution. Additional key features include data archiving, versioning, a self-service portal and alerts/notifications.
  • 19.
    Business intelligence softwareis a type of application software designed to retrieve, analyze, transform and report data for business intelligence. The applications generally read data that has been previously stored, often - though not necessarily - in a data warehouse or data mart.
  • 20.
    •Data mining: Usingdatabases, statistics and machine learning to uncover trends in large datasets. •Reporting: Sharing data analysis to stakeholders so they can draw conclusions and make decisions. •Performance metrics and benchmarking: Comparing current performance data to historical data to track performance against goals, typically using customized dashboards. •Descriptive analytics: Using preliminary data analysis to find out what happened.
  • 21.
    •Querying: Asking thedata specific questions, BI pulling the answers from the datasets. •Statistical analysis: Taking the results from descriptive analytics and further exploring the data using statistics such as how this trend happened and why. •Data visualization: Turning data analysis into visual representations such as charts, graphs, and histograms to more easily consume data. •Visual analysis: Exploring data through visual storytelling to communicate insights on the fly and stay in the flow of analysis. •Data preparation: Compiling multiple data sources, identifying the dimensions and measurements, preparing it for data analysis.
  • 22.
    Business Skills:  Excellentcommunication and presentation skills in order to share recommendations often based on highly technical data with colleagues in an approachable, easily digestible way  Superior leadership abilities, as well as ability to brainstorm and collaborate with team members on a data science project •Creative problem-solving skills and critical thinking •Ability to work within a diverse, global workforce that is oriented around customer satisfaction, particularly as many business intelligence analysts are asked to work directly with clients.
  • 23.
     Database designand data architecture  Data mining and analytics  Data security and privacy  Data visualization, including tools such as Tableau and Qlik  Handle all variants of SQL  Proficient in ETL (extract, transform, load)  Understand which situations need Hadoop, R, and SAS and use these effectively  Cloud computing and data storage technology, such as Google’s BigQuery and  Amazon’s Redshift