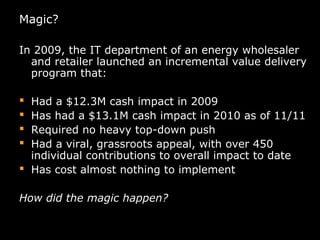
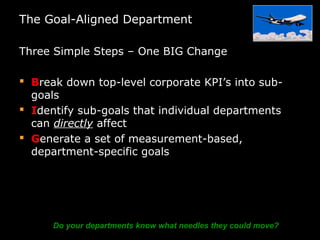
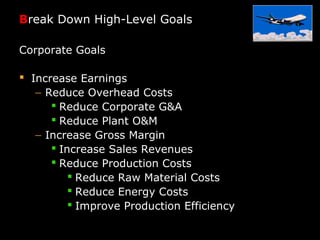
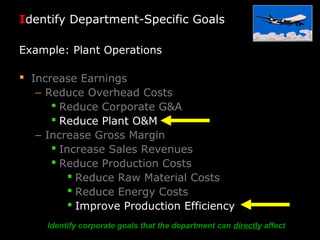
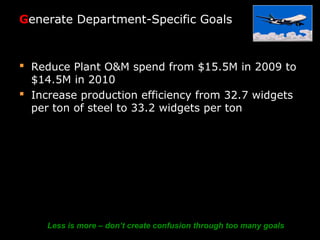
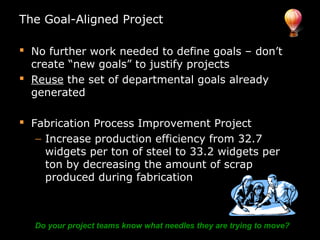
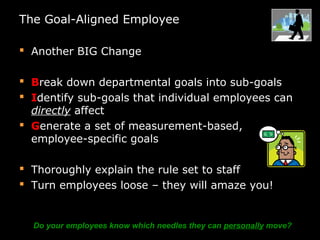
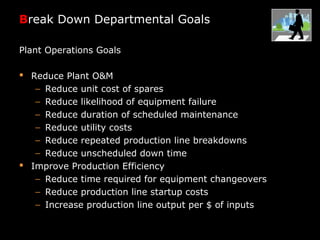
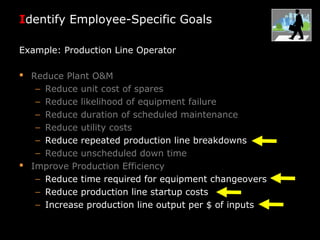
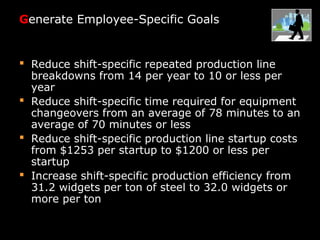
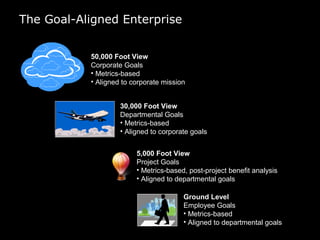
In 2009, an energy wholesaler's IT department initiated a successful, grassroots value delivery program that yielded significant cash impacts without heavy top-down involvement. The document outlines a strategic framework for aligning corporate, departmental, and employee goals with measurable metrics to enhance performance. Key recommendations include breaking down high-level goals into actionable sub-goals across all organization levels to foster accountability and improve efficiency.


![Gis Intro Presentation Bulgarian[1]](https://cdn.slidesharecdn.com/ss_thumbnails/gisintropresentationbulgarian1-091130075405-phpapp01-thumbnail.jpg?width=640&height=640&fit=bounds)

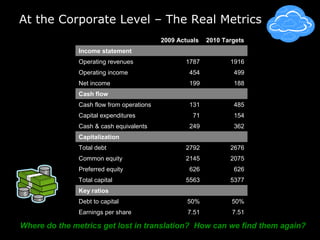
![How to Structure a Blog Post to Create More Leads [V2]](https://cdn.slidesharecdn.com/ss_thumbnails/structureablogposttocreatemoreleads-100525003417-phpapp01-thumbnail.jpg?width=640&height=640&fit=bounds)


![2841107 training %20-effective%20goal%20setting-employee1[1][1]](https://cdn.slidesharecdn.com/ss_thumbnails/2841107training-20effective20goal20setting-employee111-111023181340-phpapp02-thumbnail.jpg?width=640&height=640&fit=bounds)


