Download to read offline


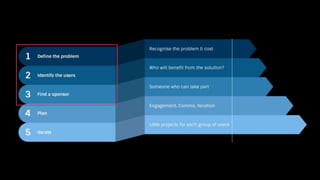
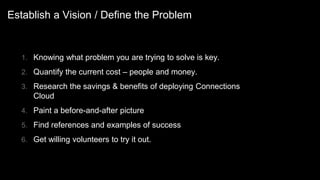
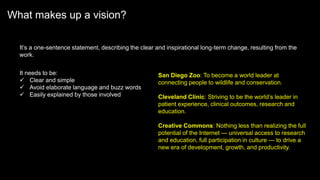
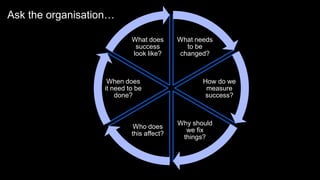
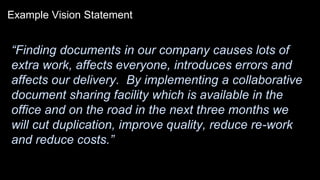
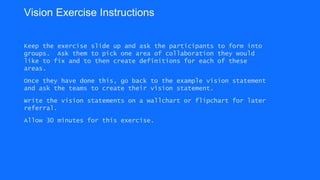

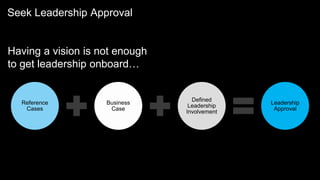

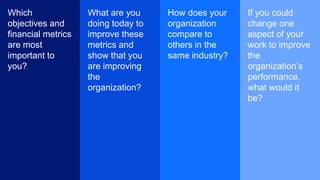
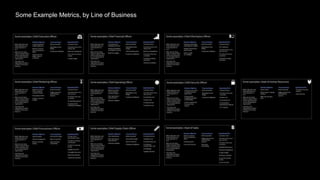
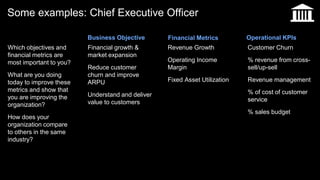
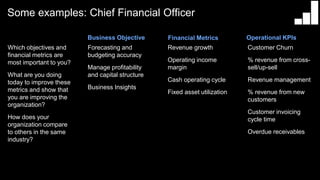
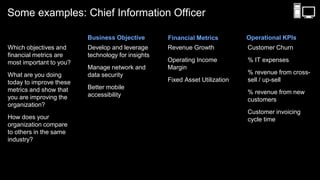
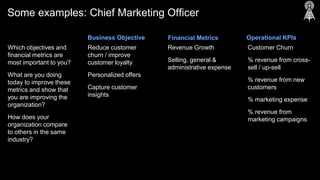
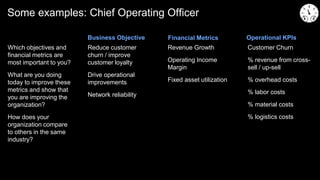
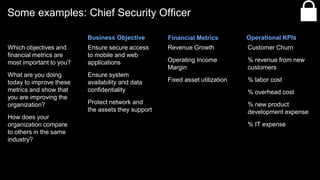
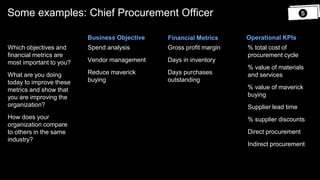
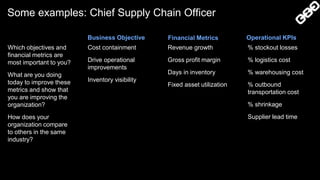
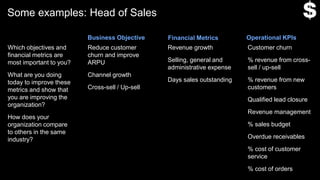
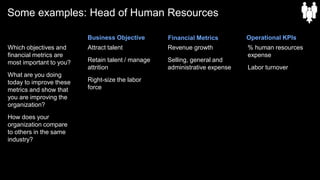
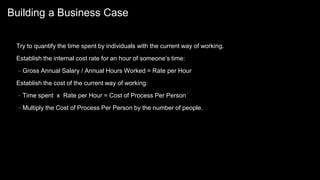
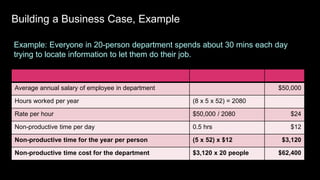
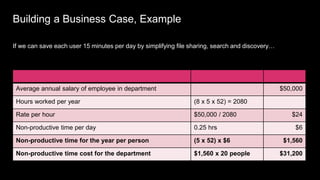
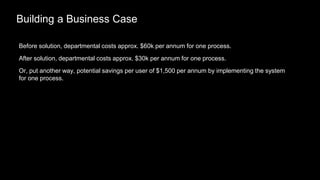
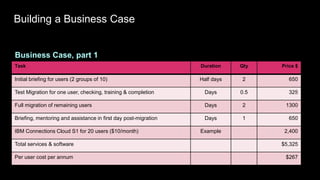
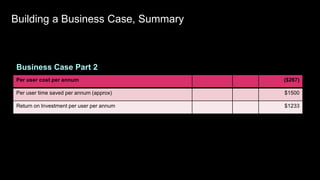
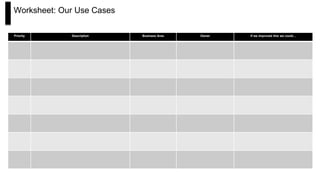
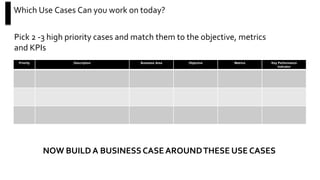
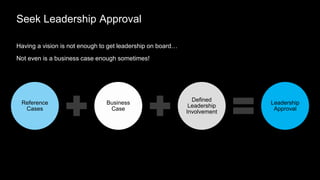


This document provides guidance on establishing priorities and obtaining leadership approval for implementing IBM Connections Cloud. It recommends defining the problem, quantifying current costs, researching savings and benefits, and finding examples of success. It also discusses creating a clear and inspirational vision statement, and conducting an exercise to define specific problems to address. The document outlines questions to ask leadership about objectives, metrics, and comparisons to others. It provides examples of metrics for different roles. Finally, it provides instructions for building a business case by quantifying current costs and potential savings.


