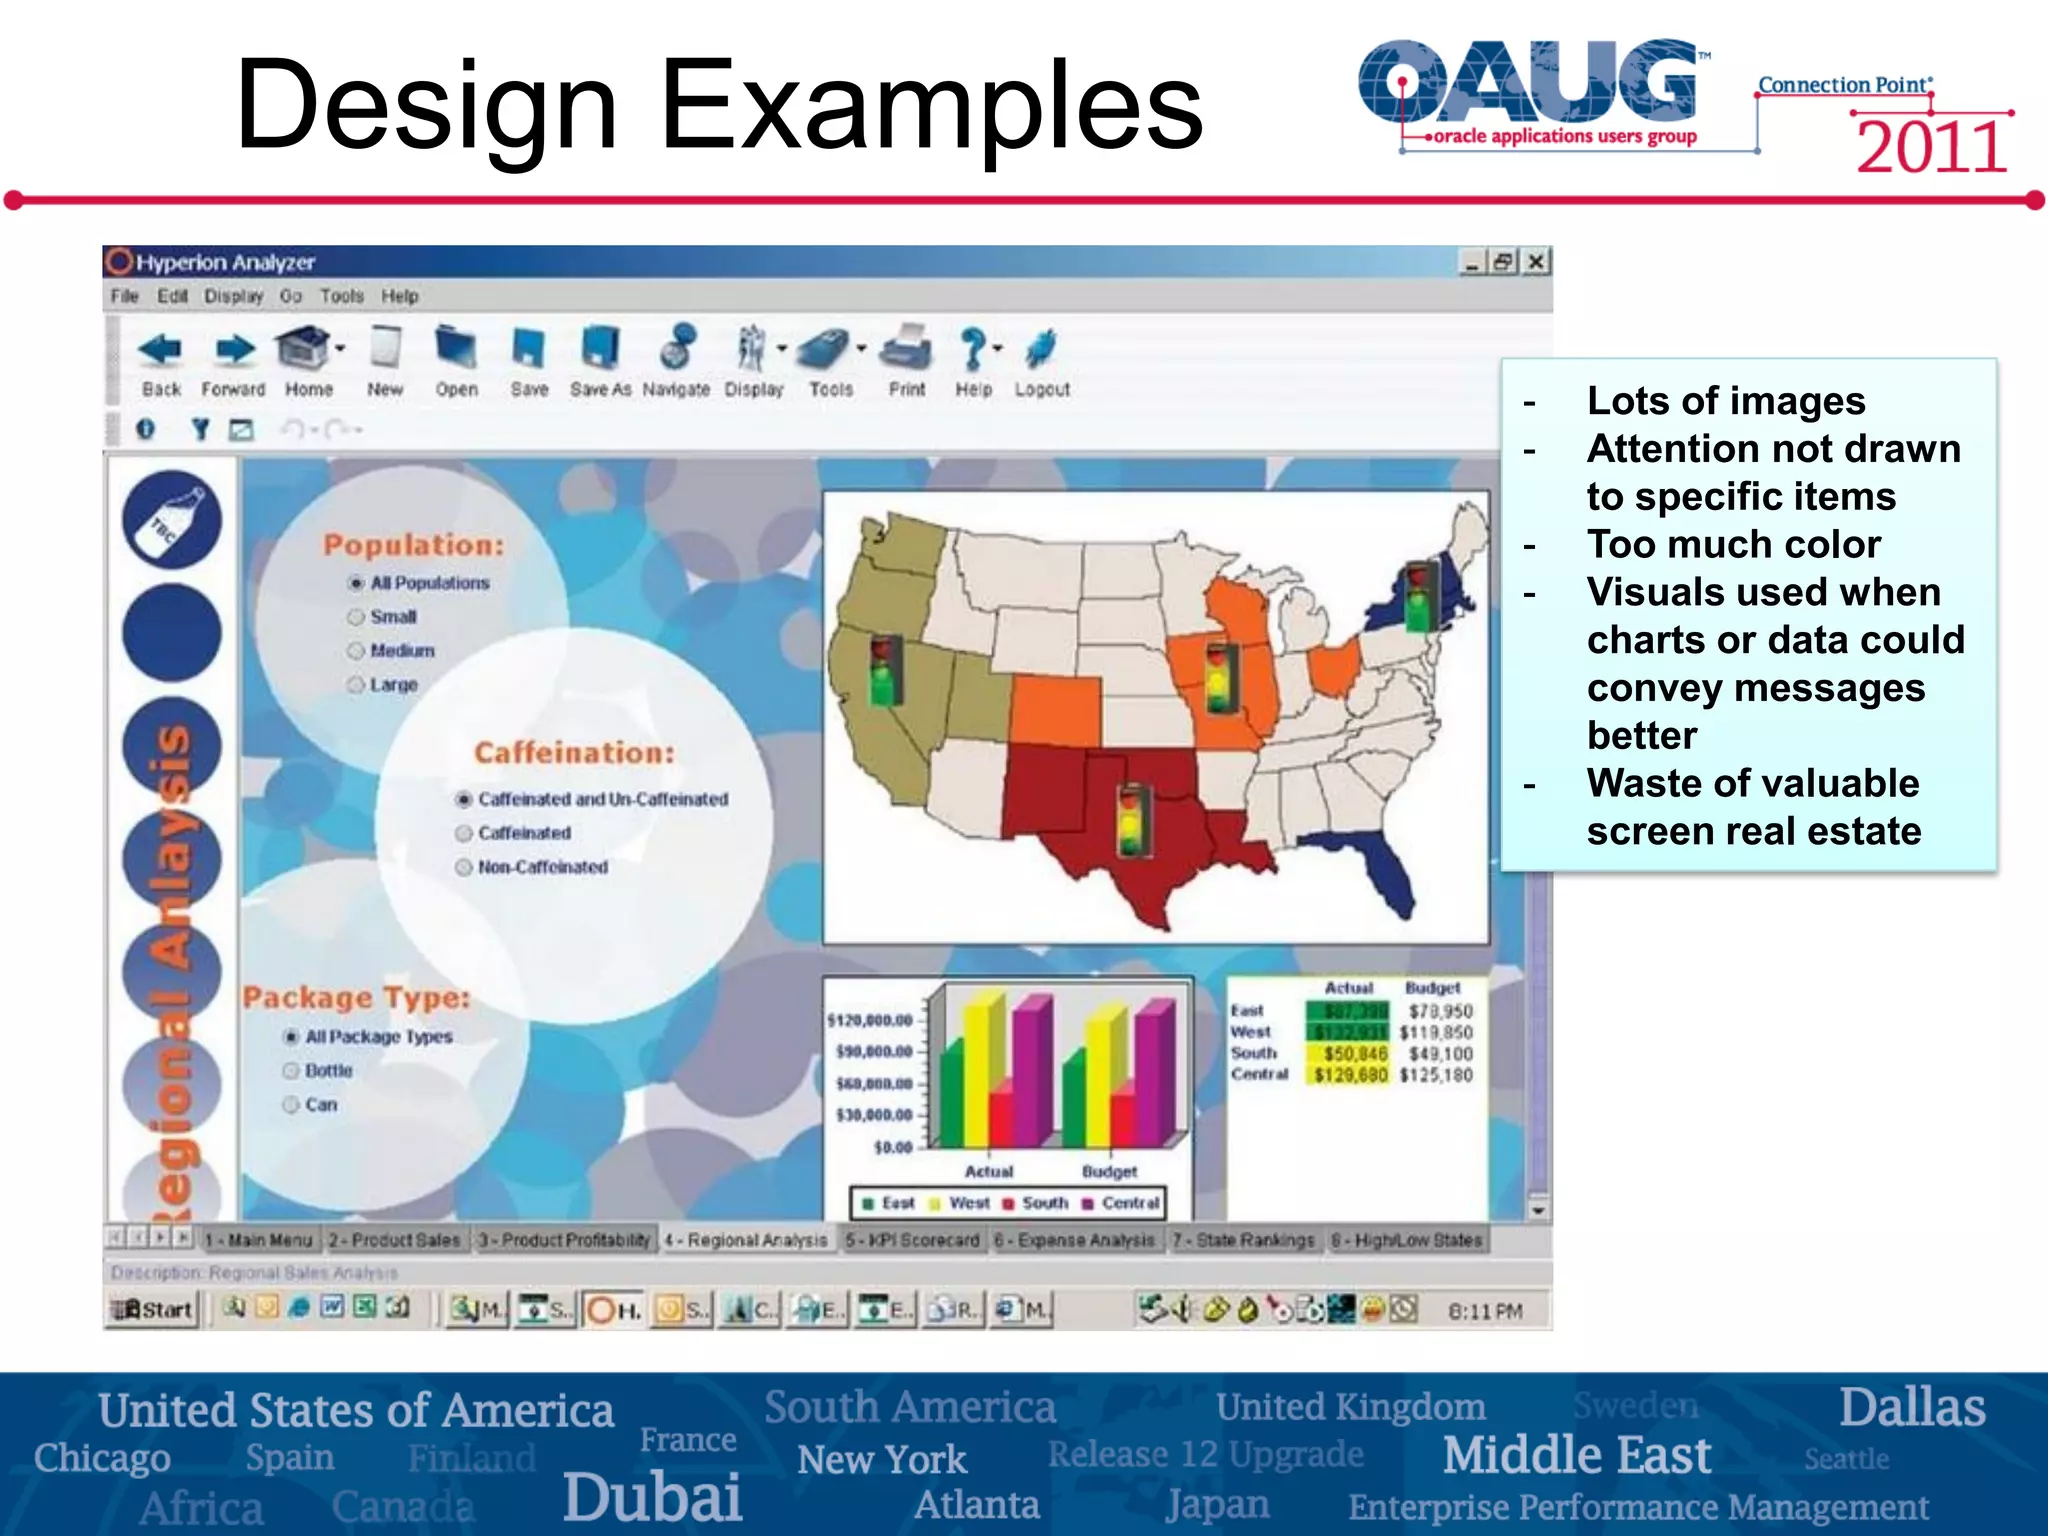
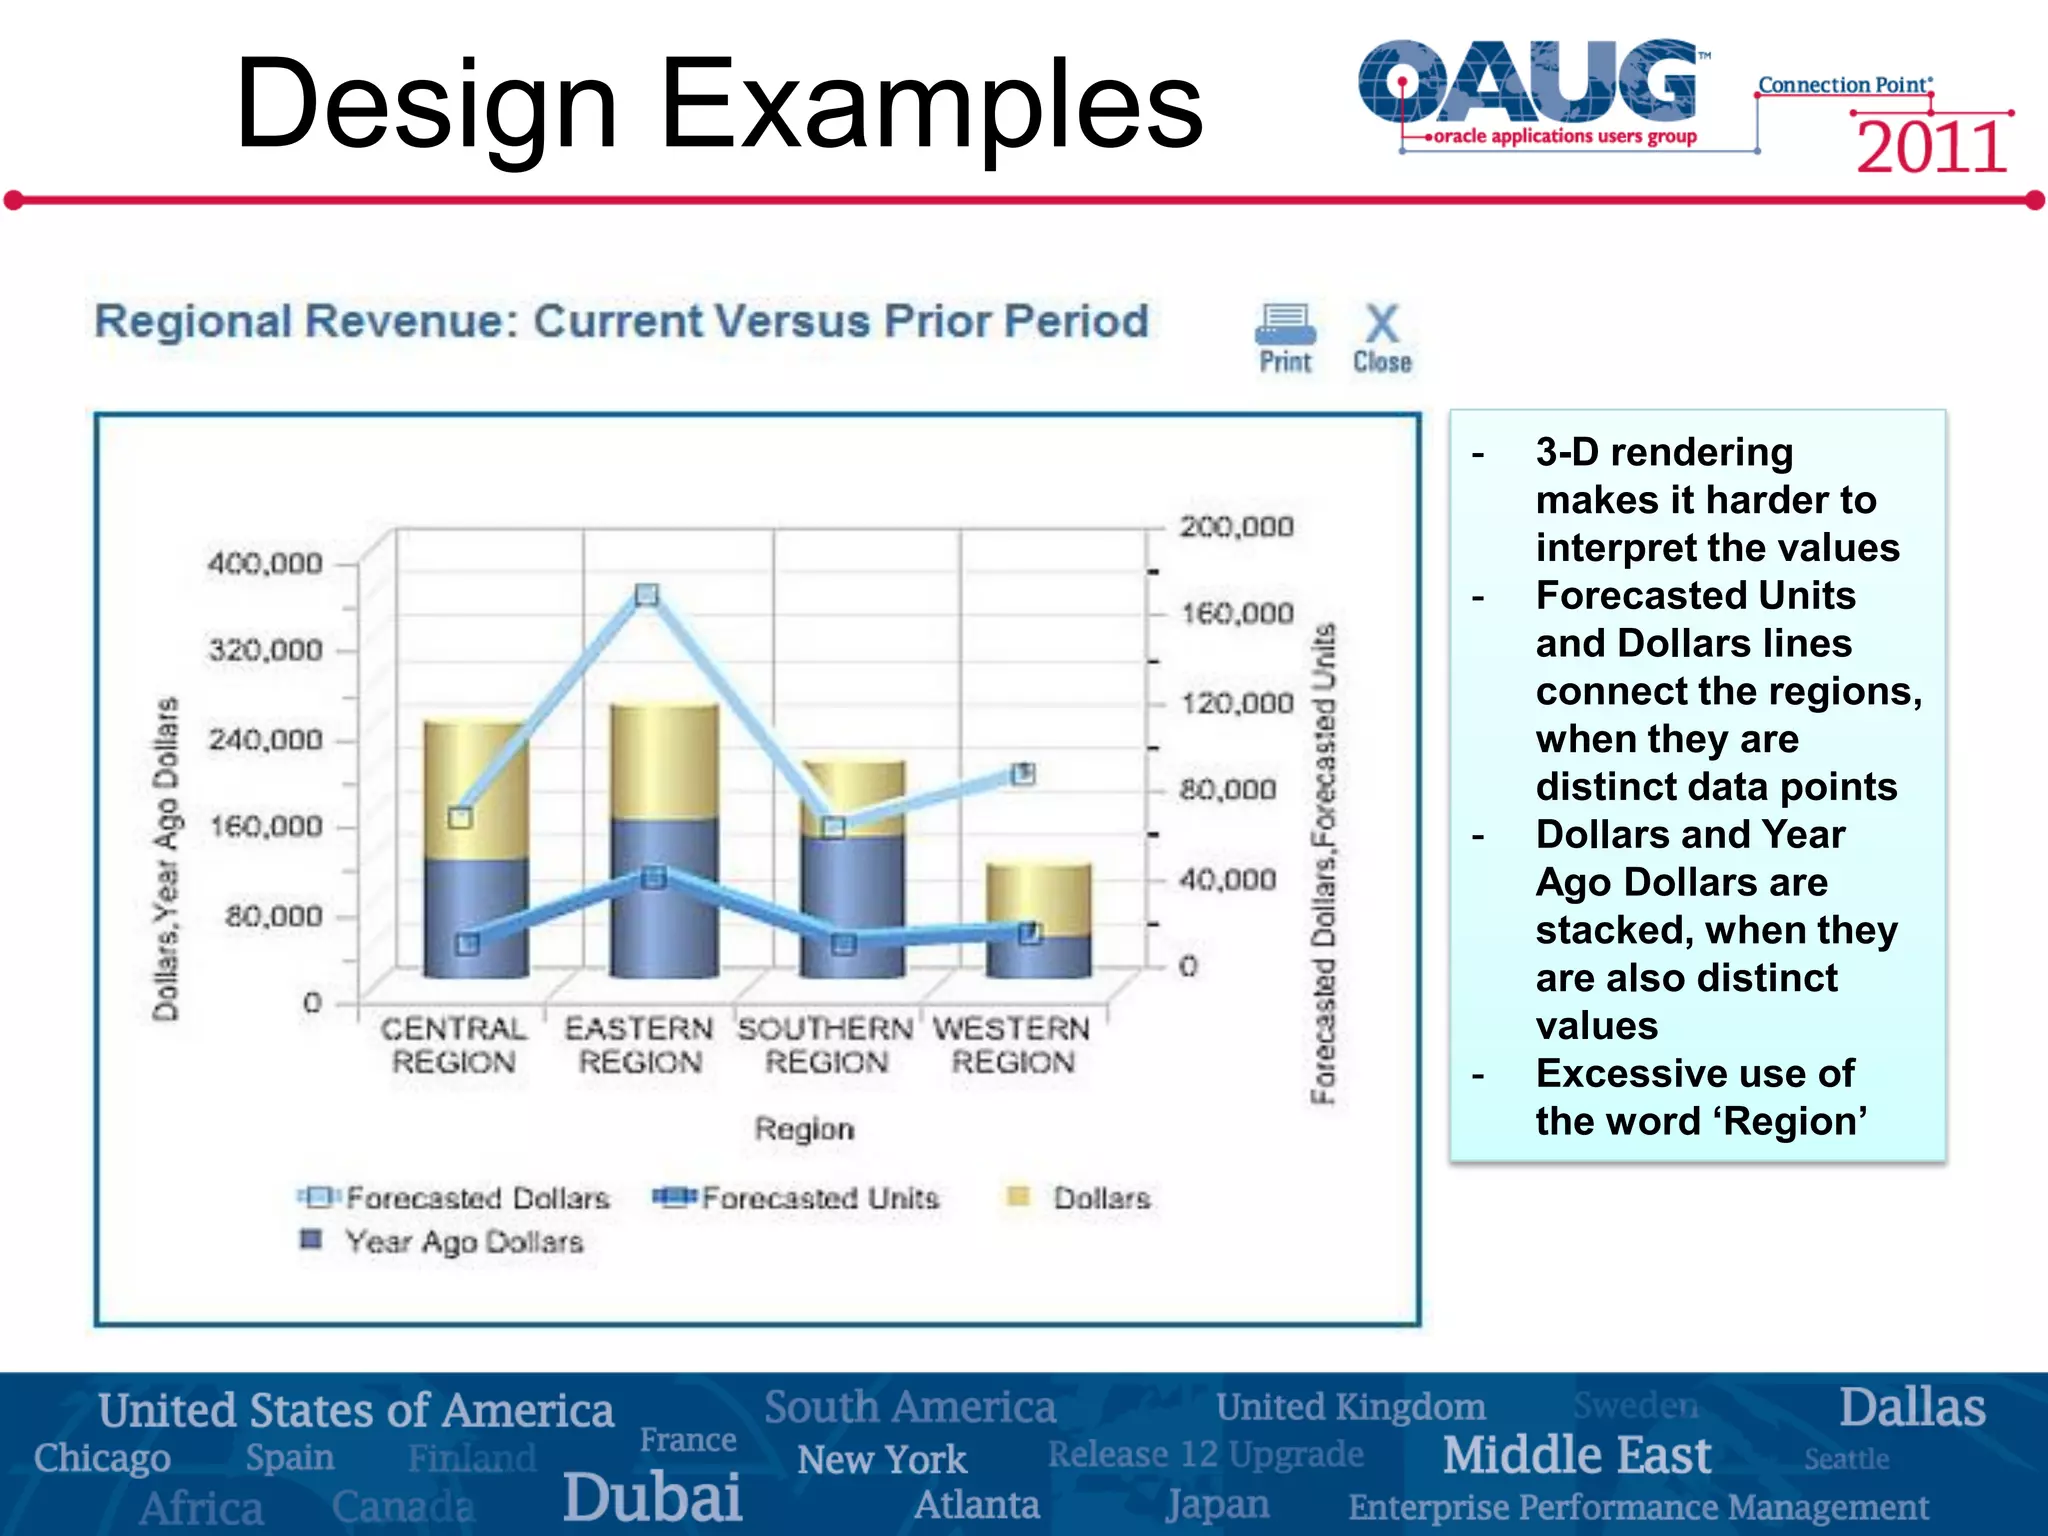
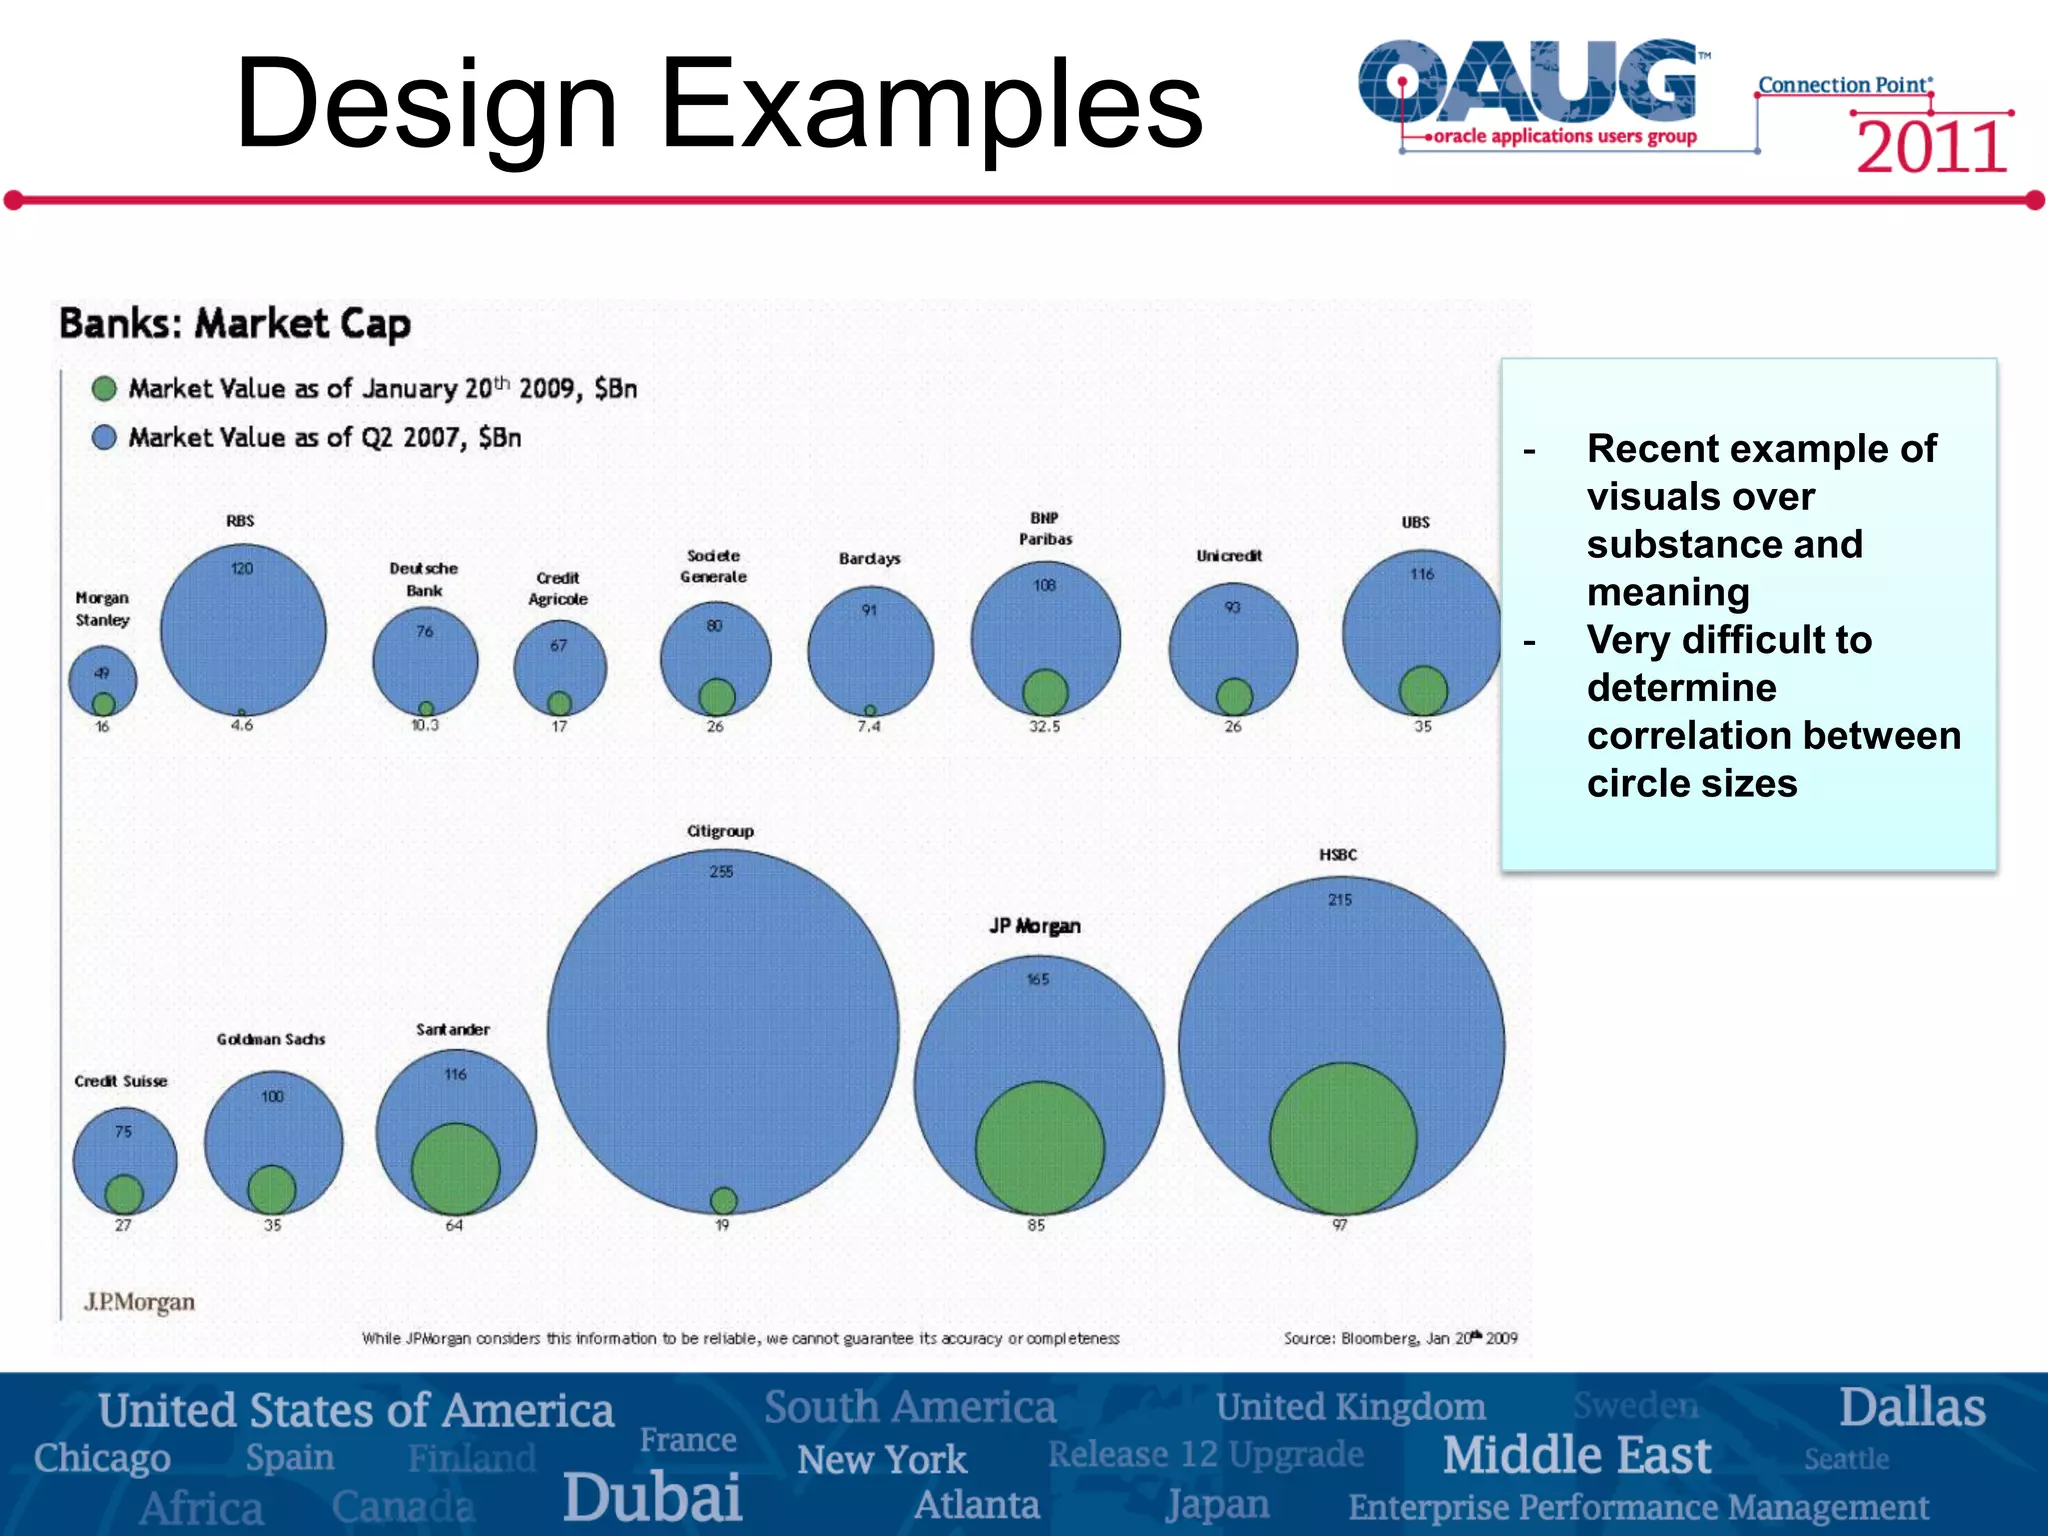
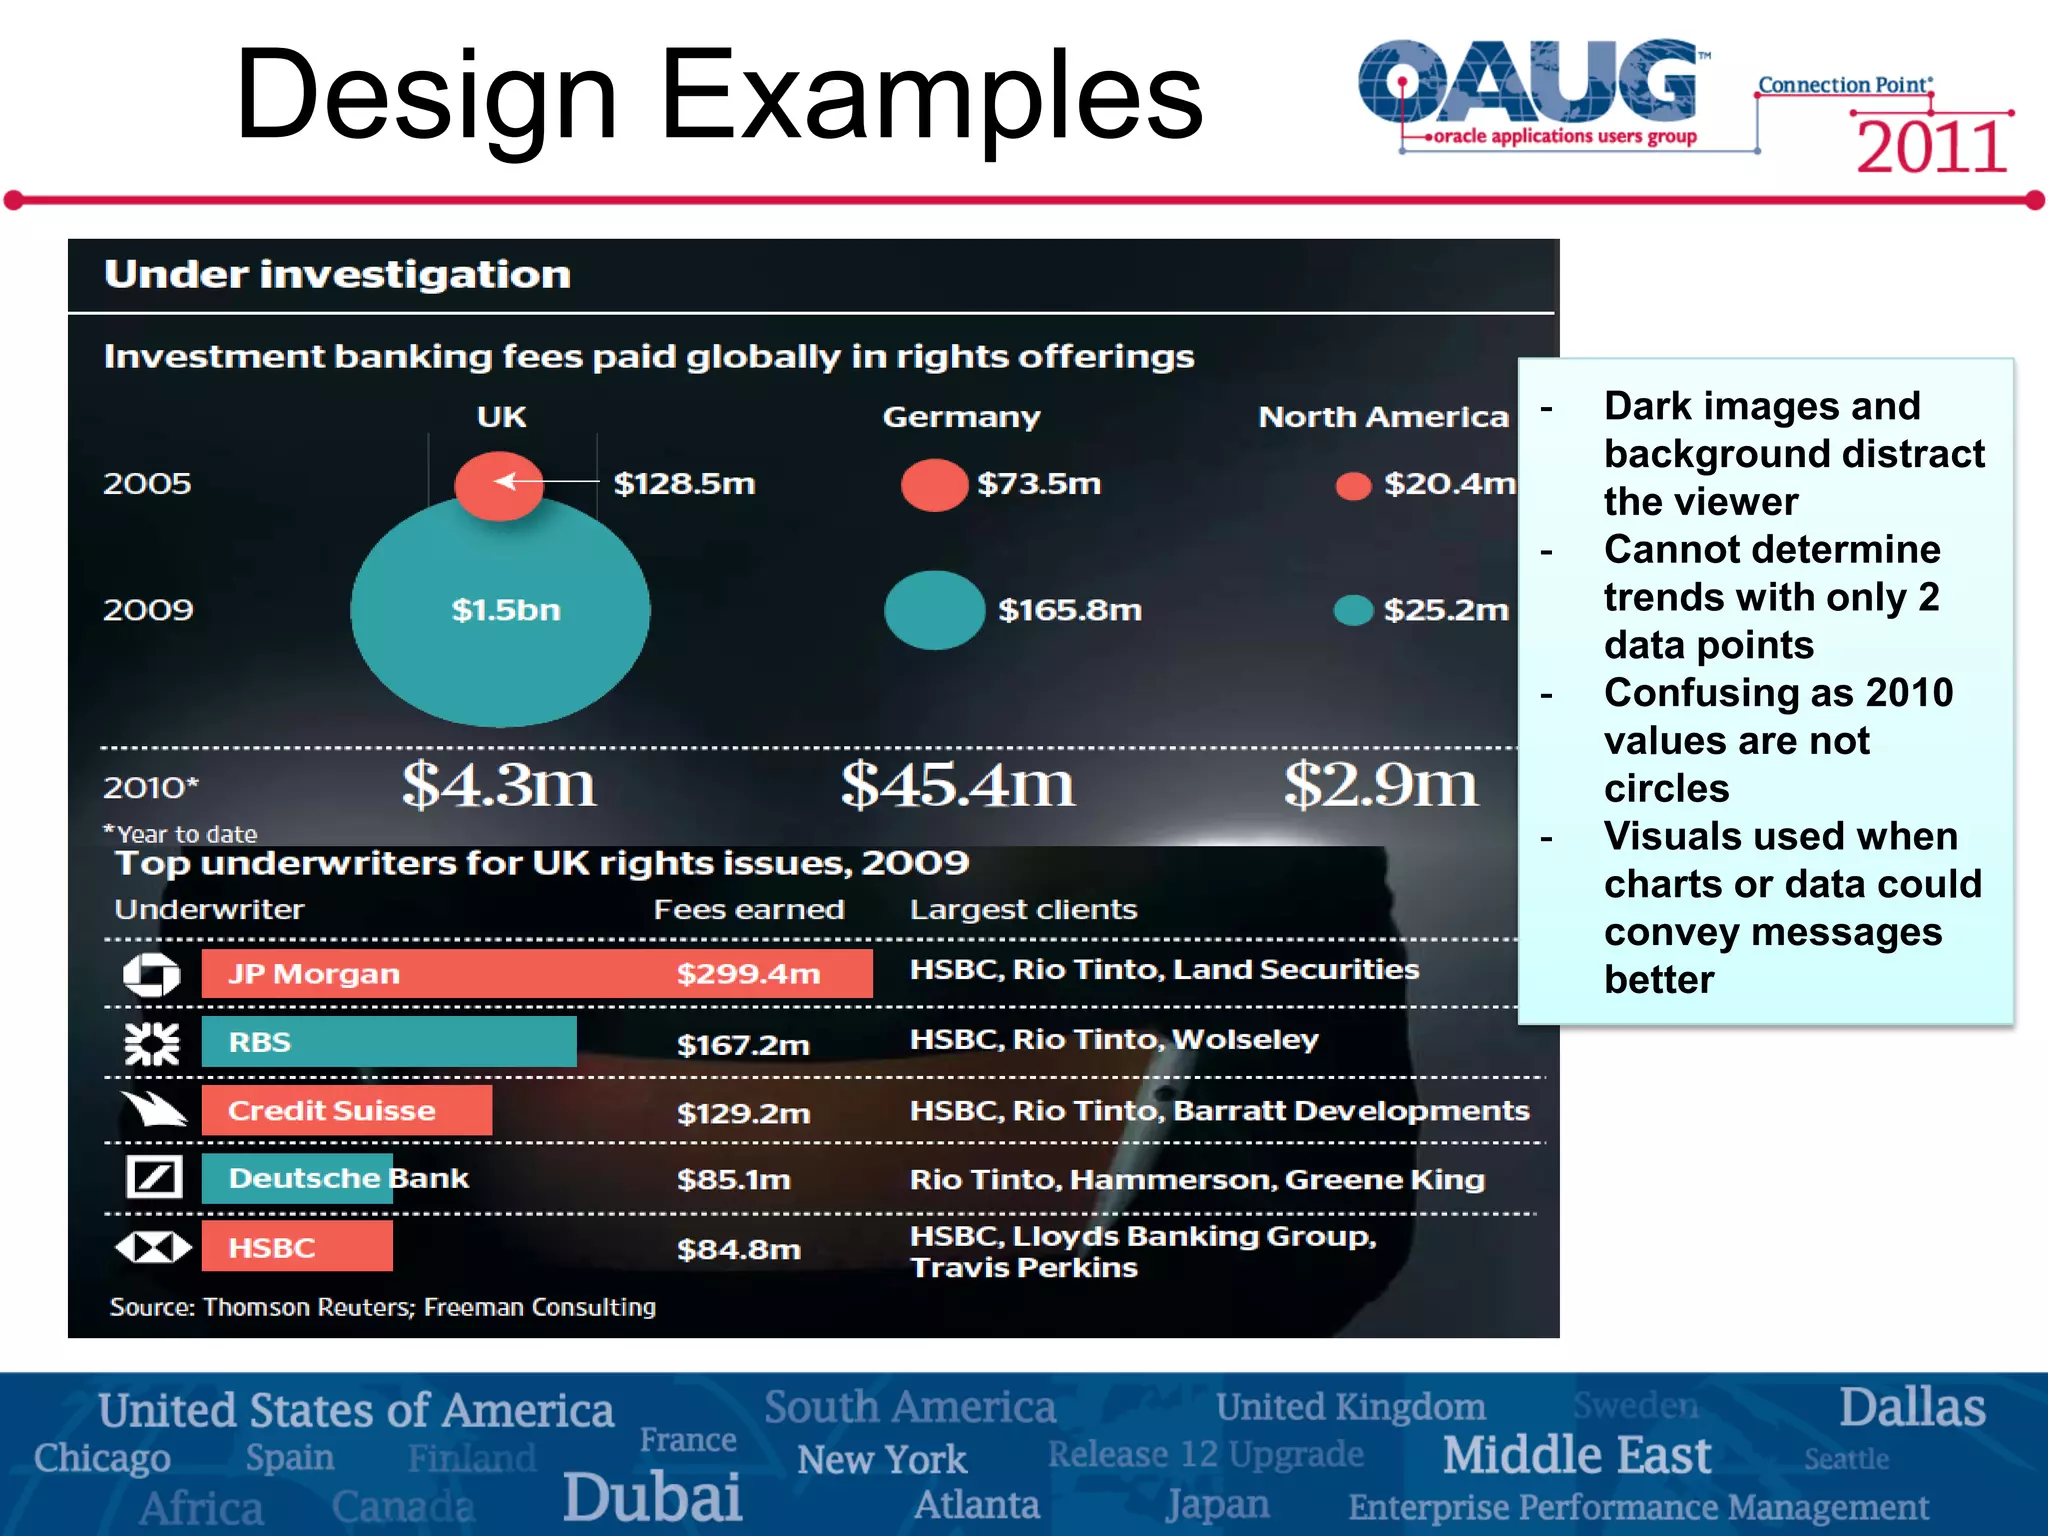
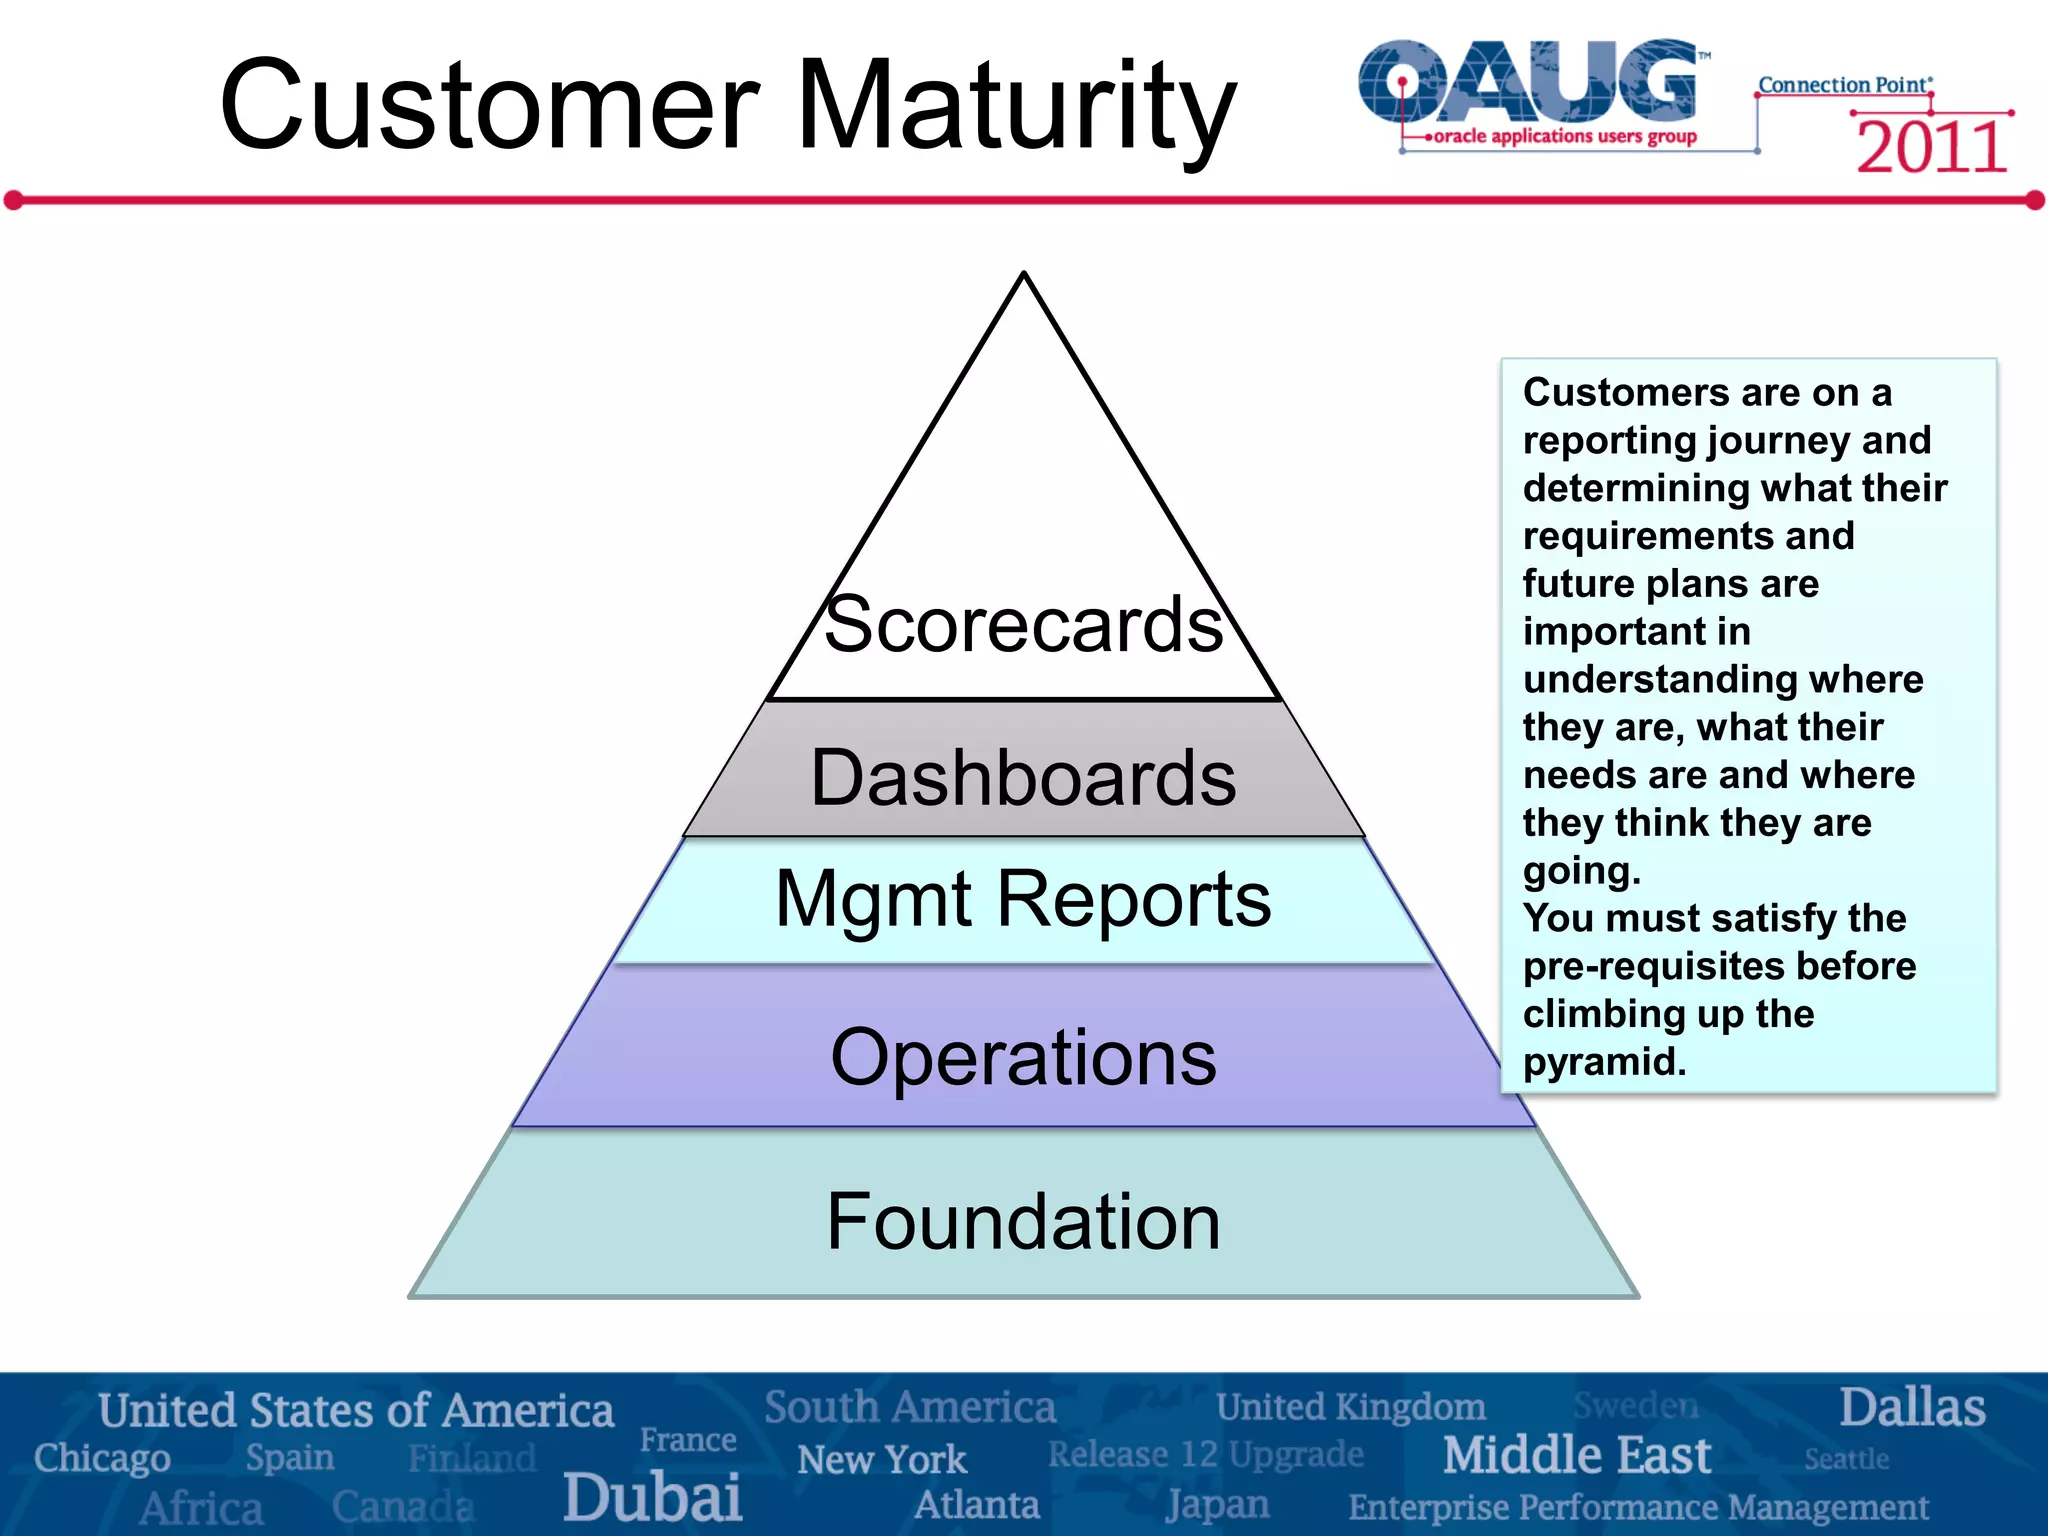
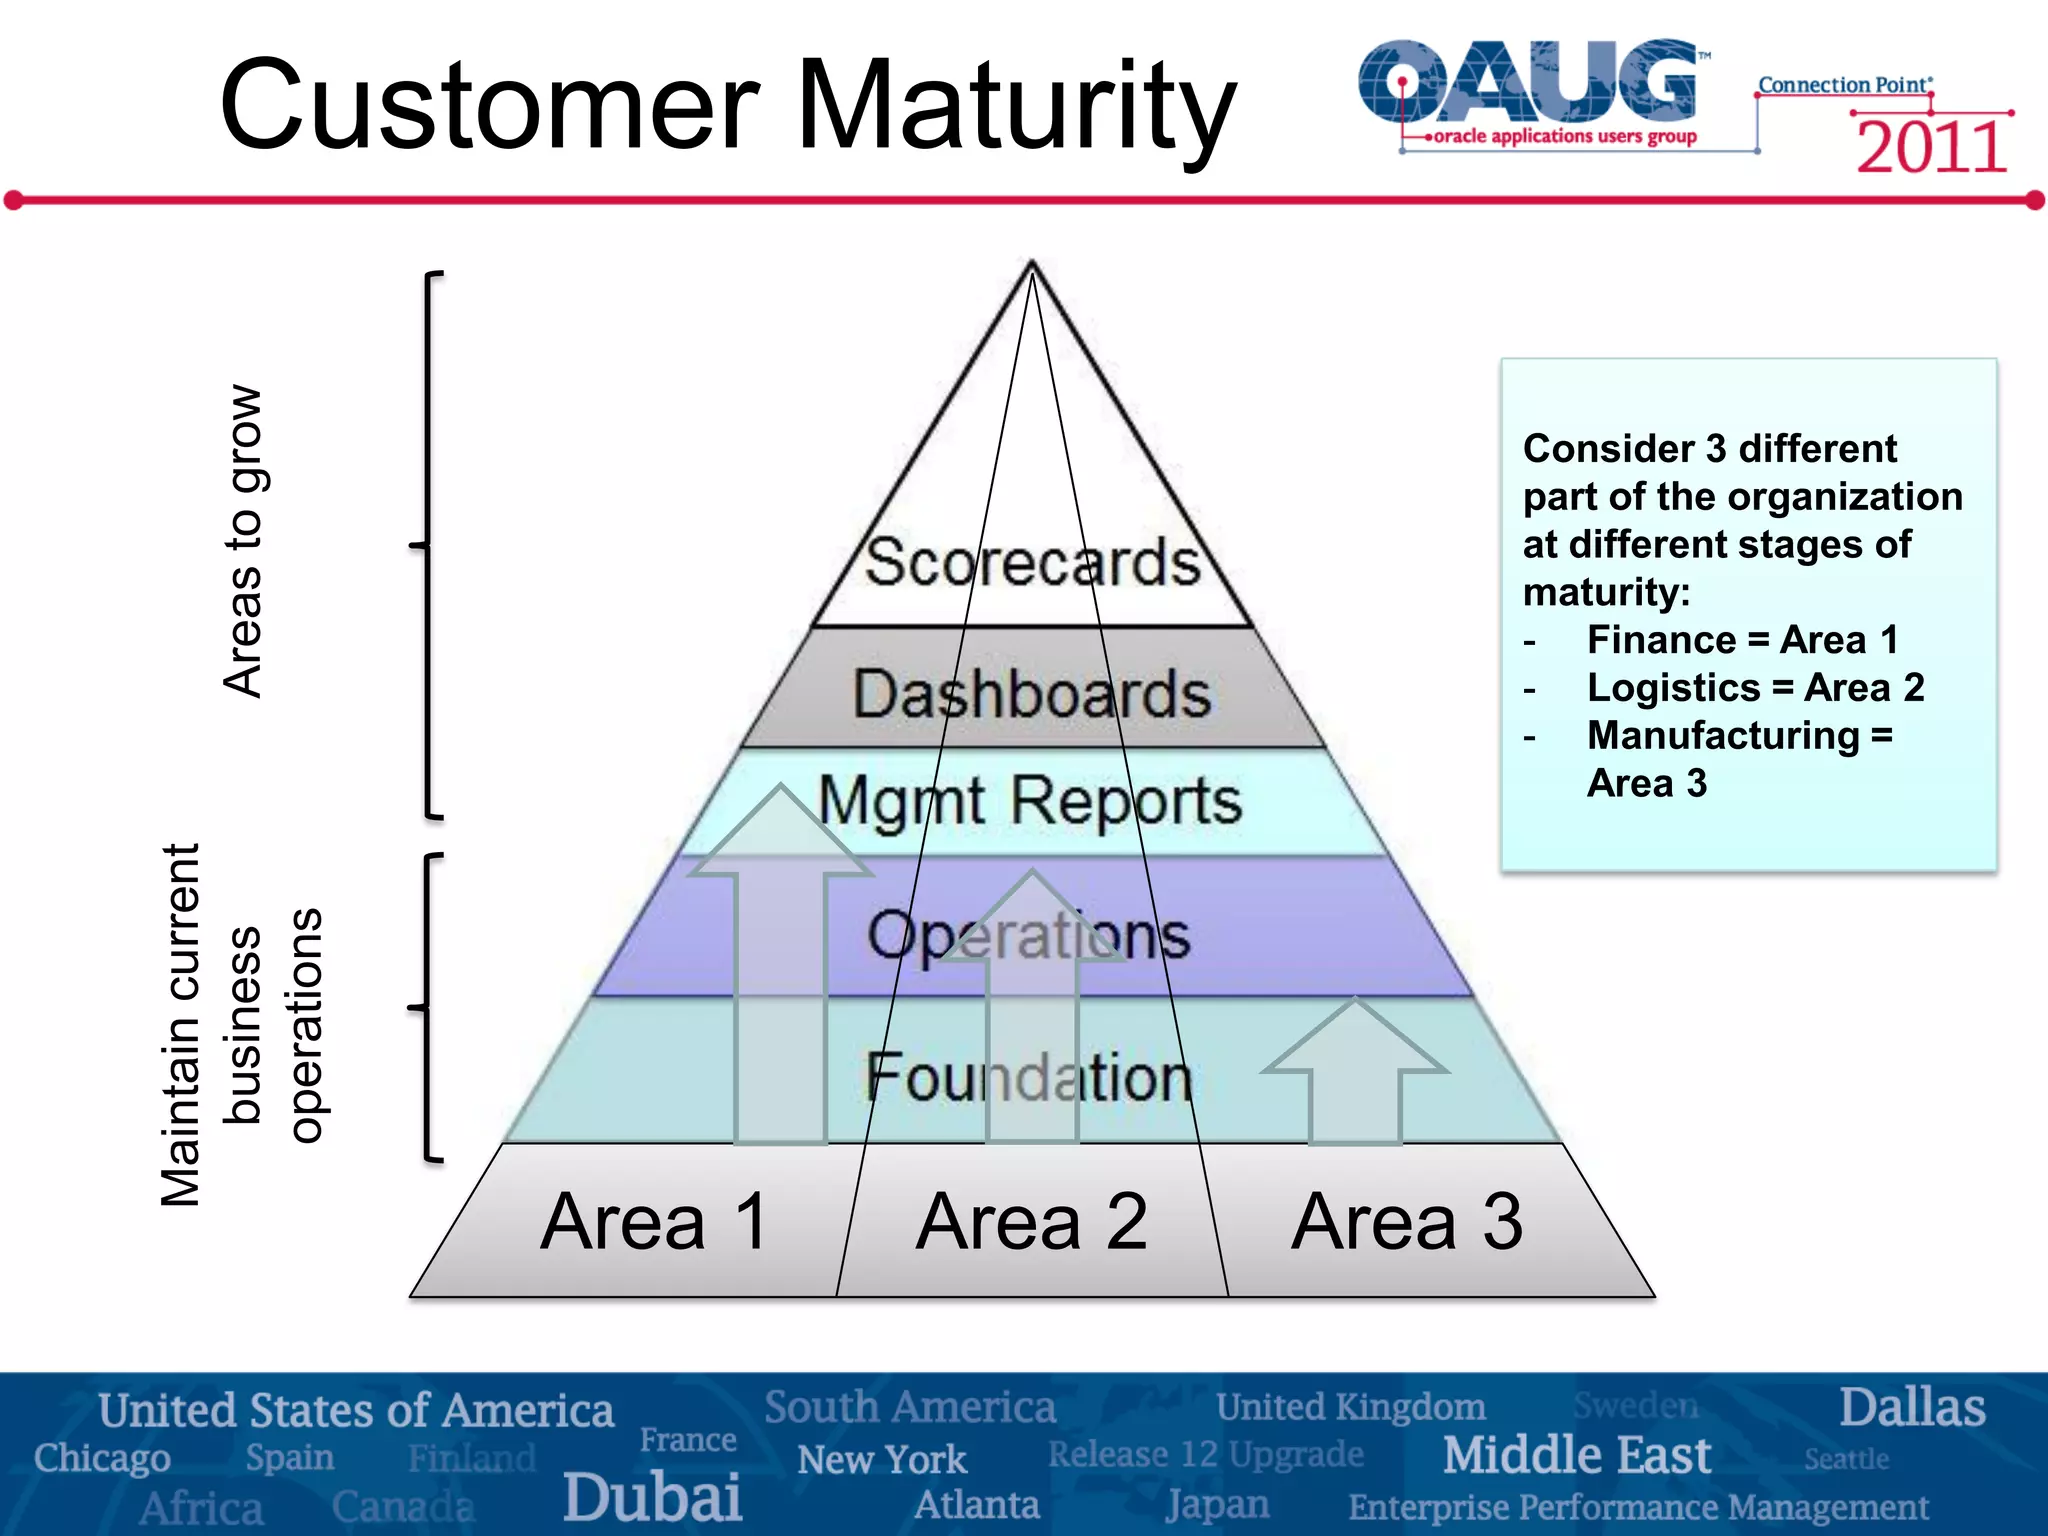
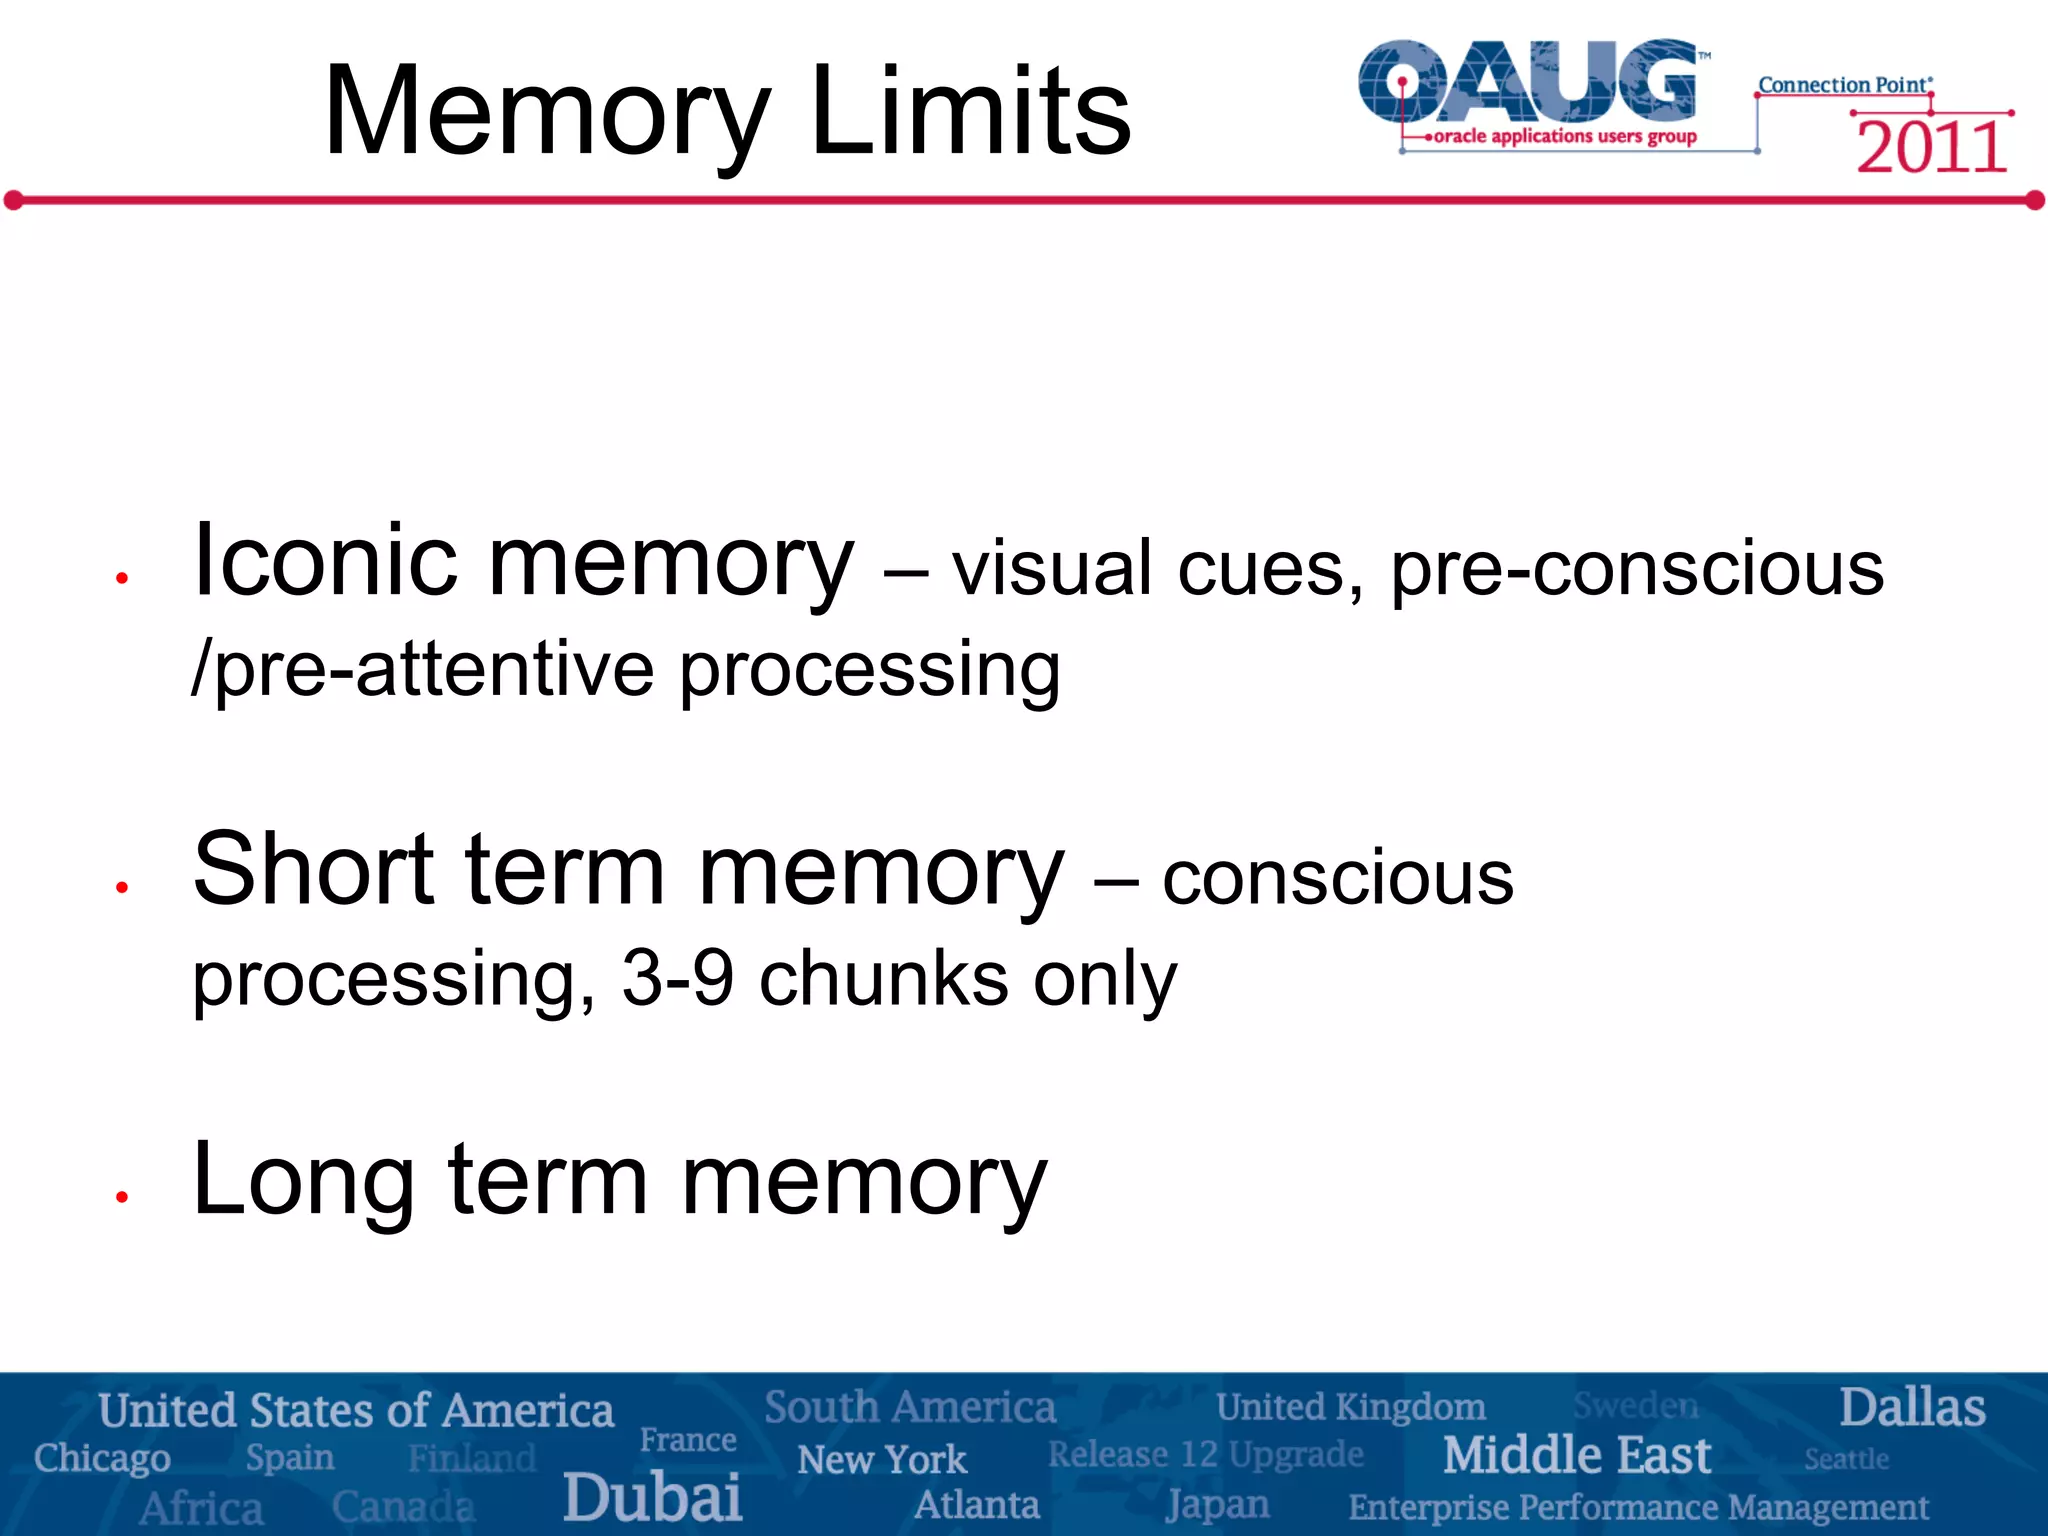
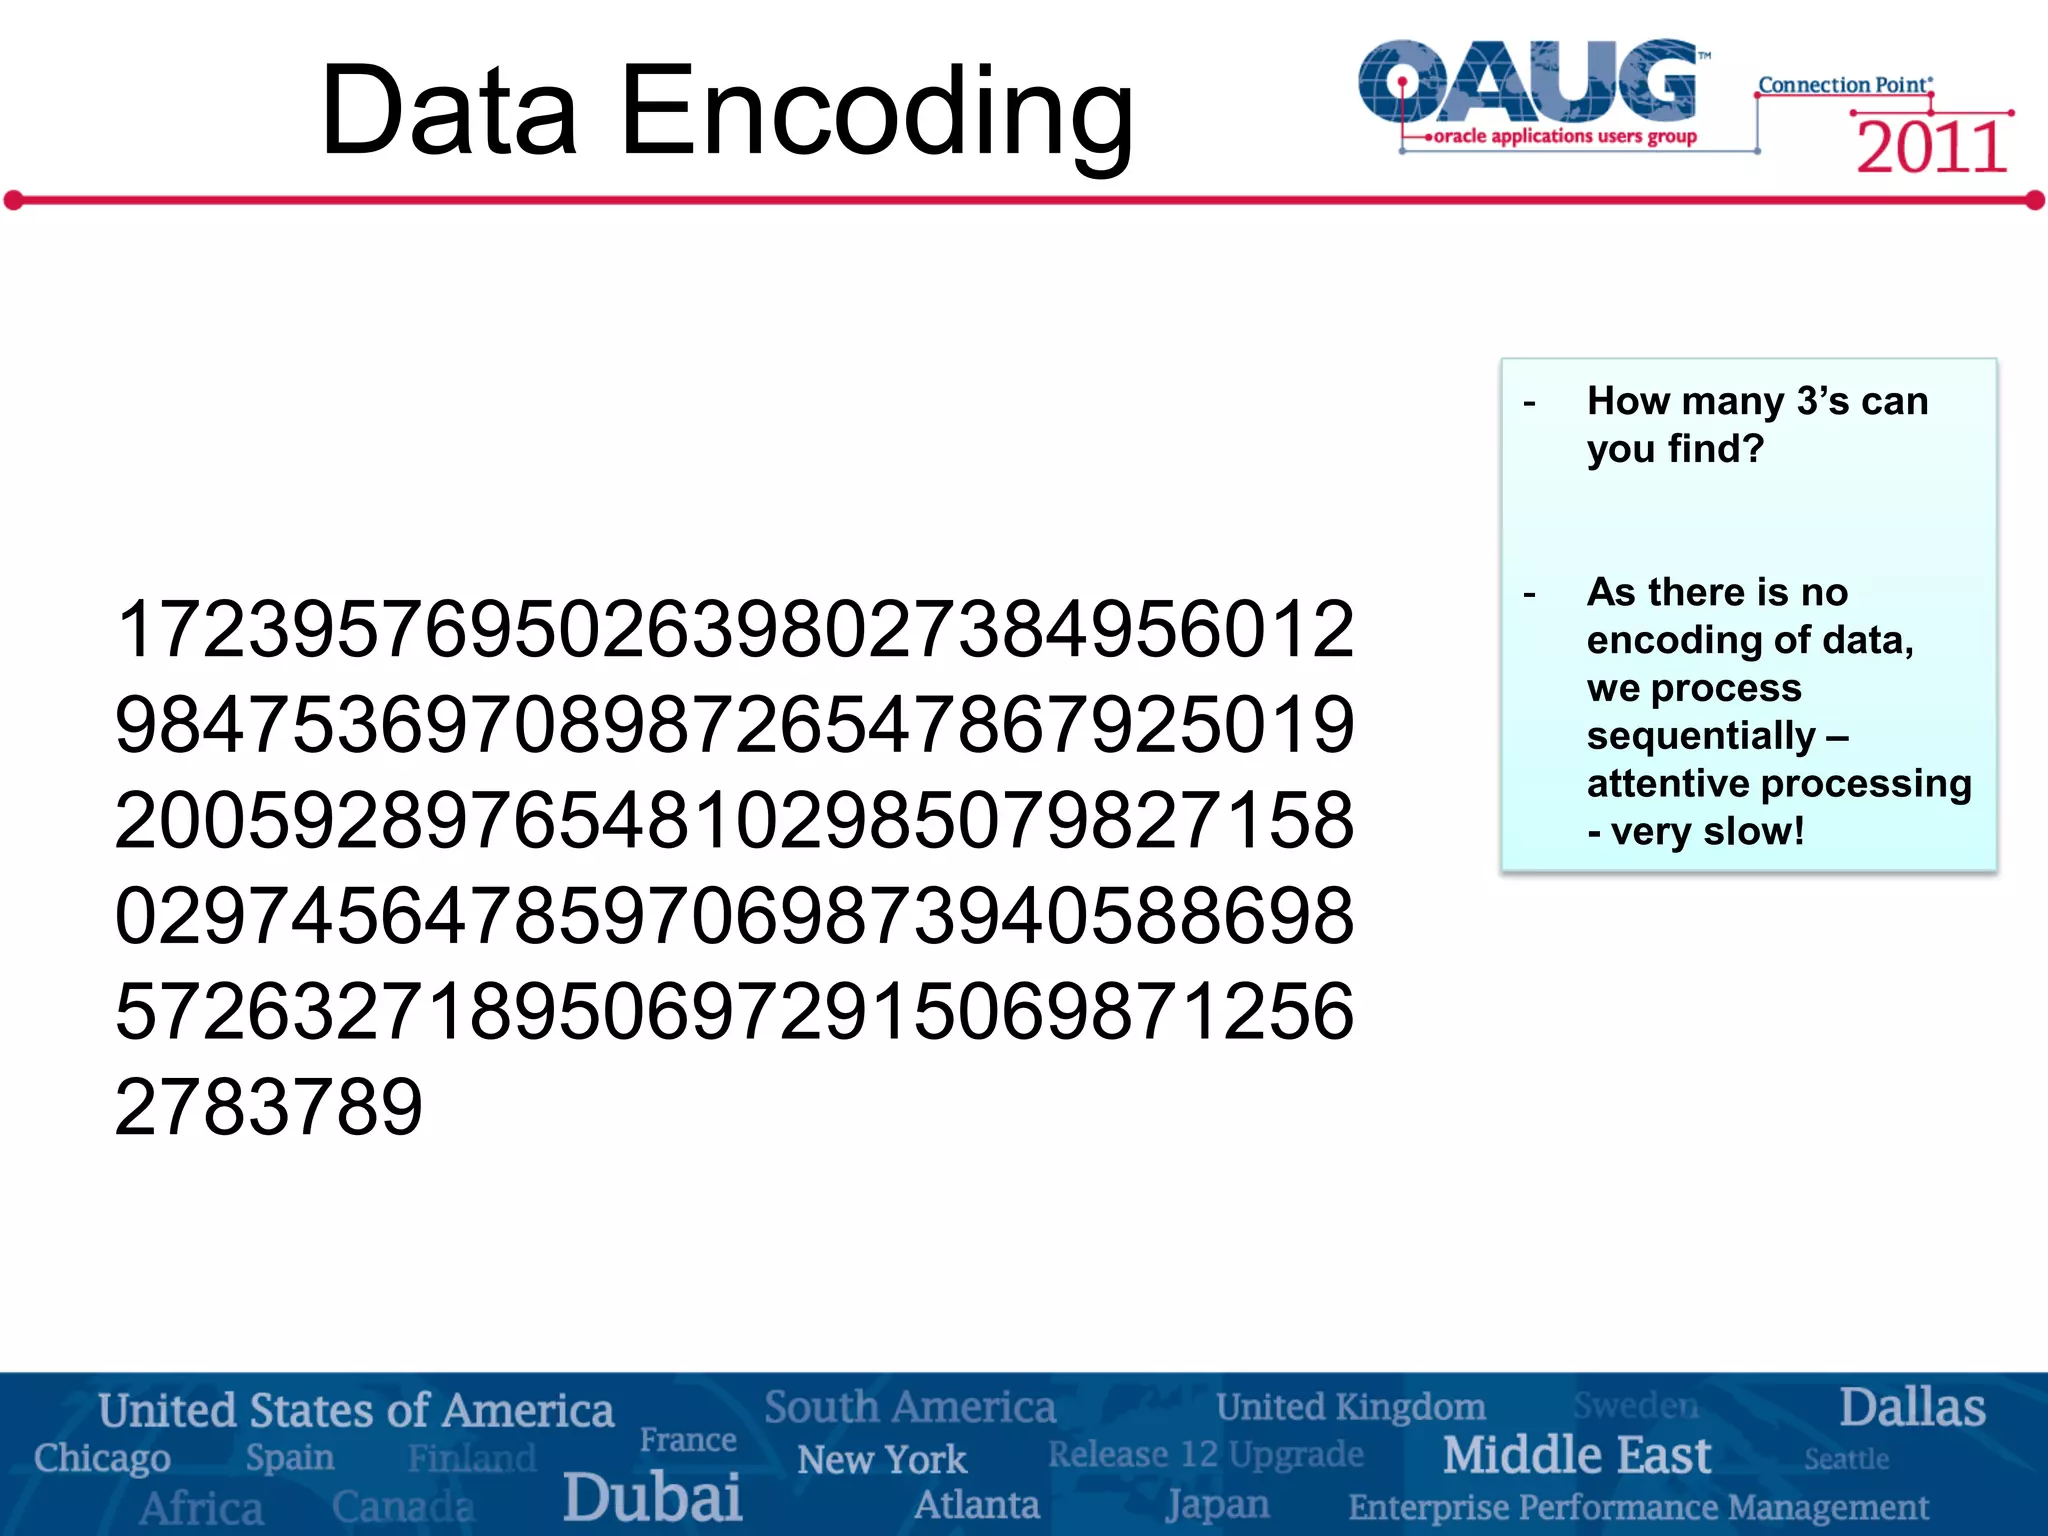
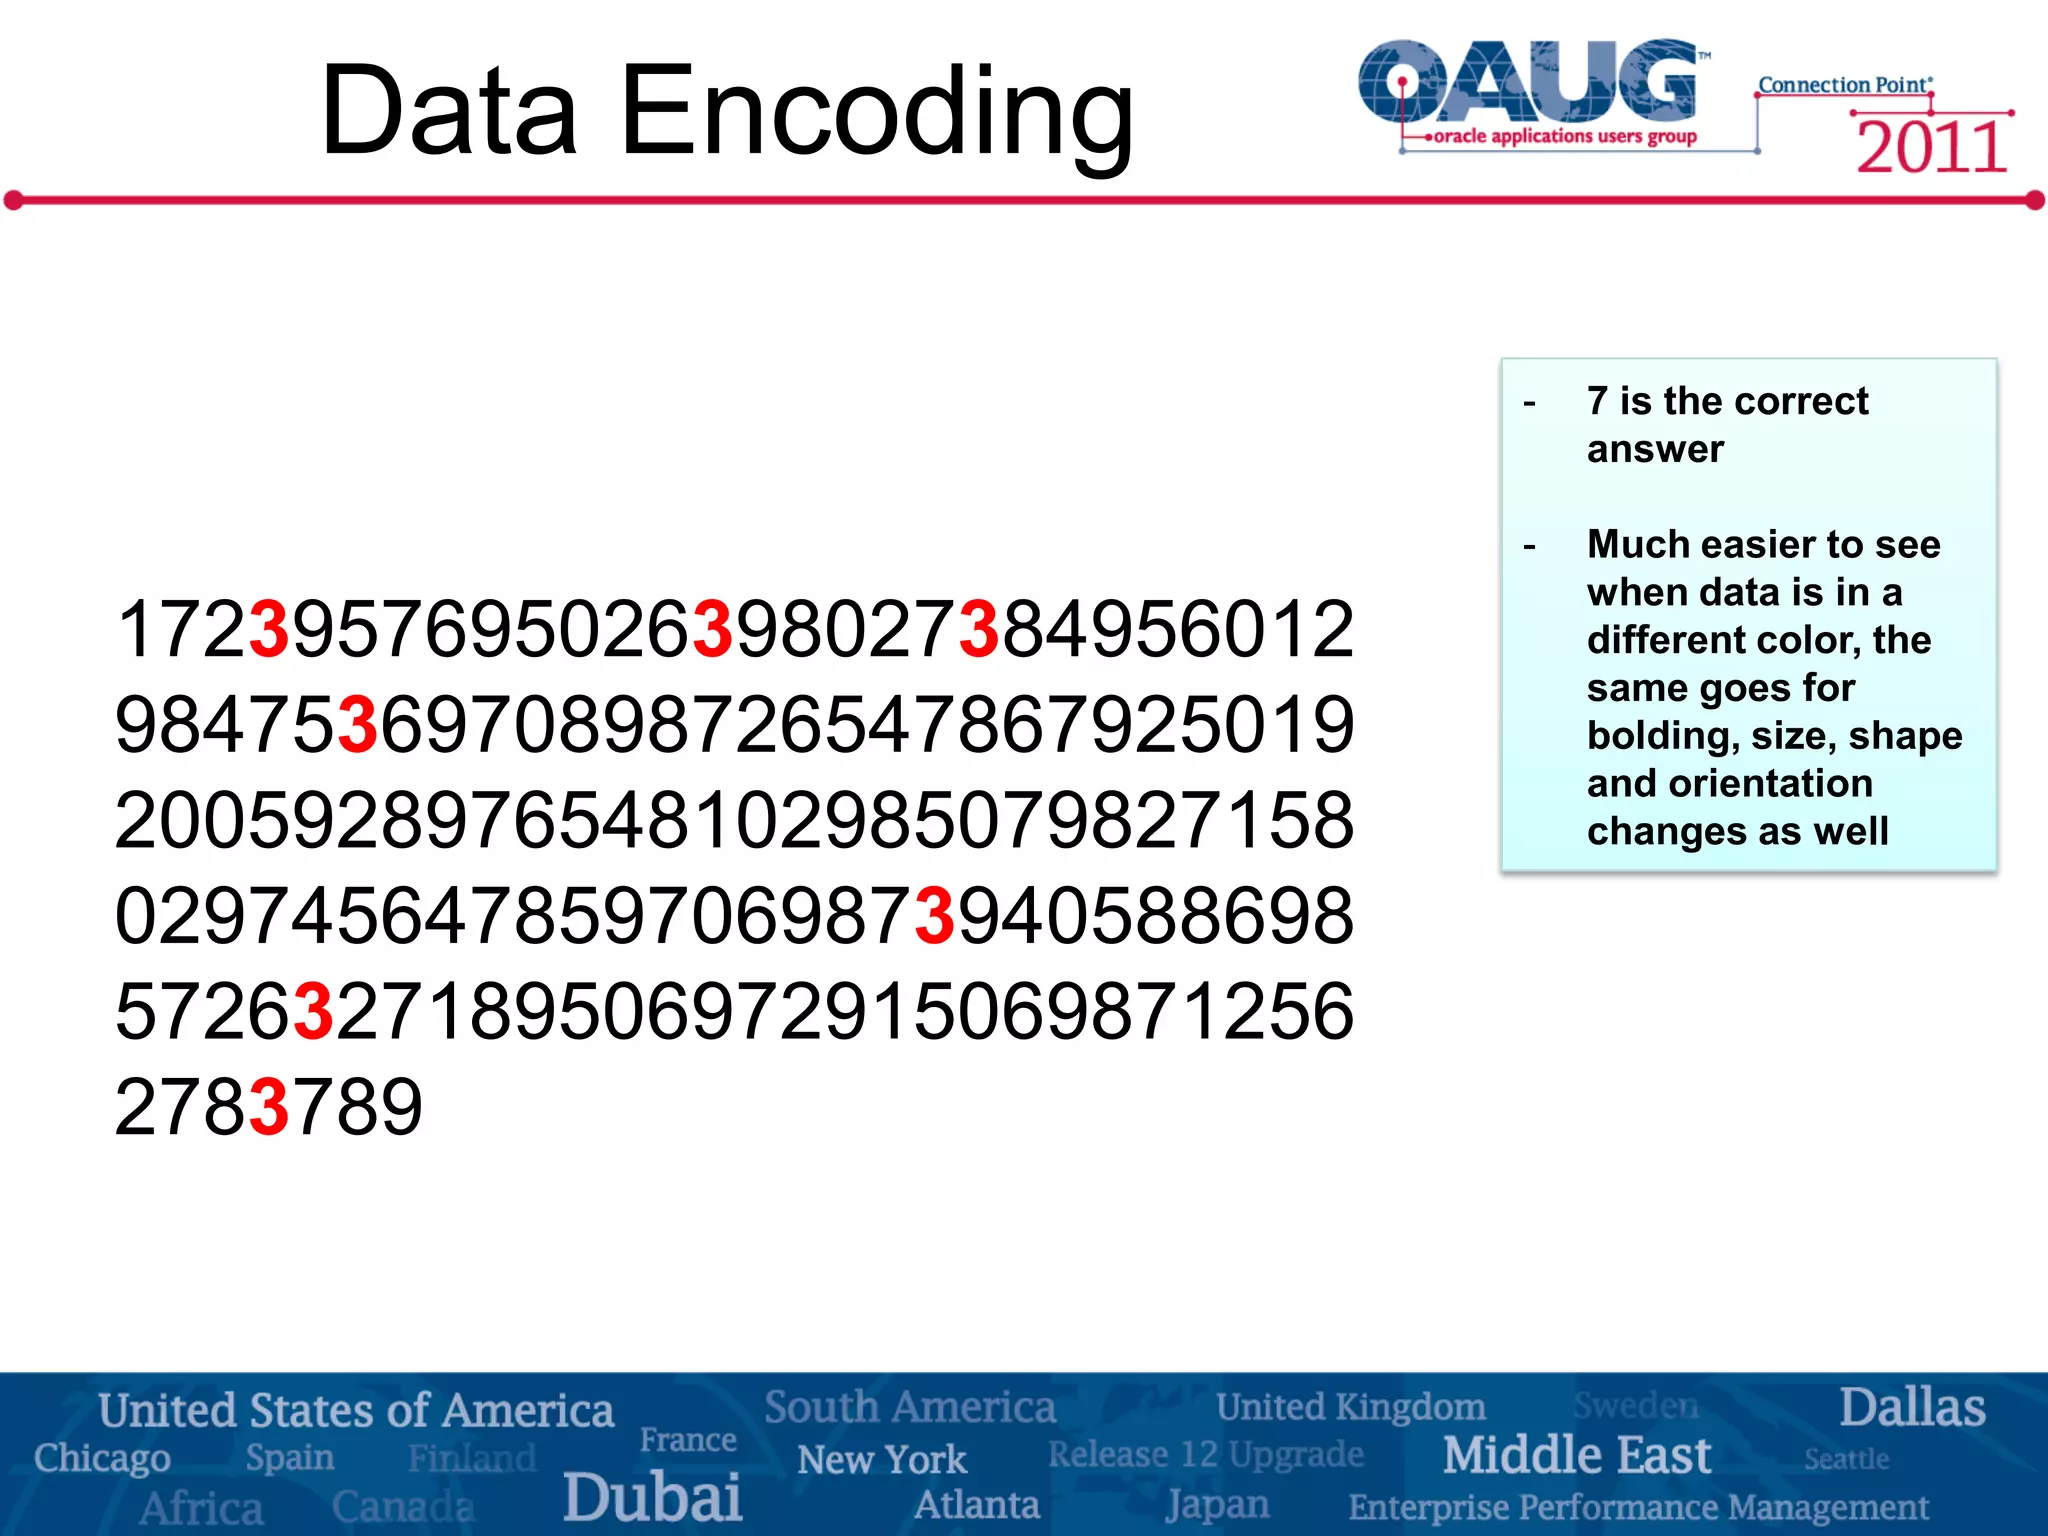
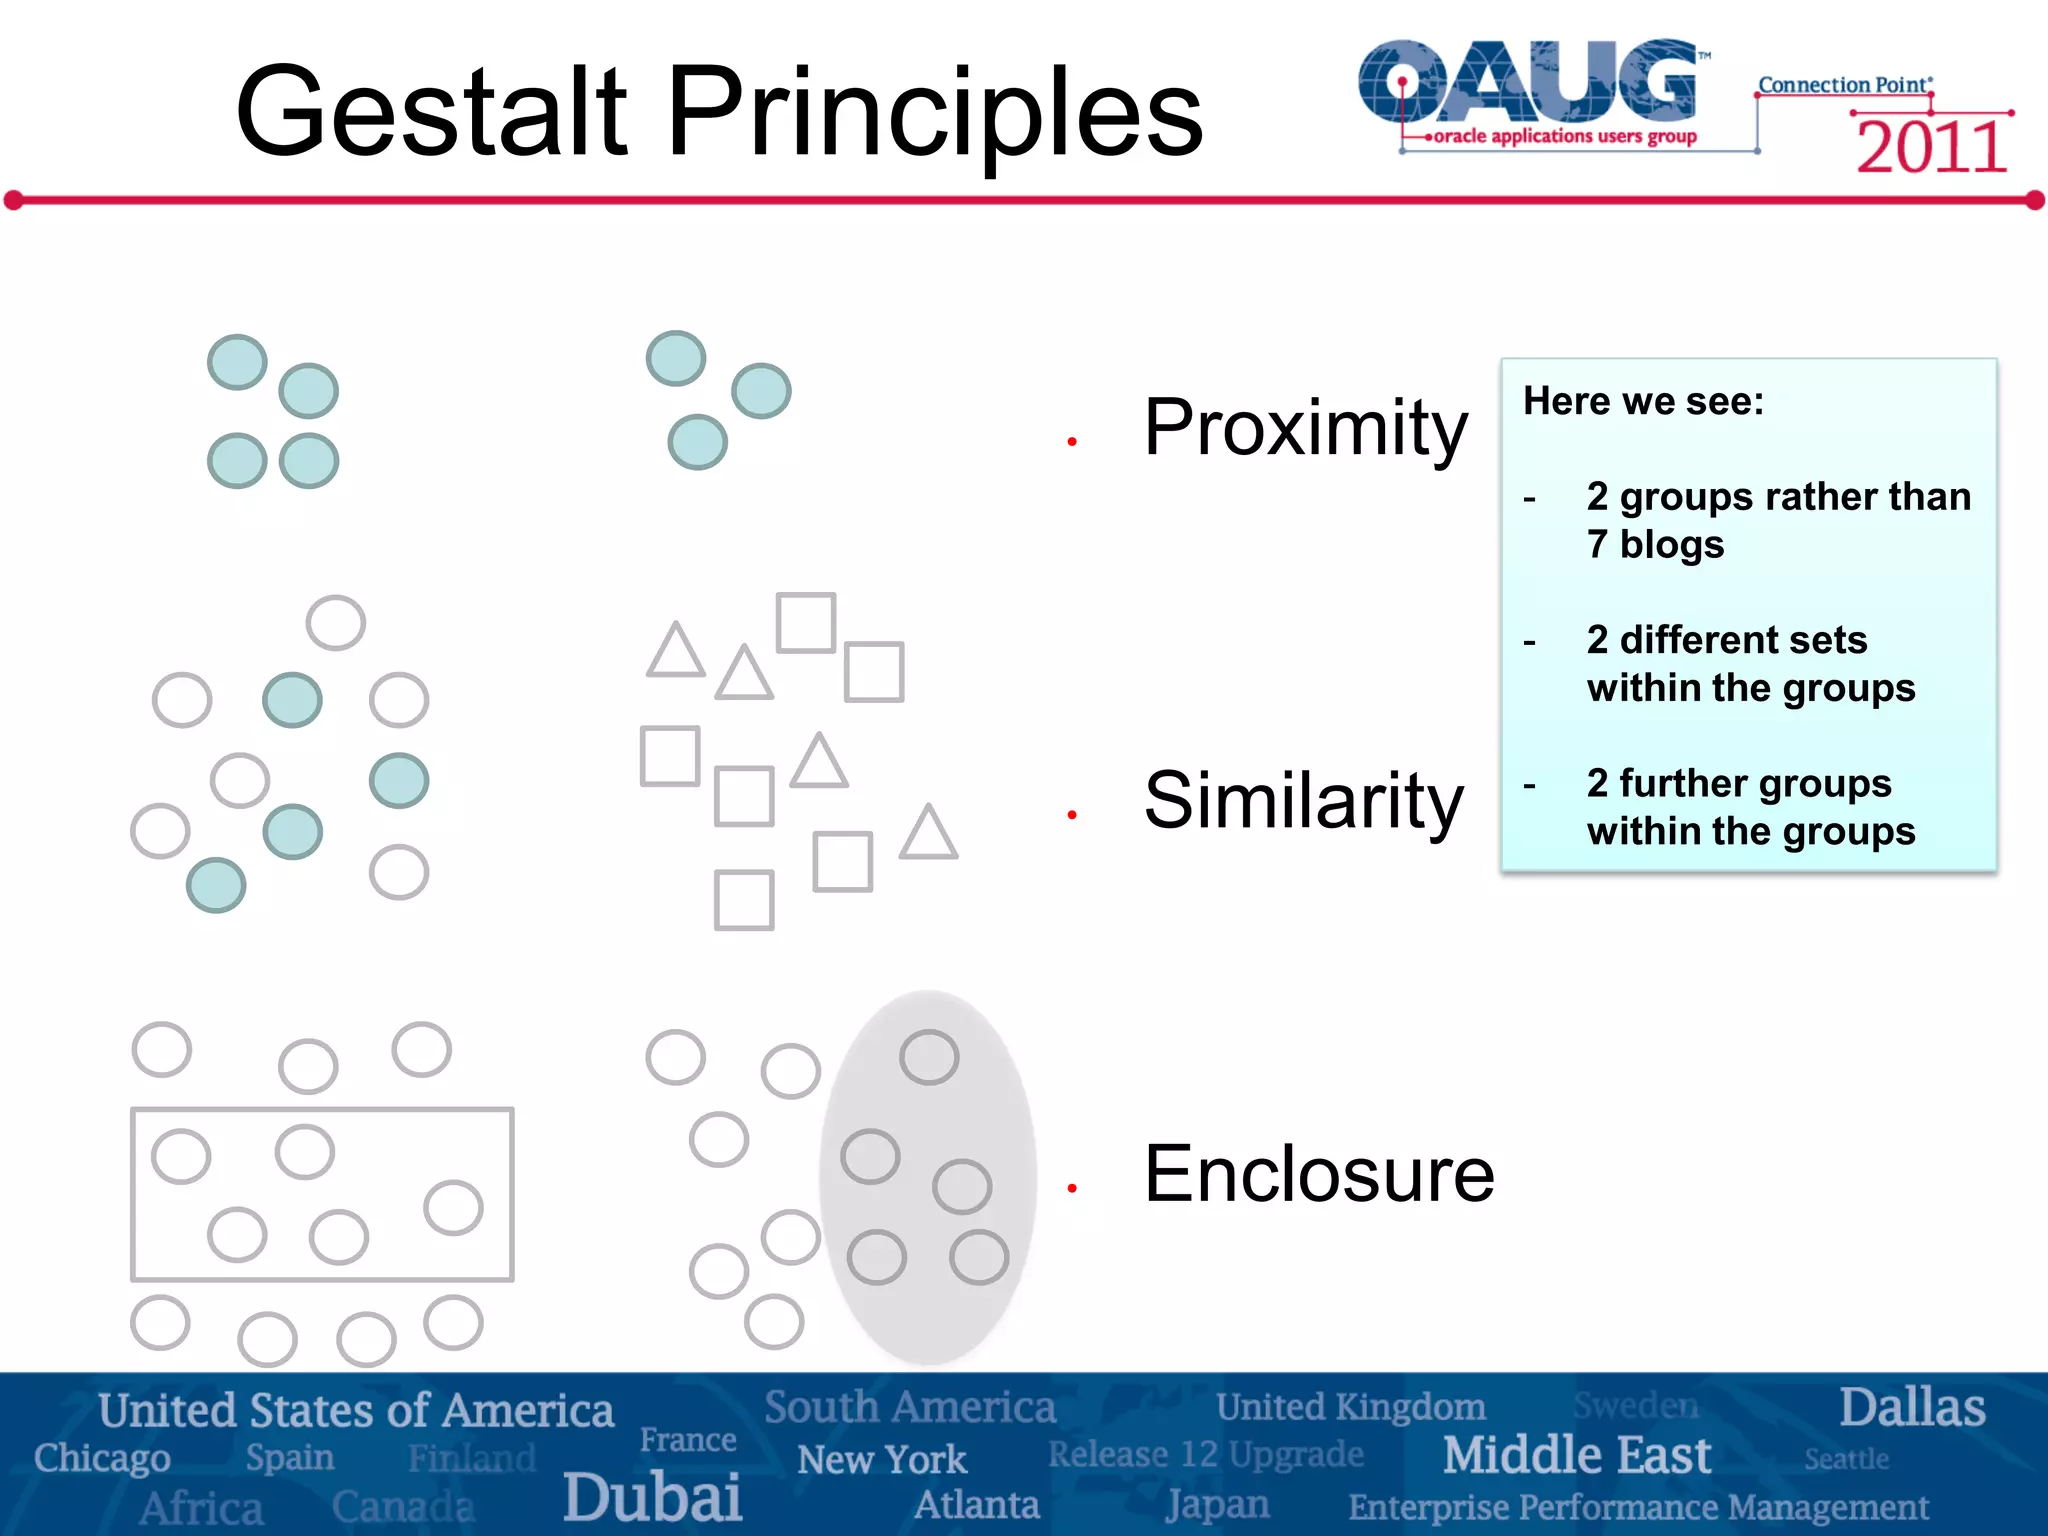
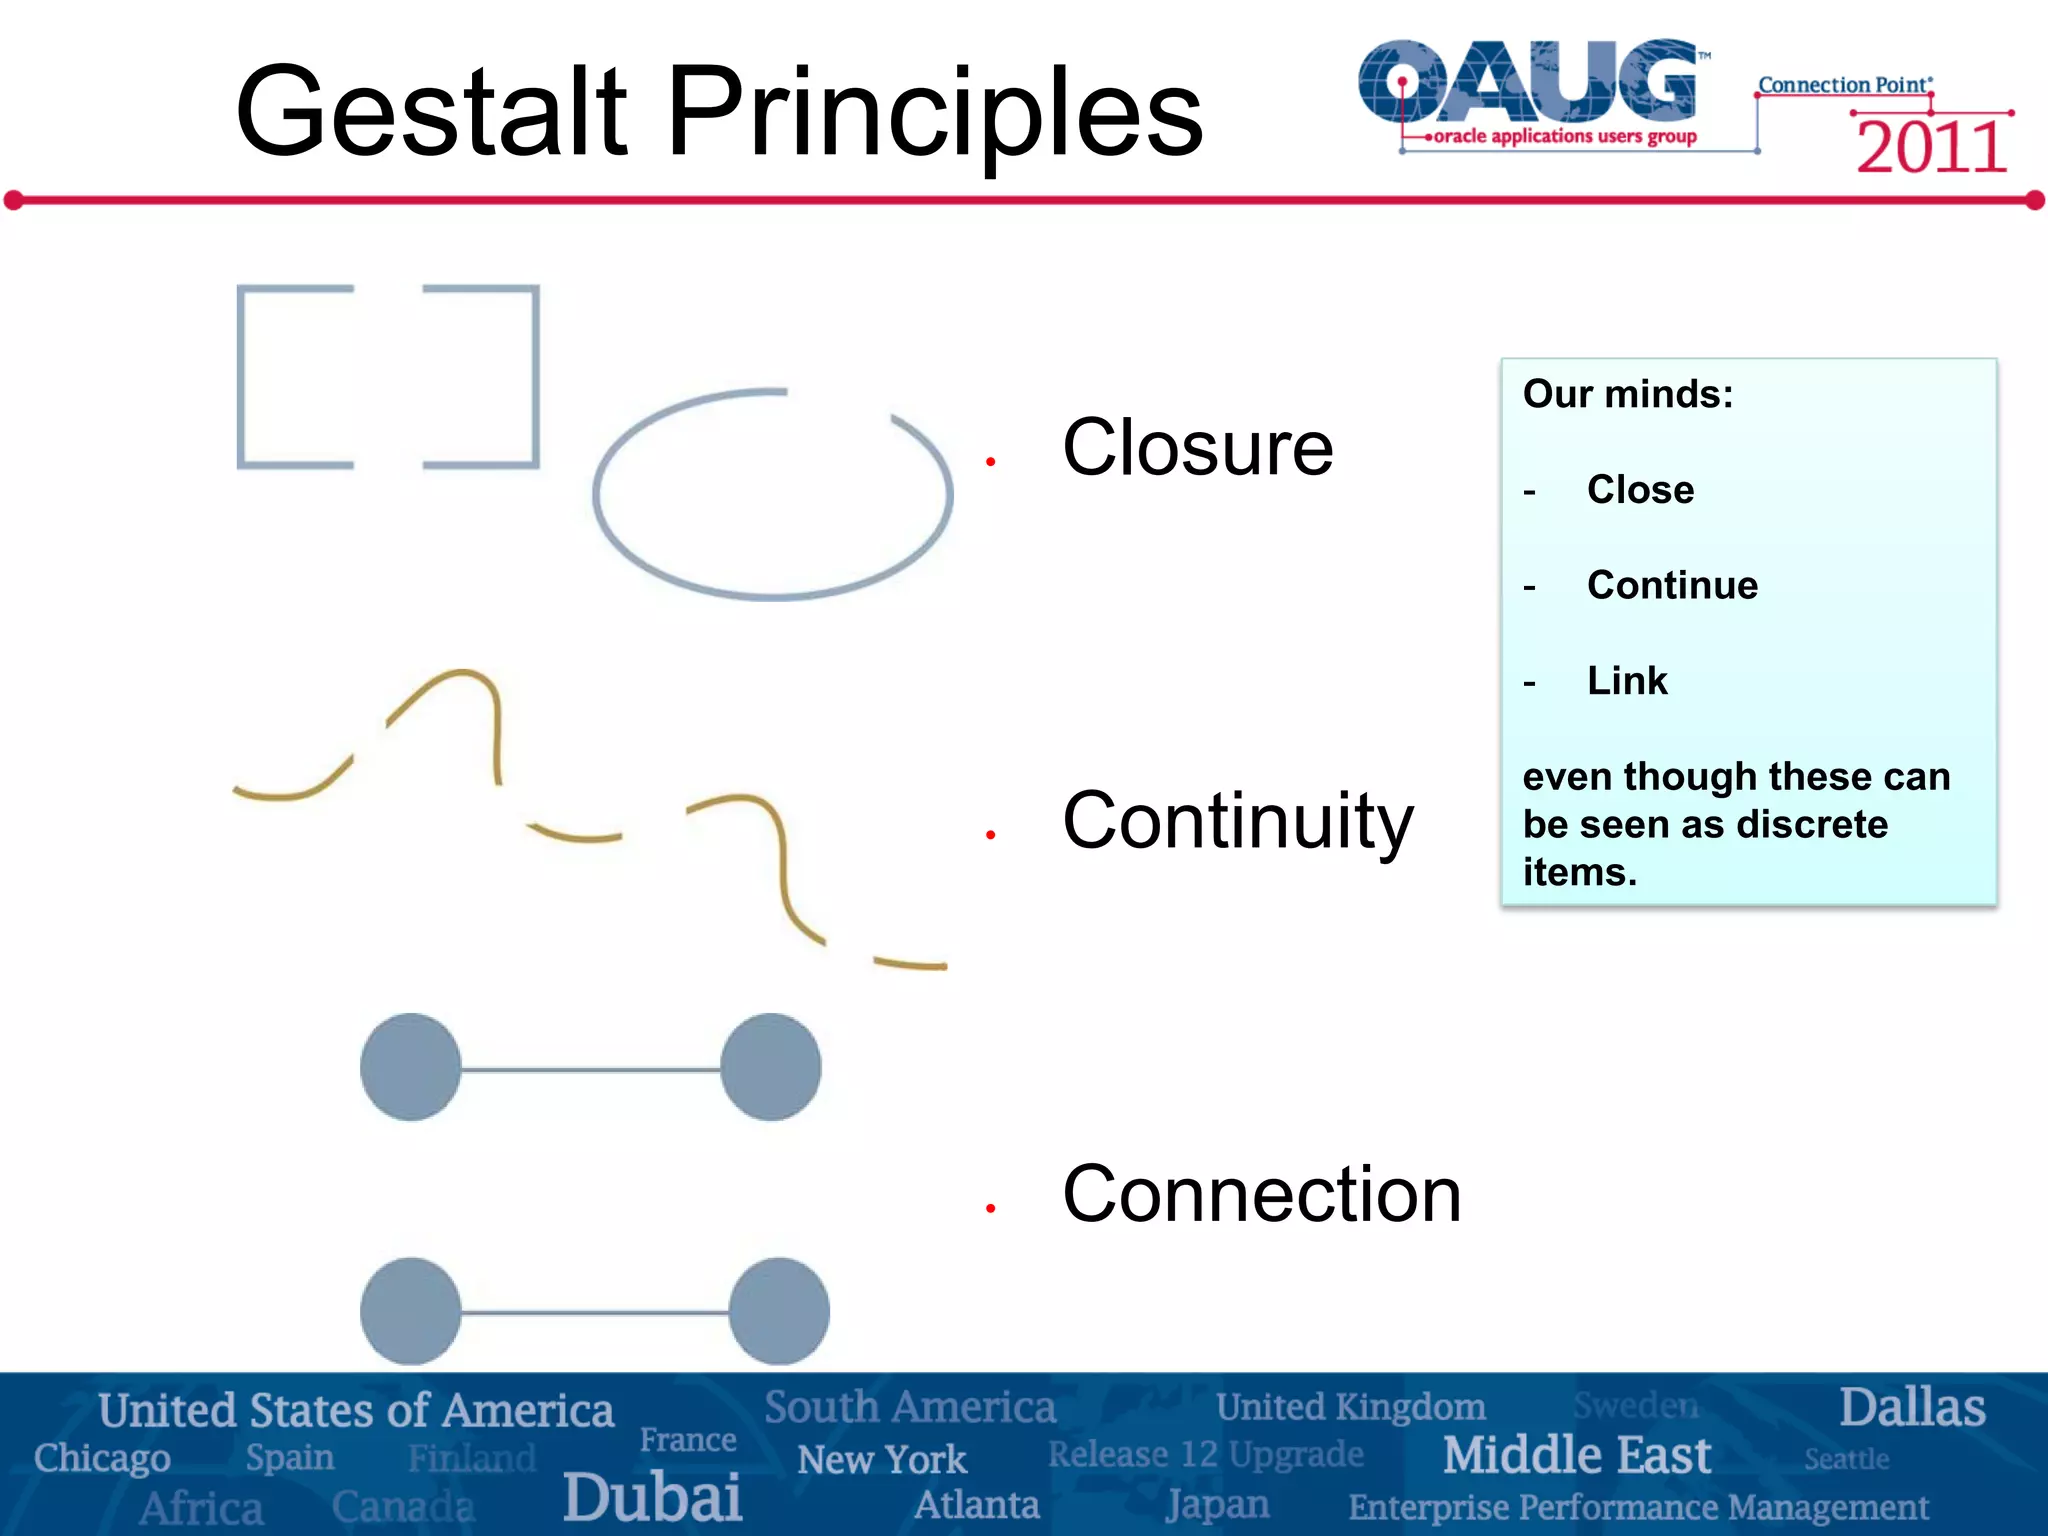
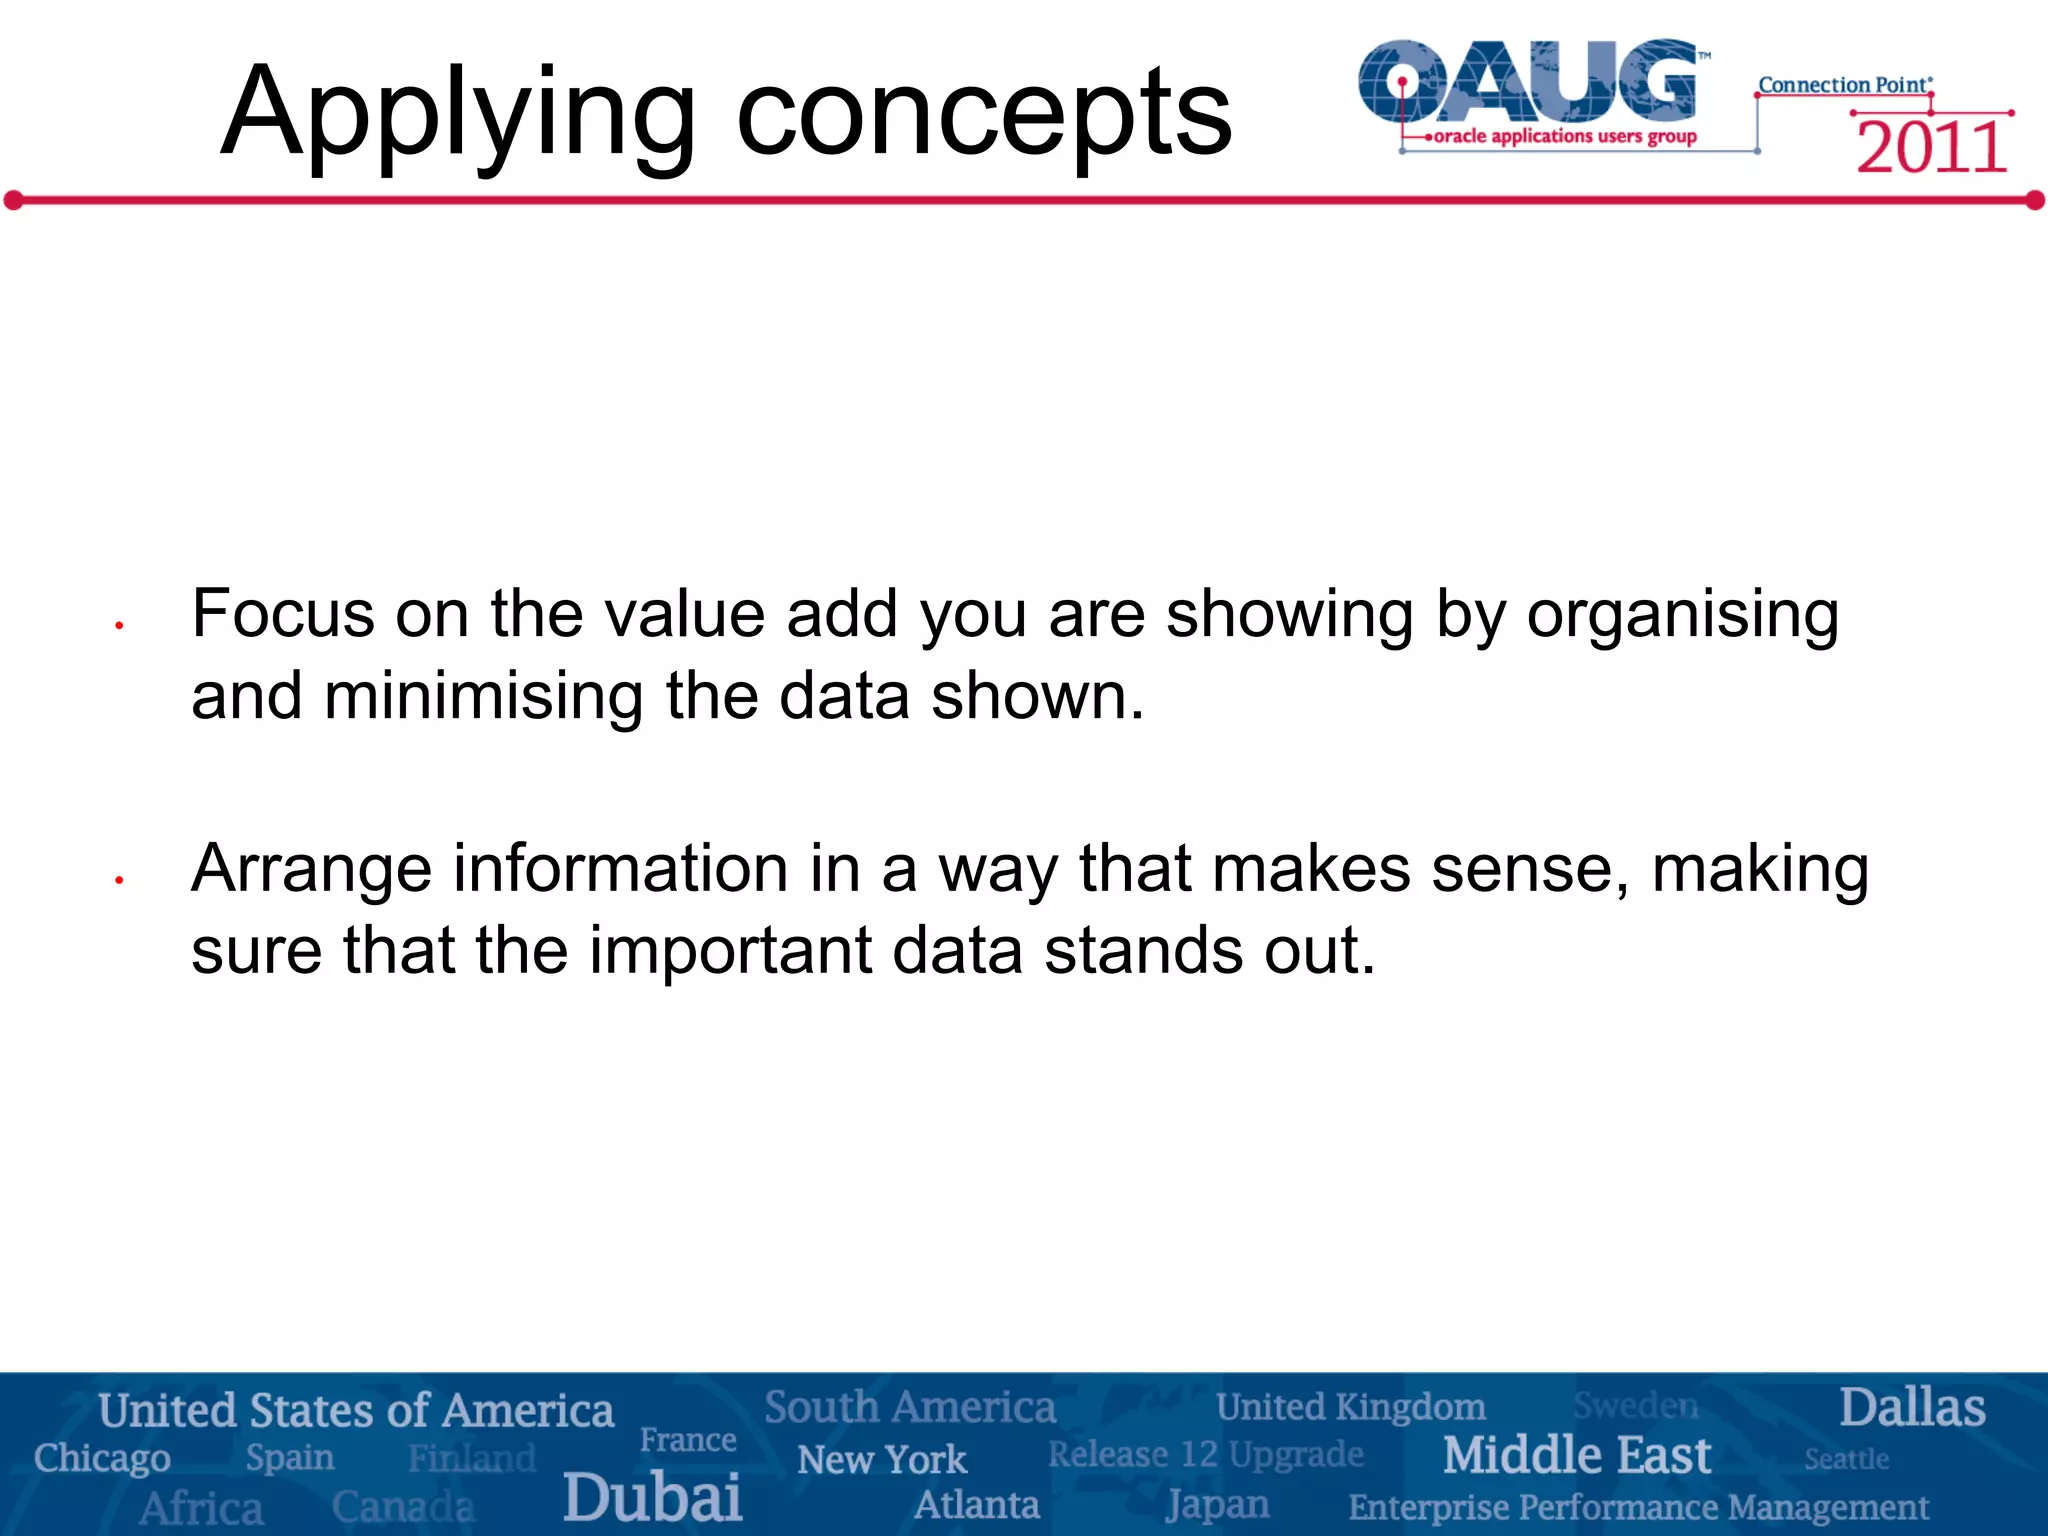
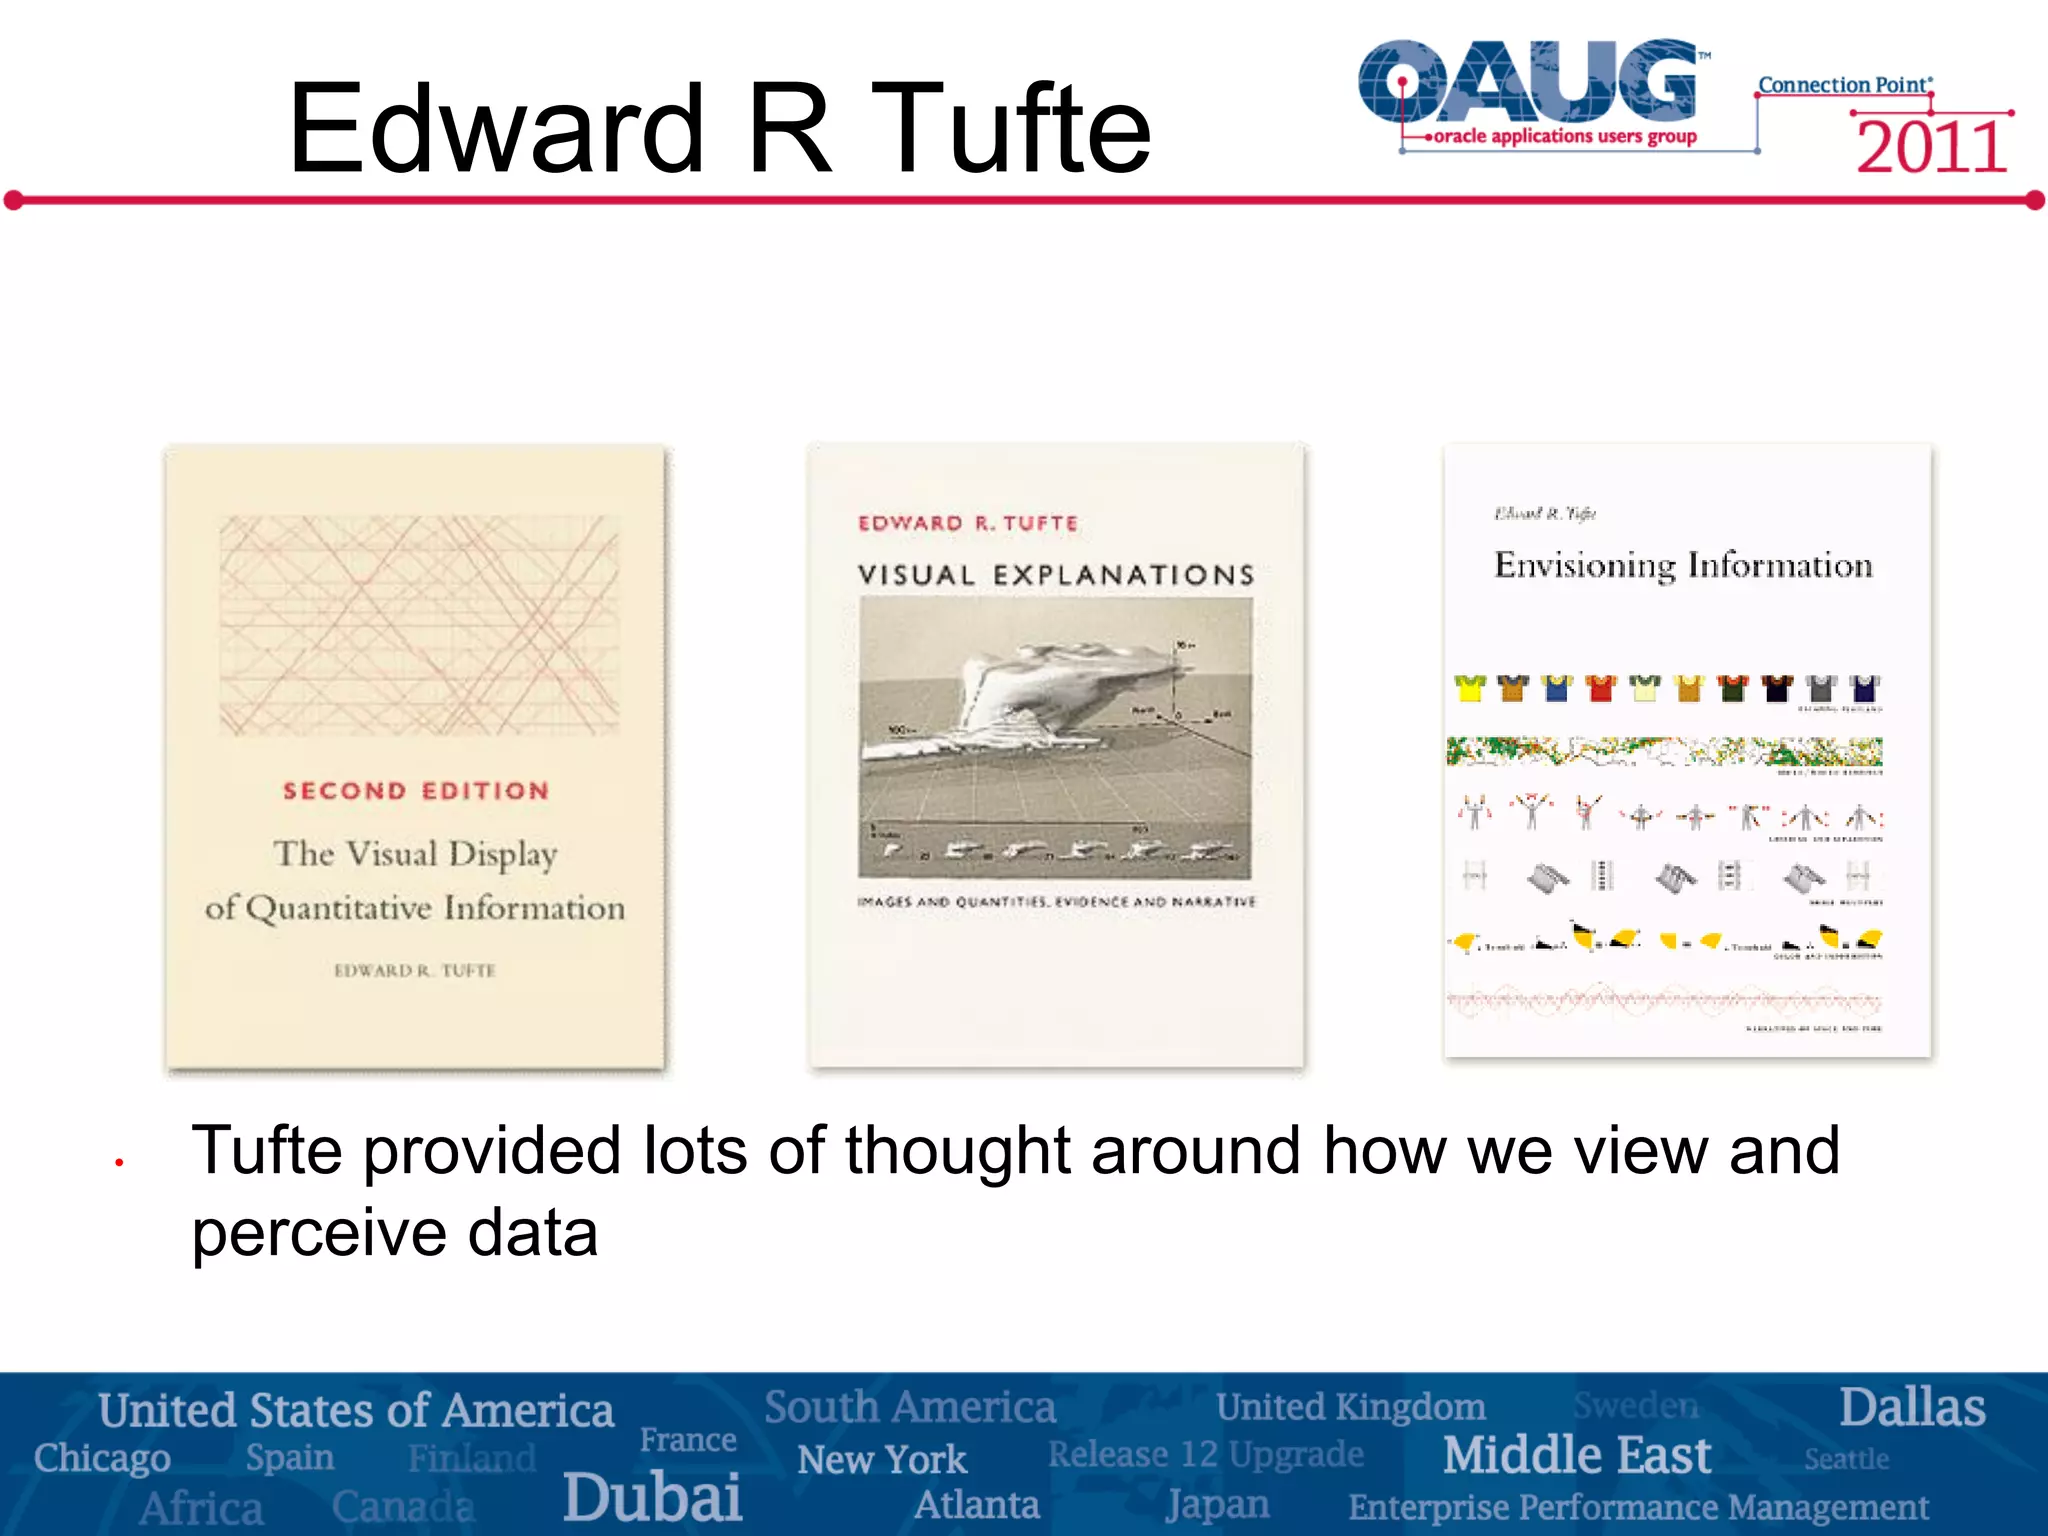
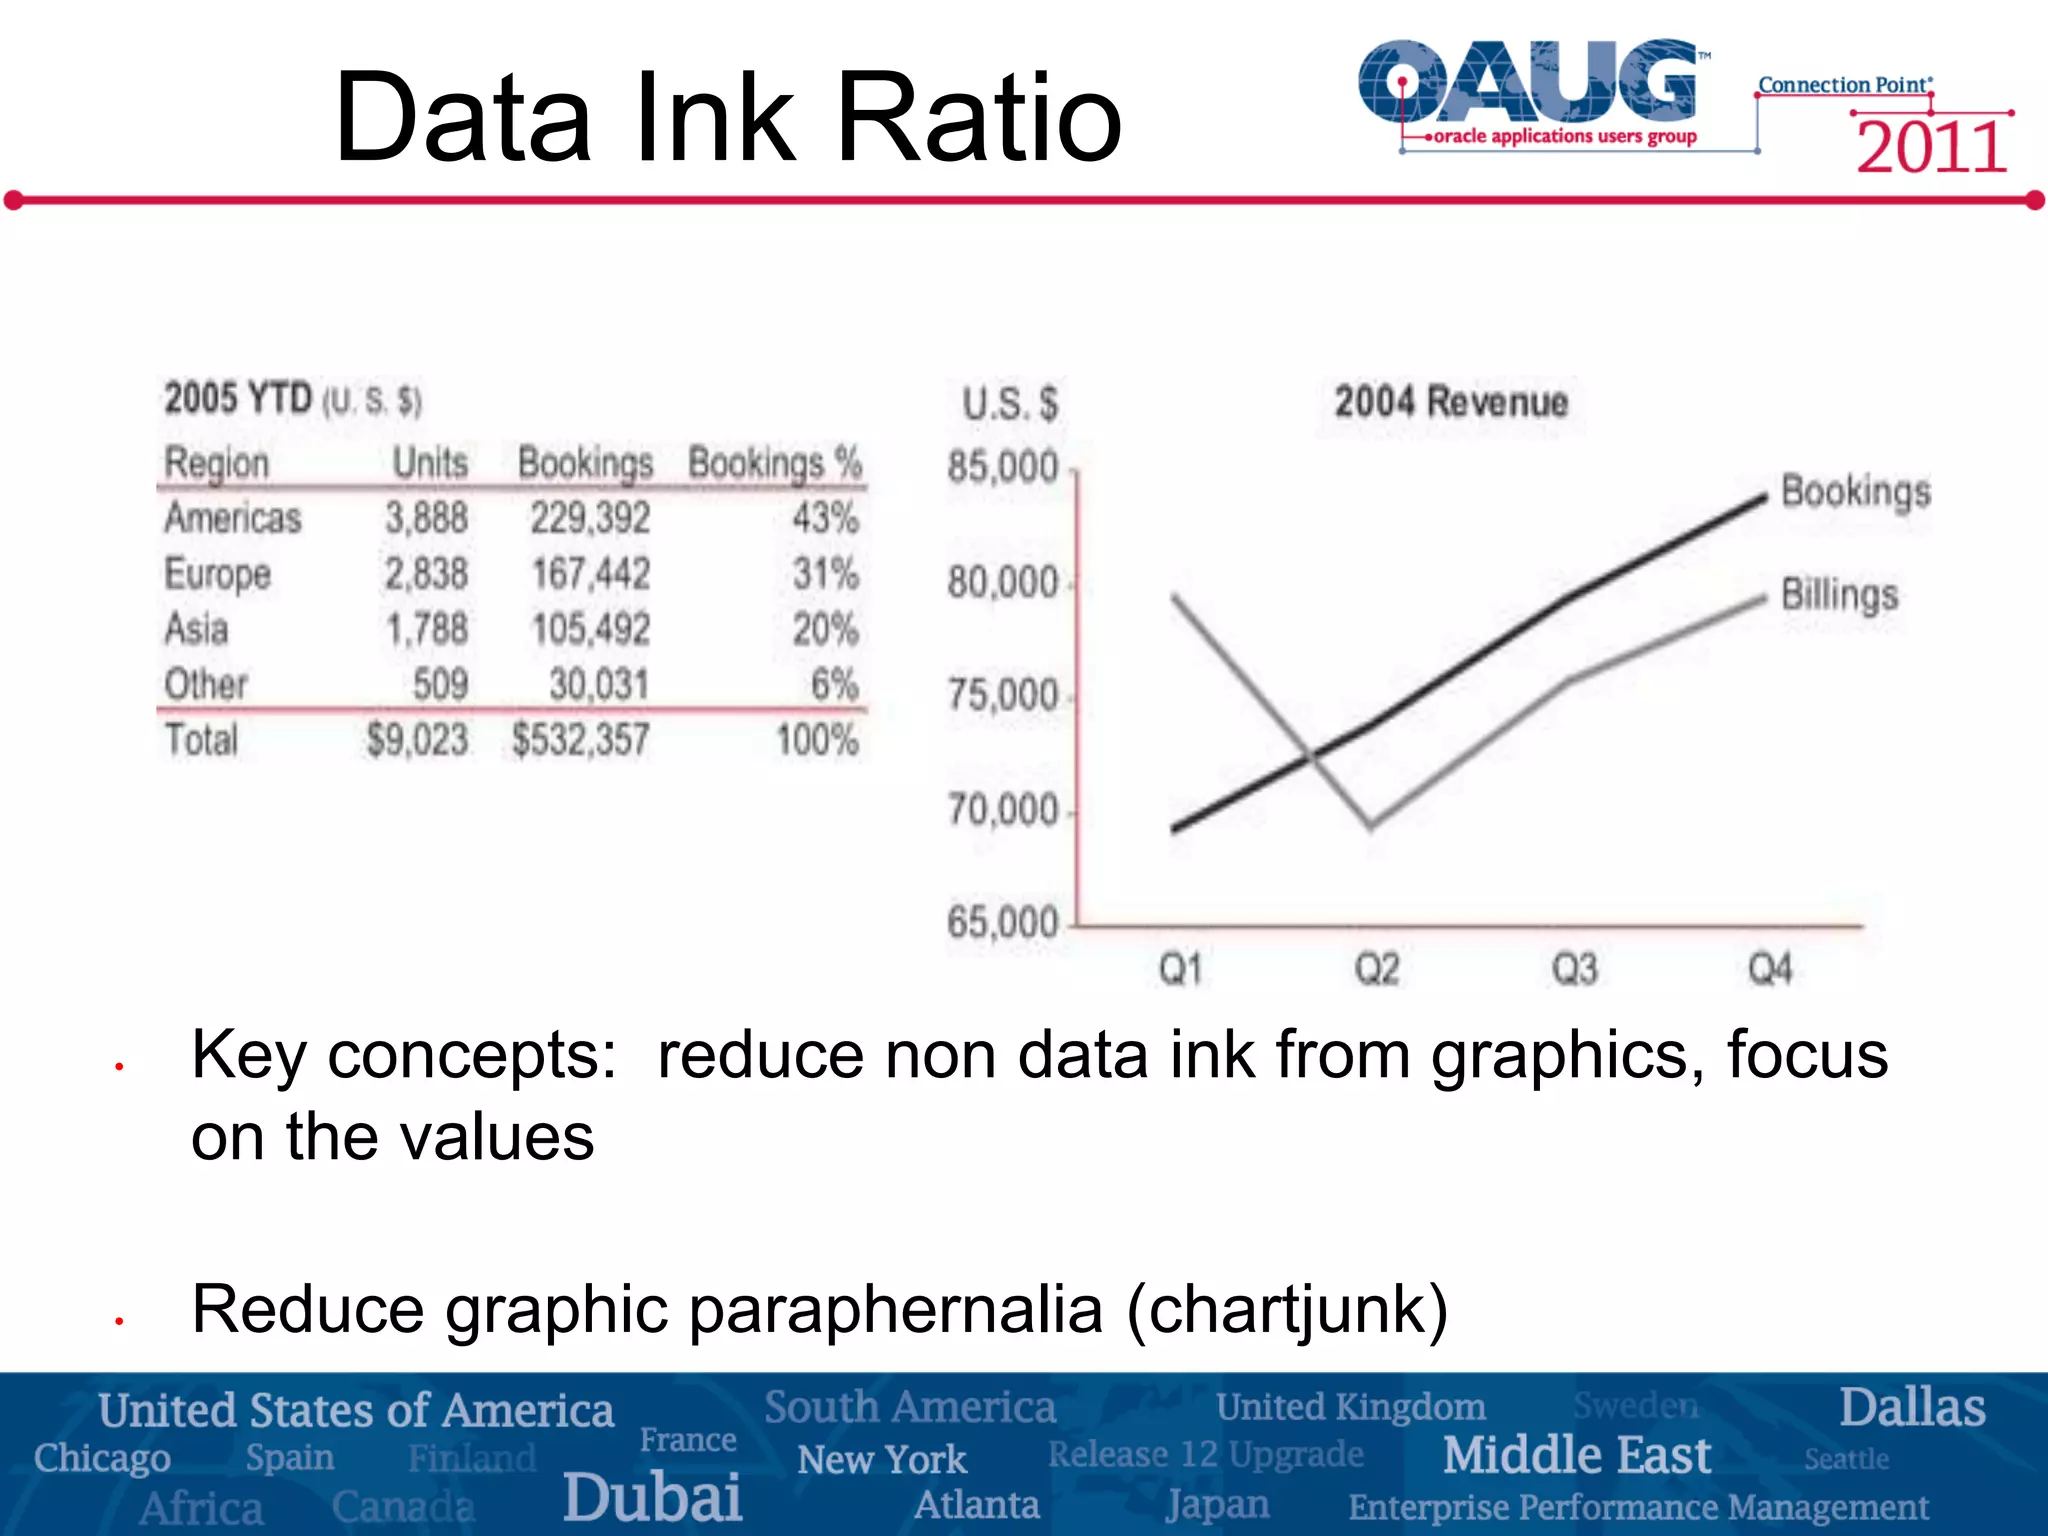
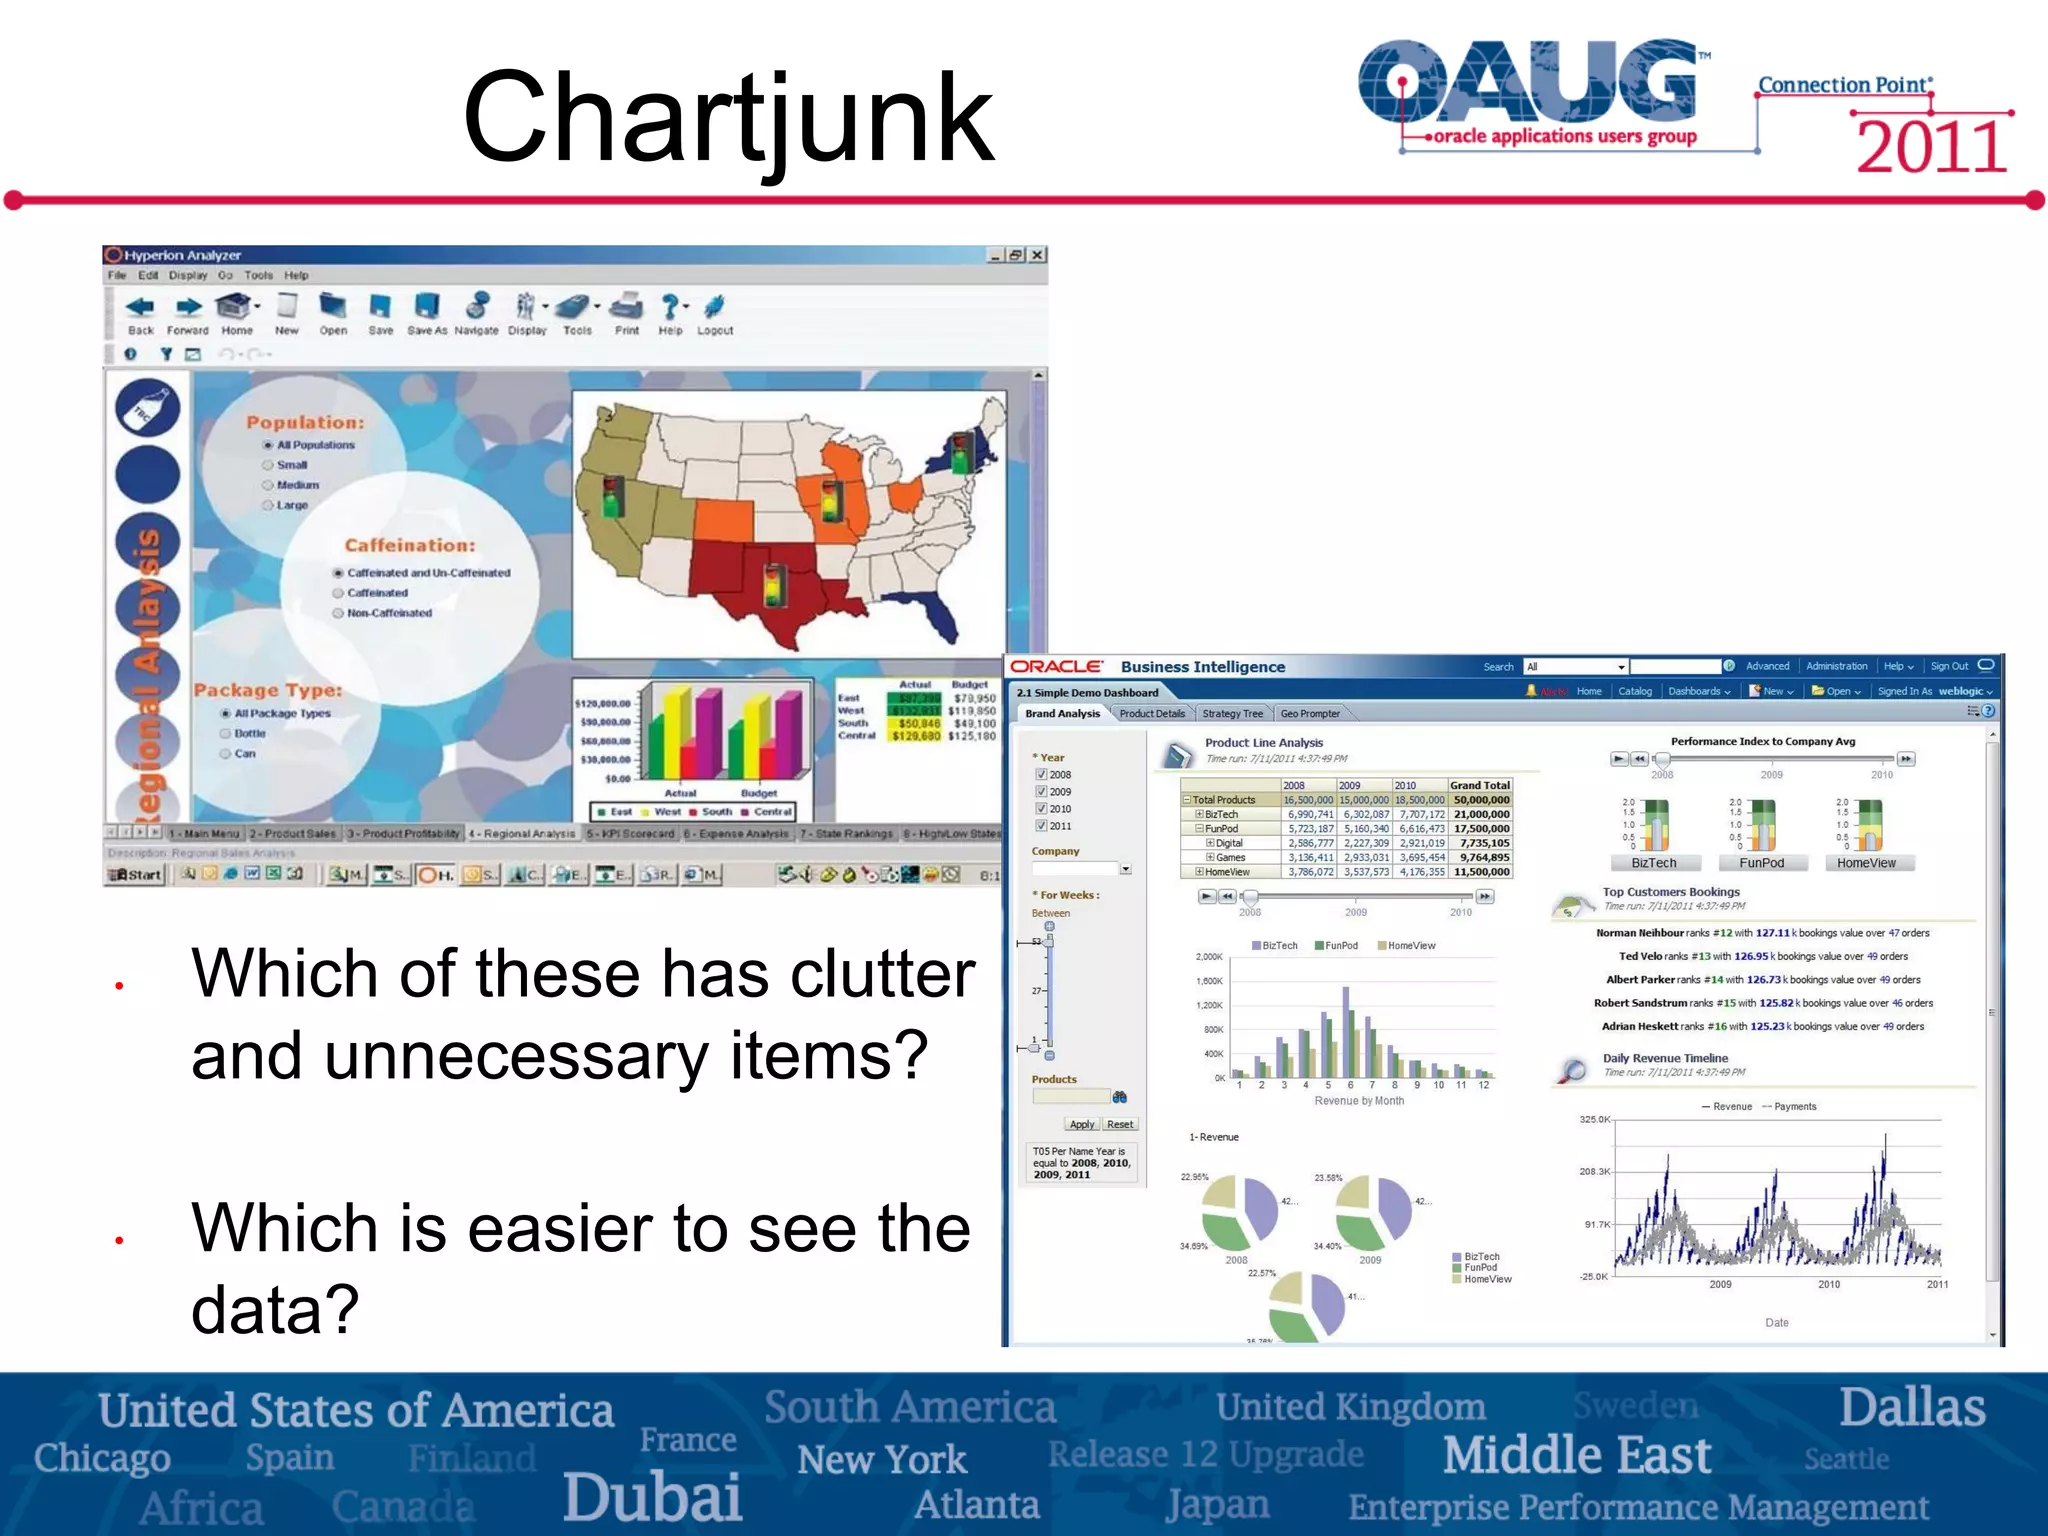
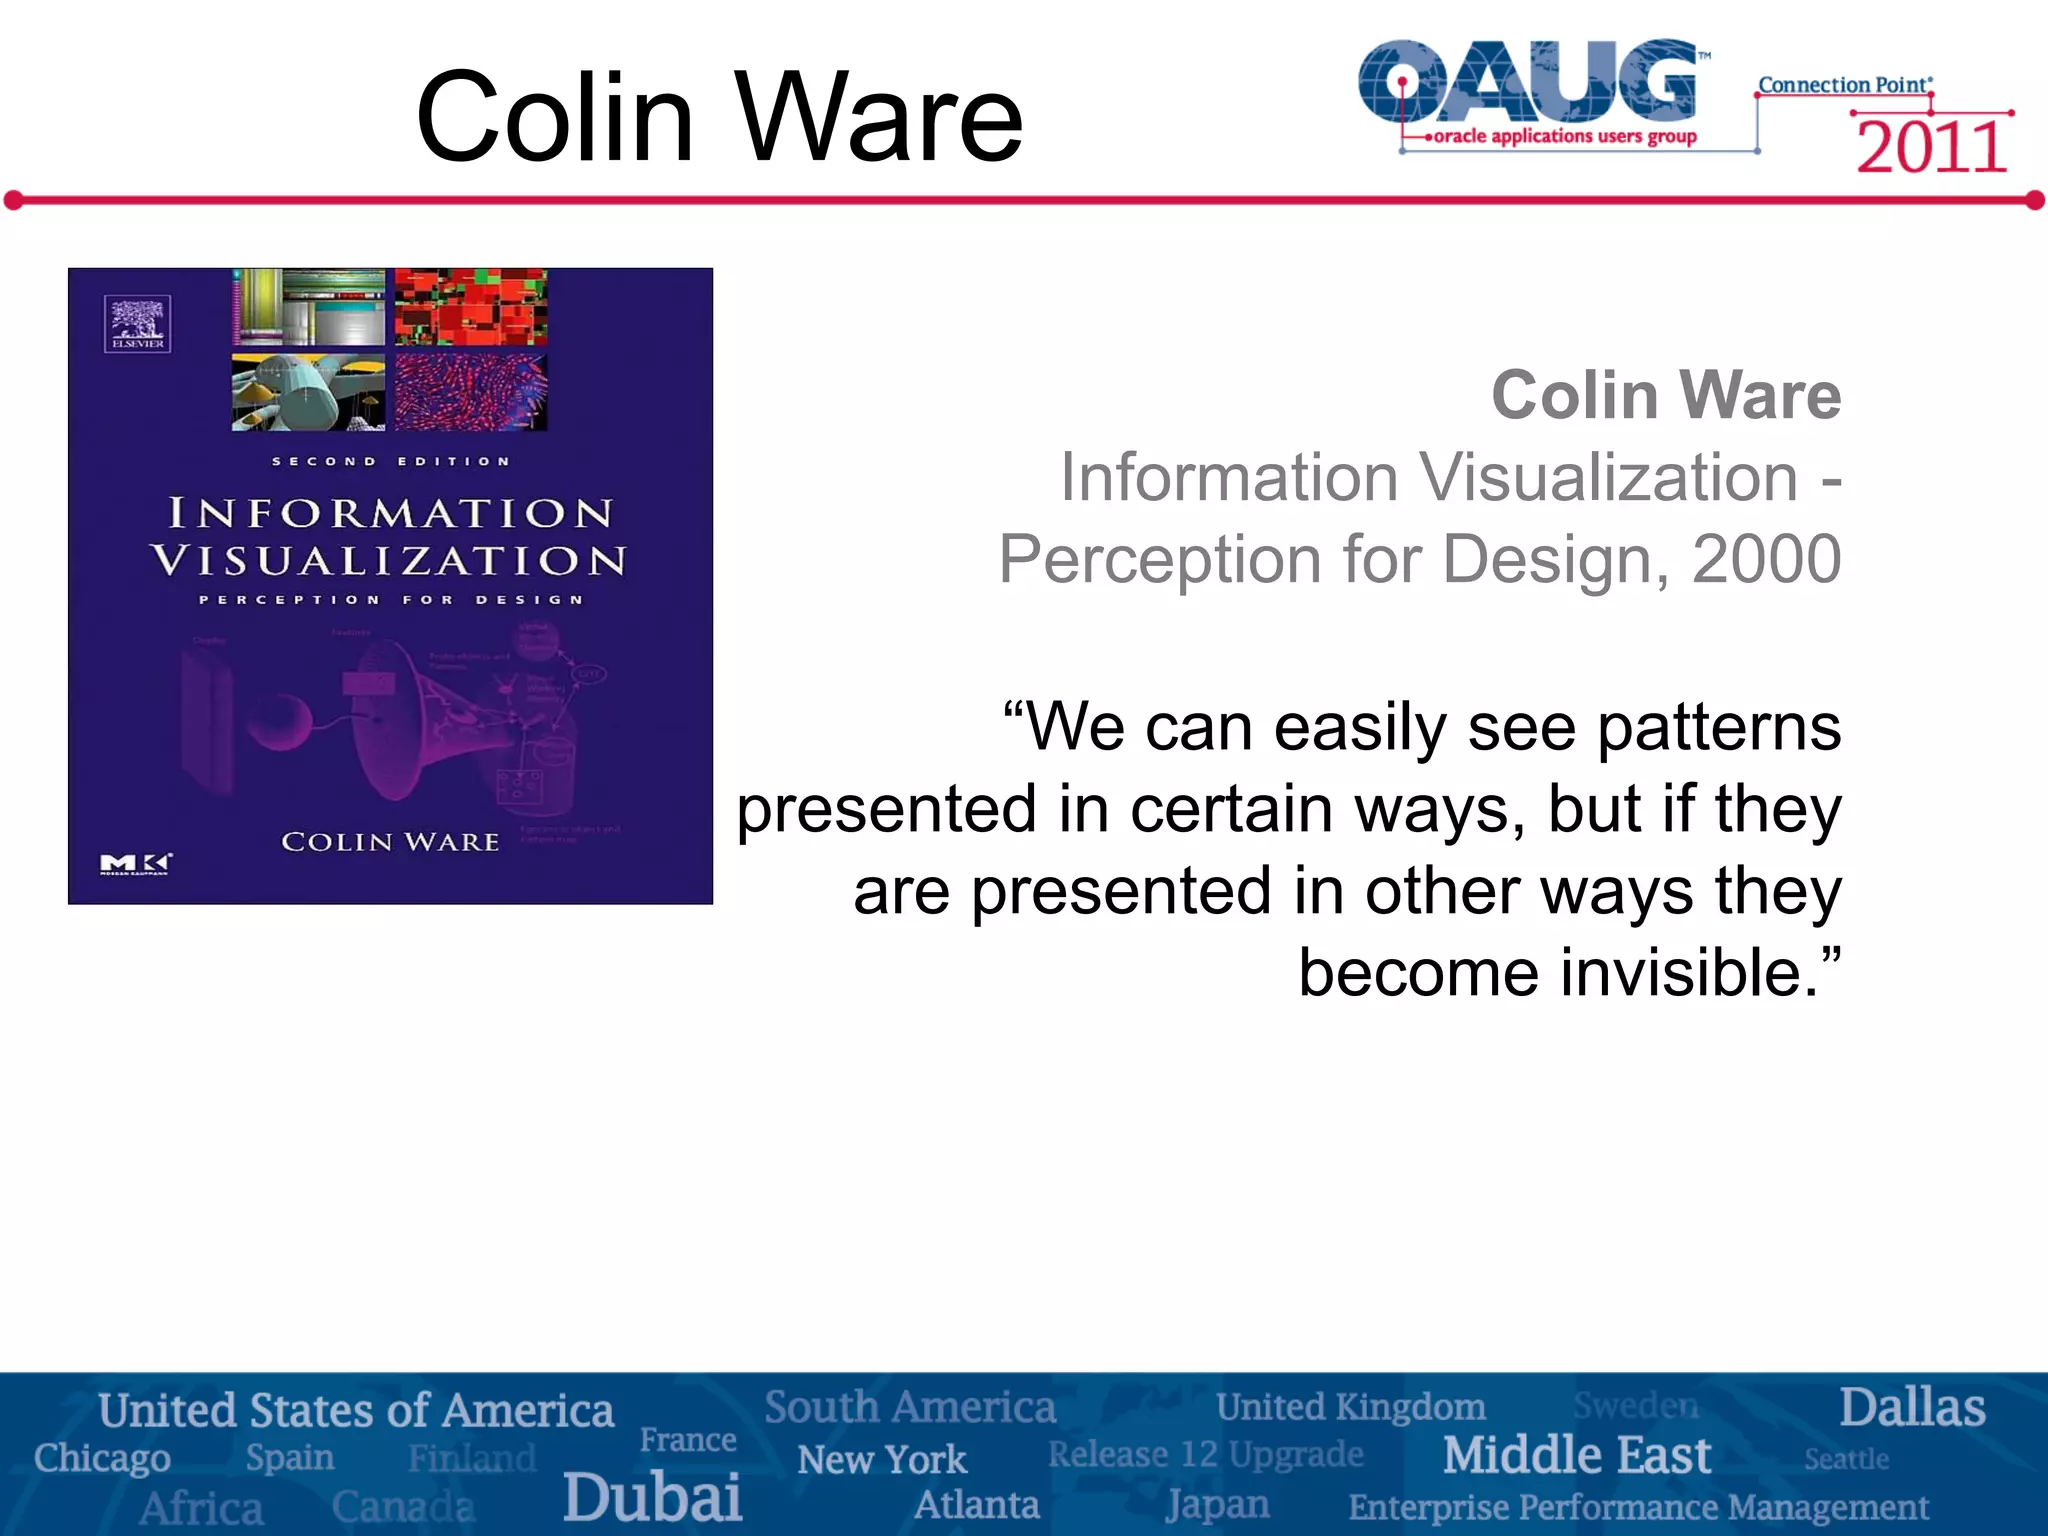
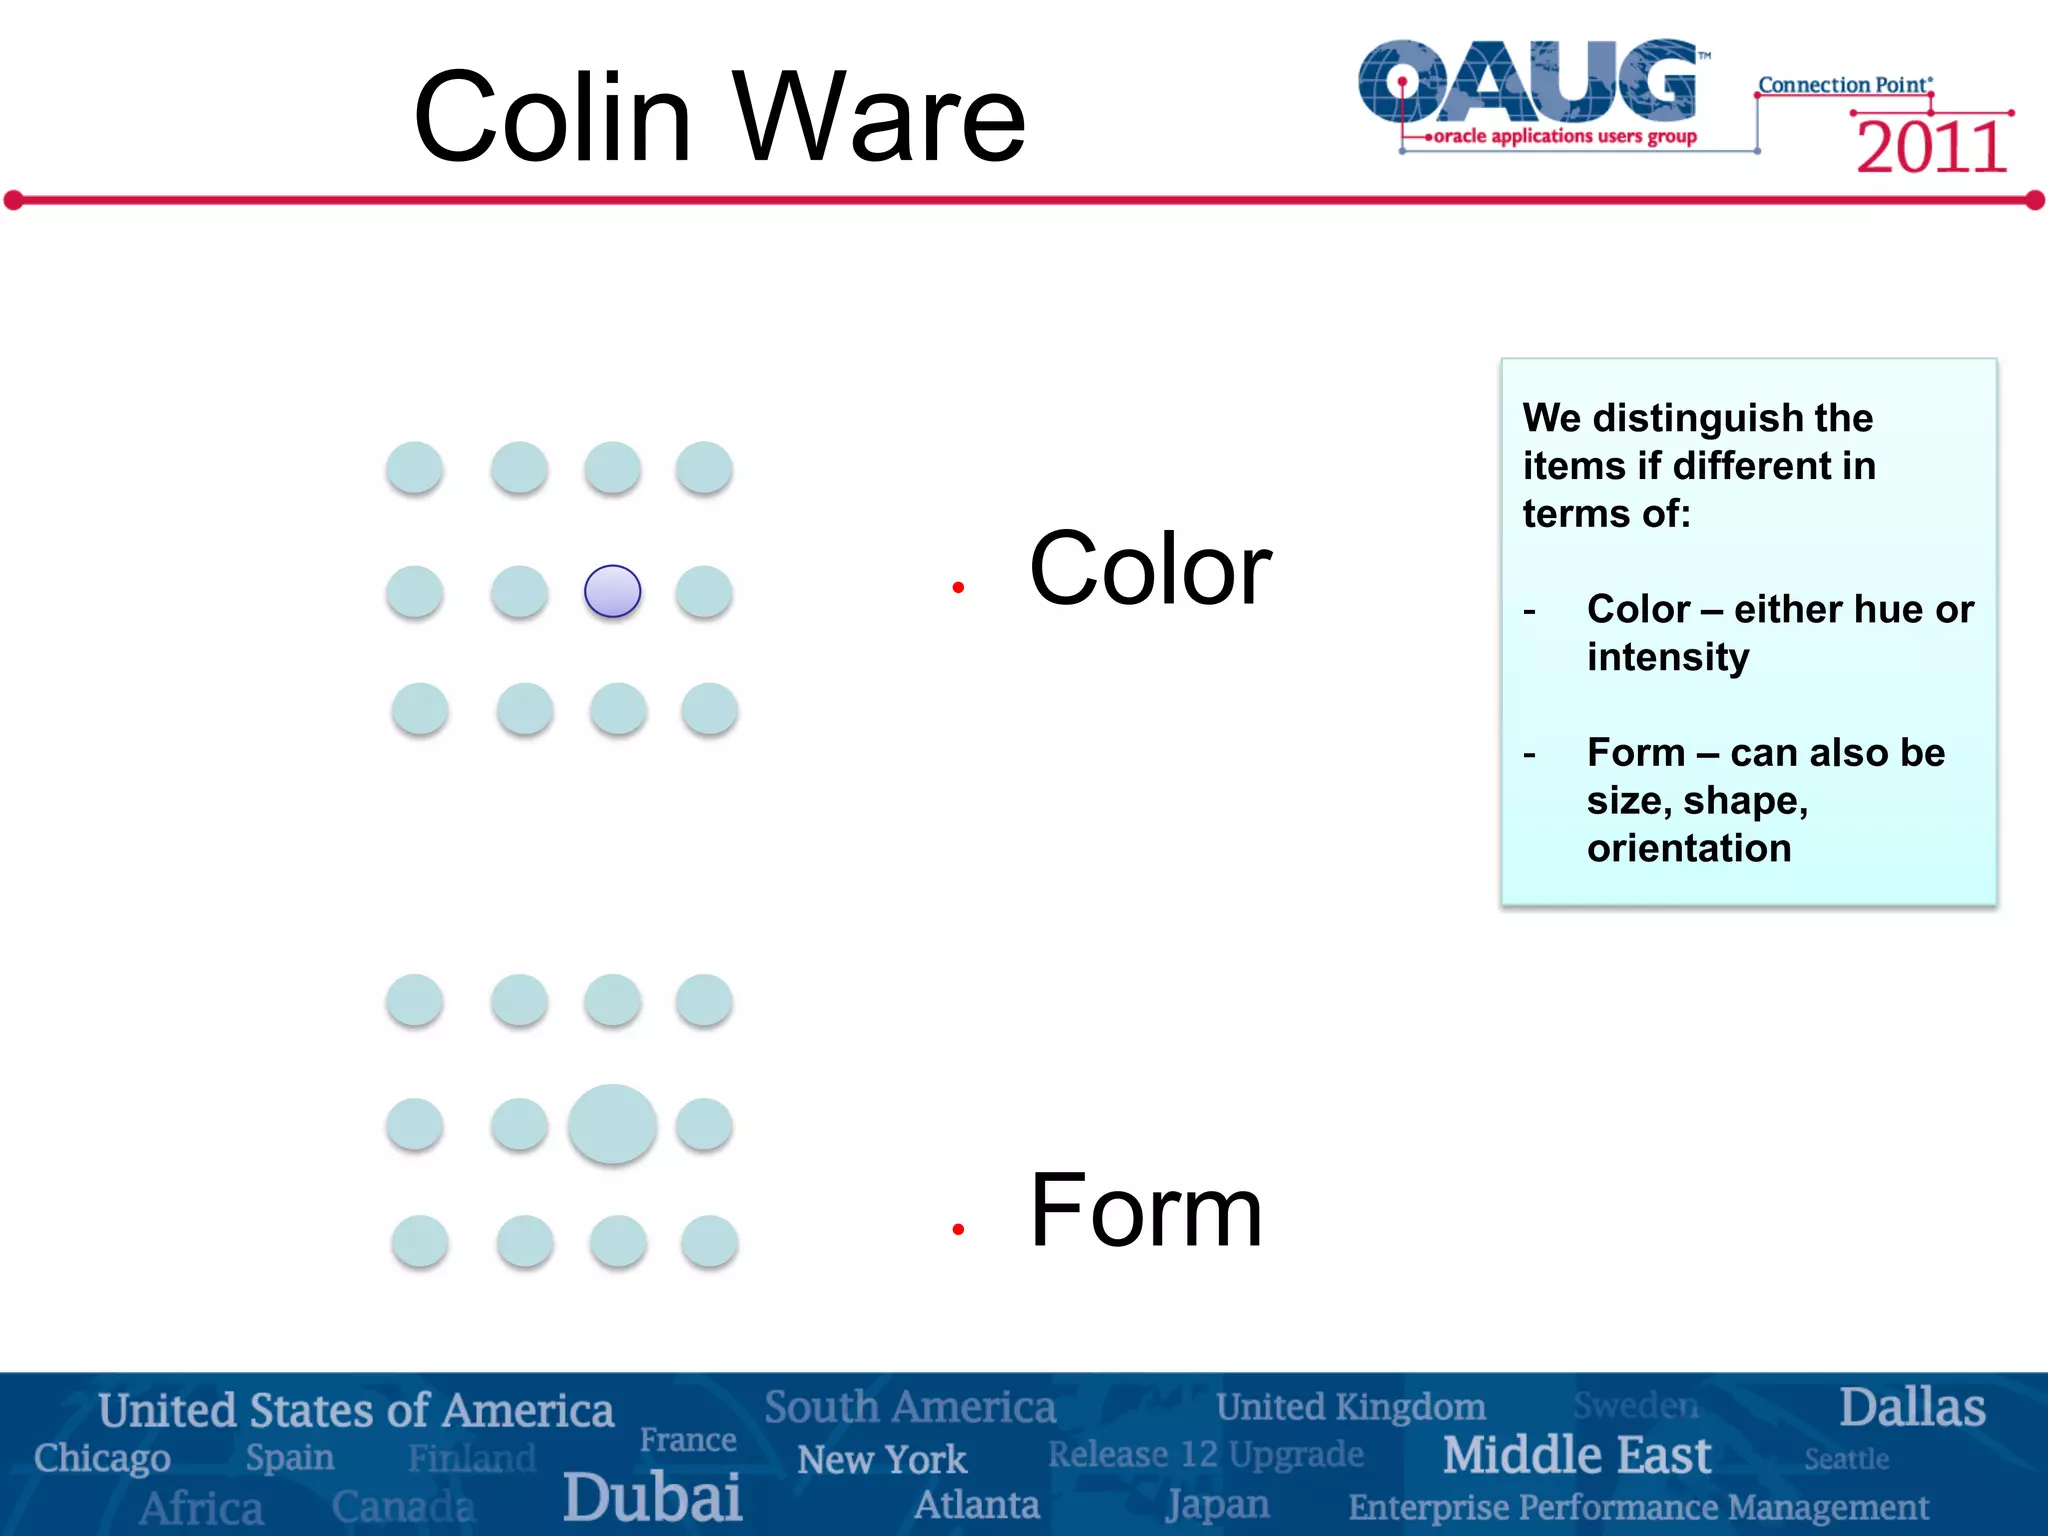
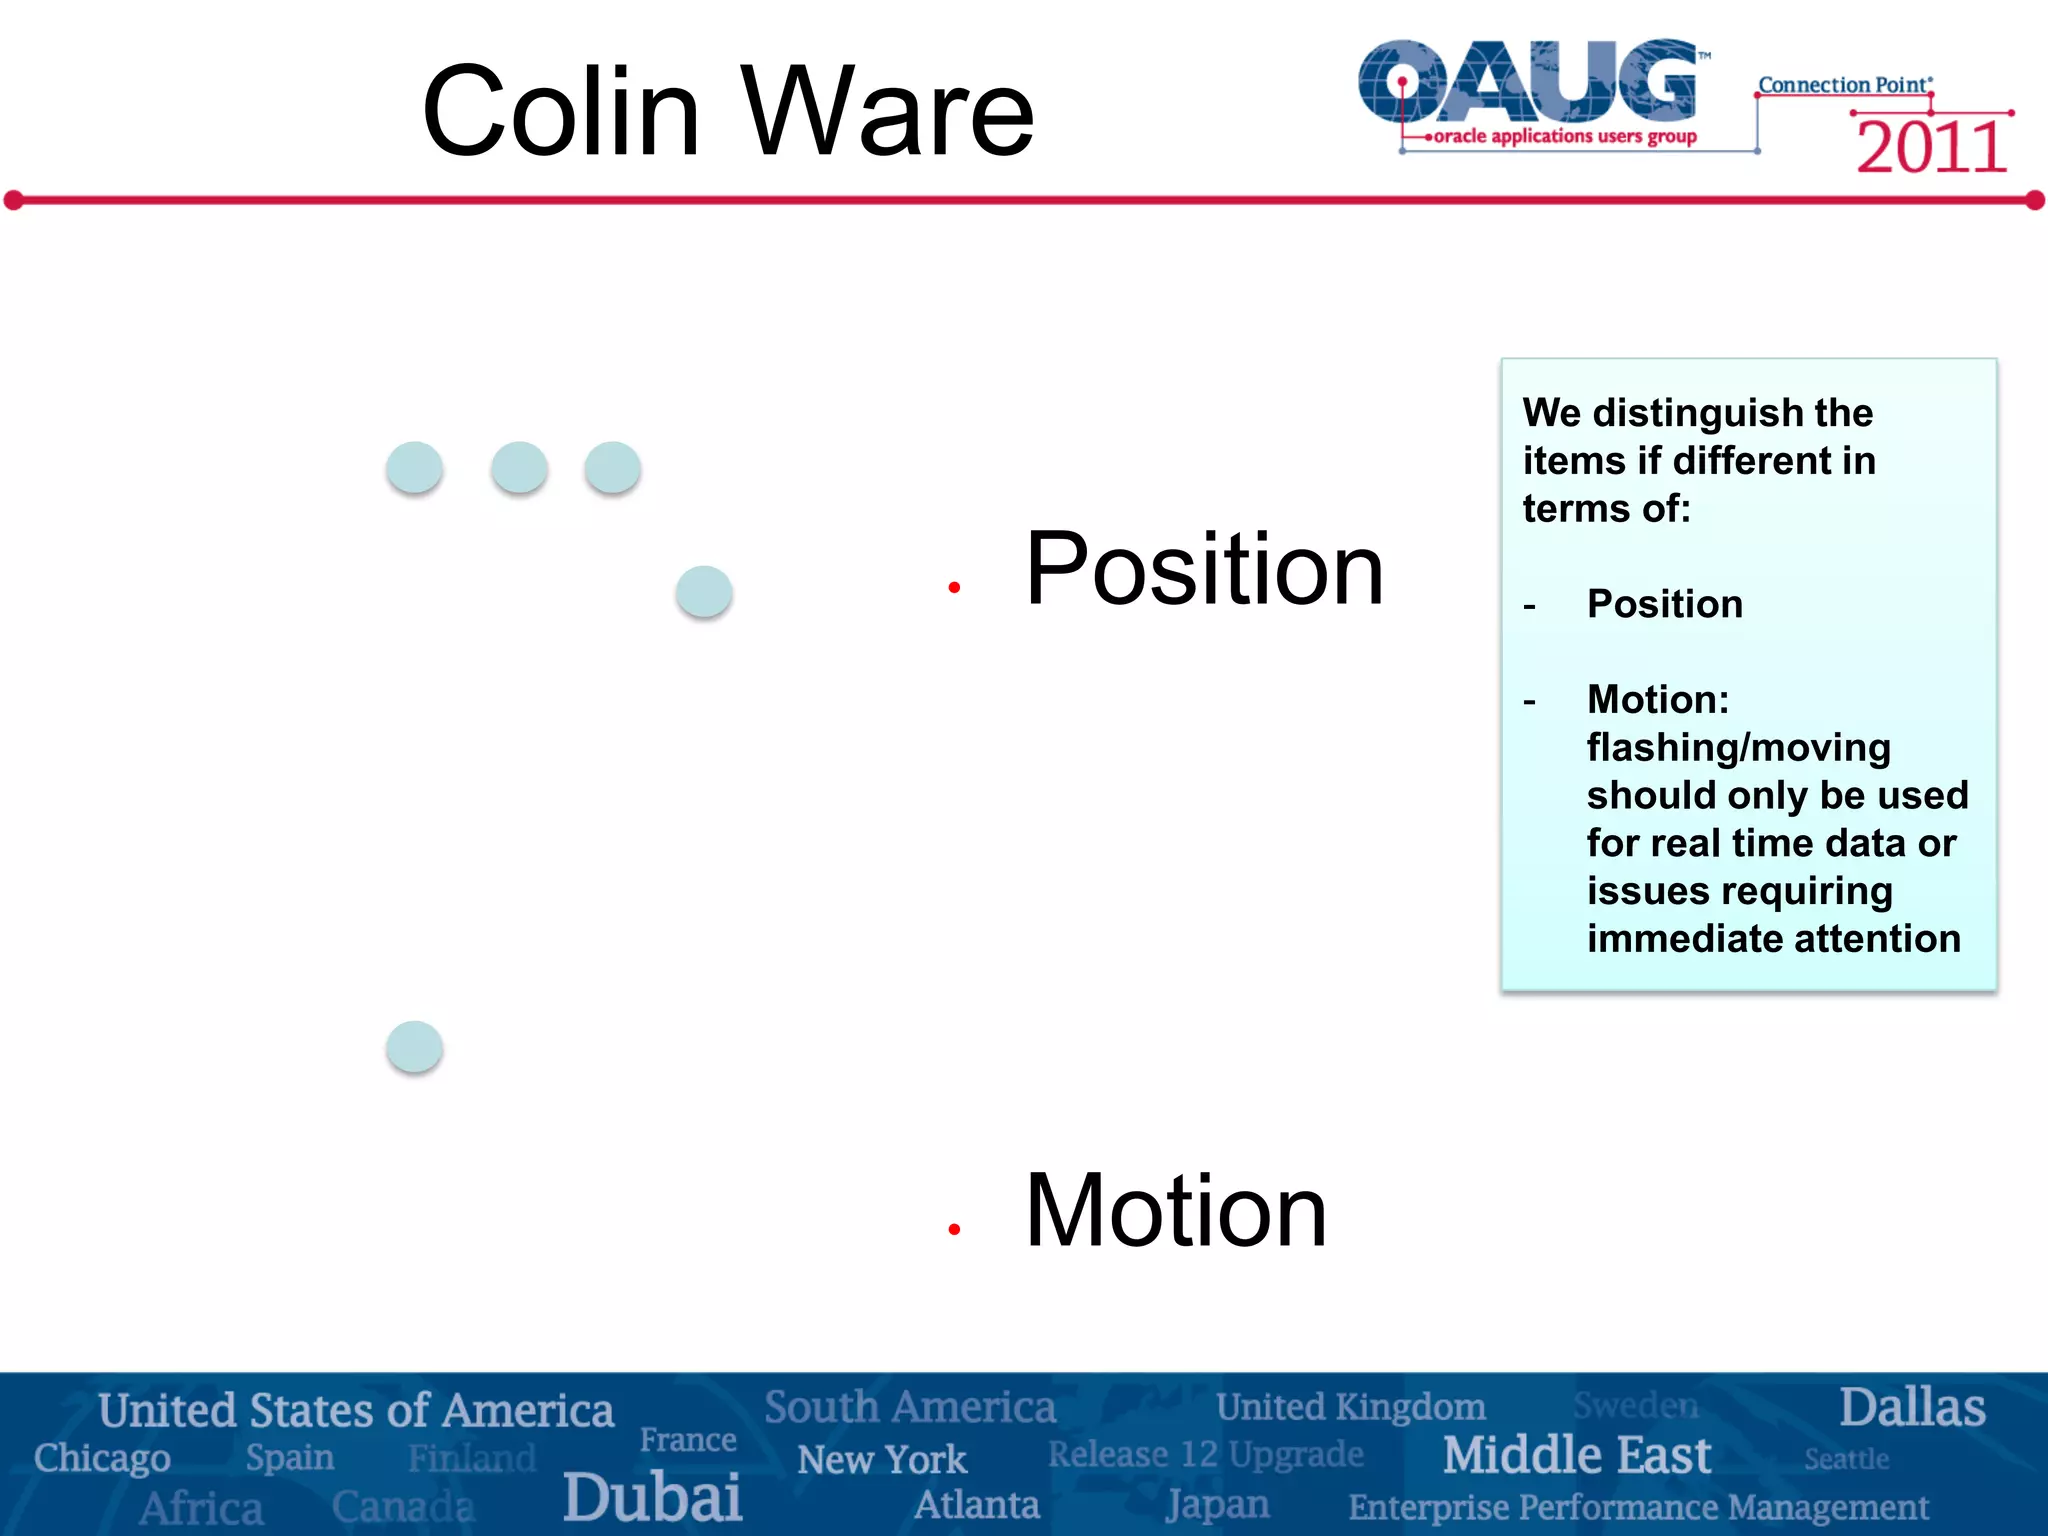
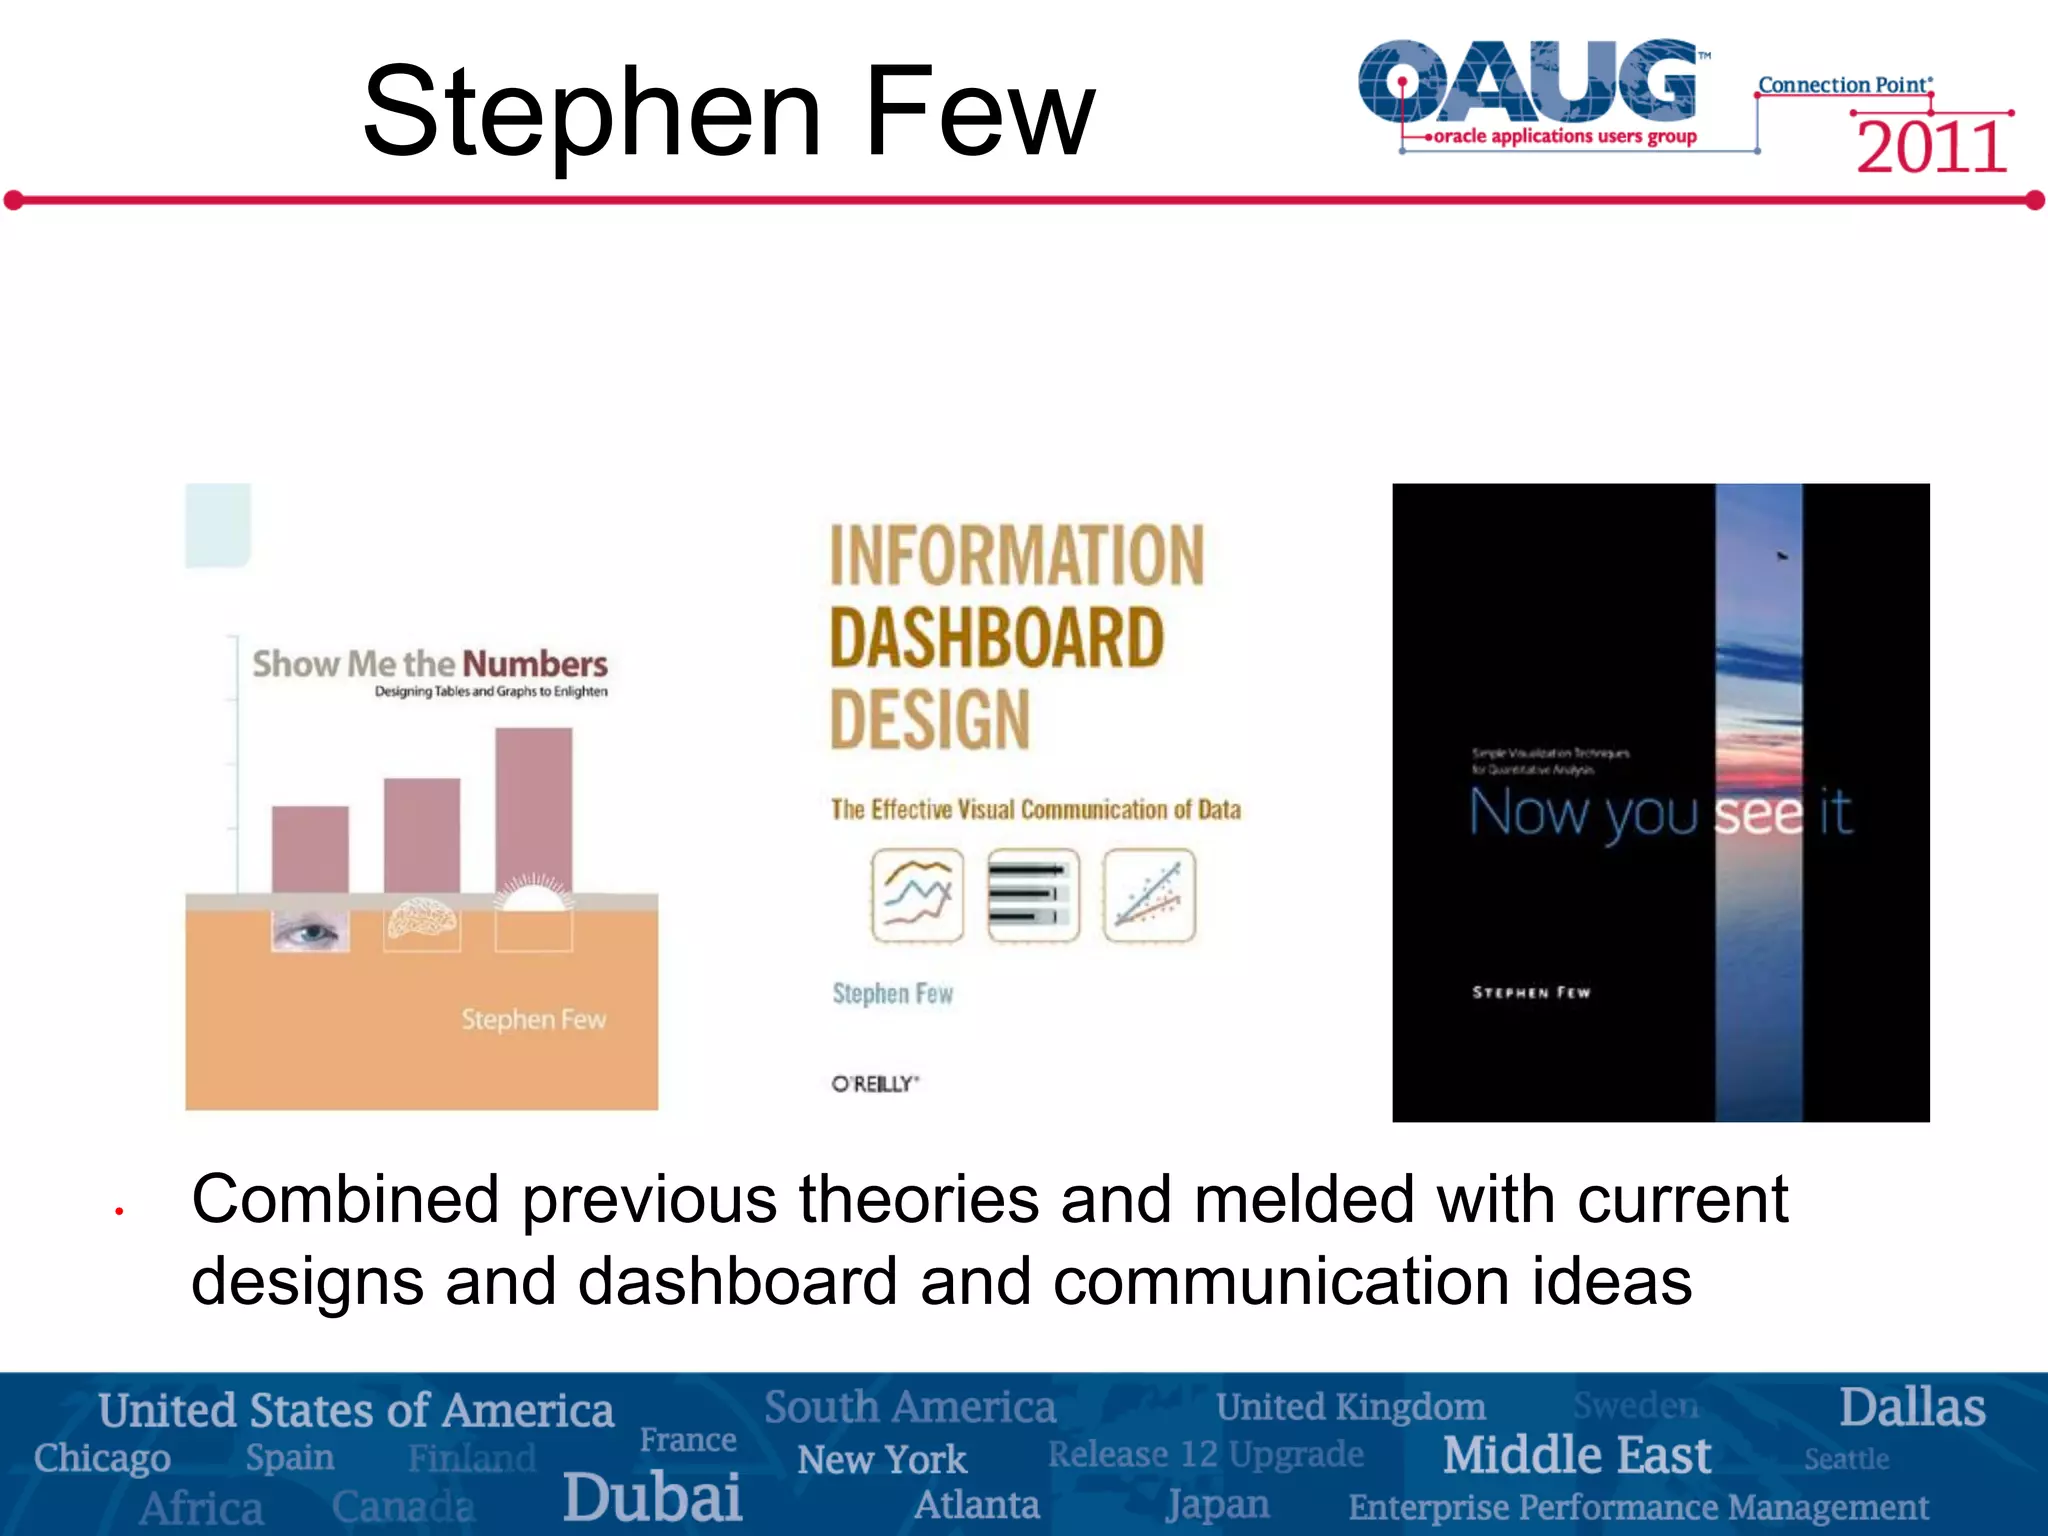
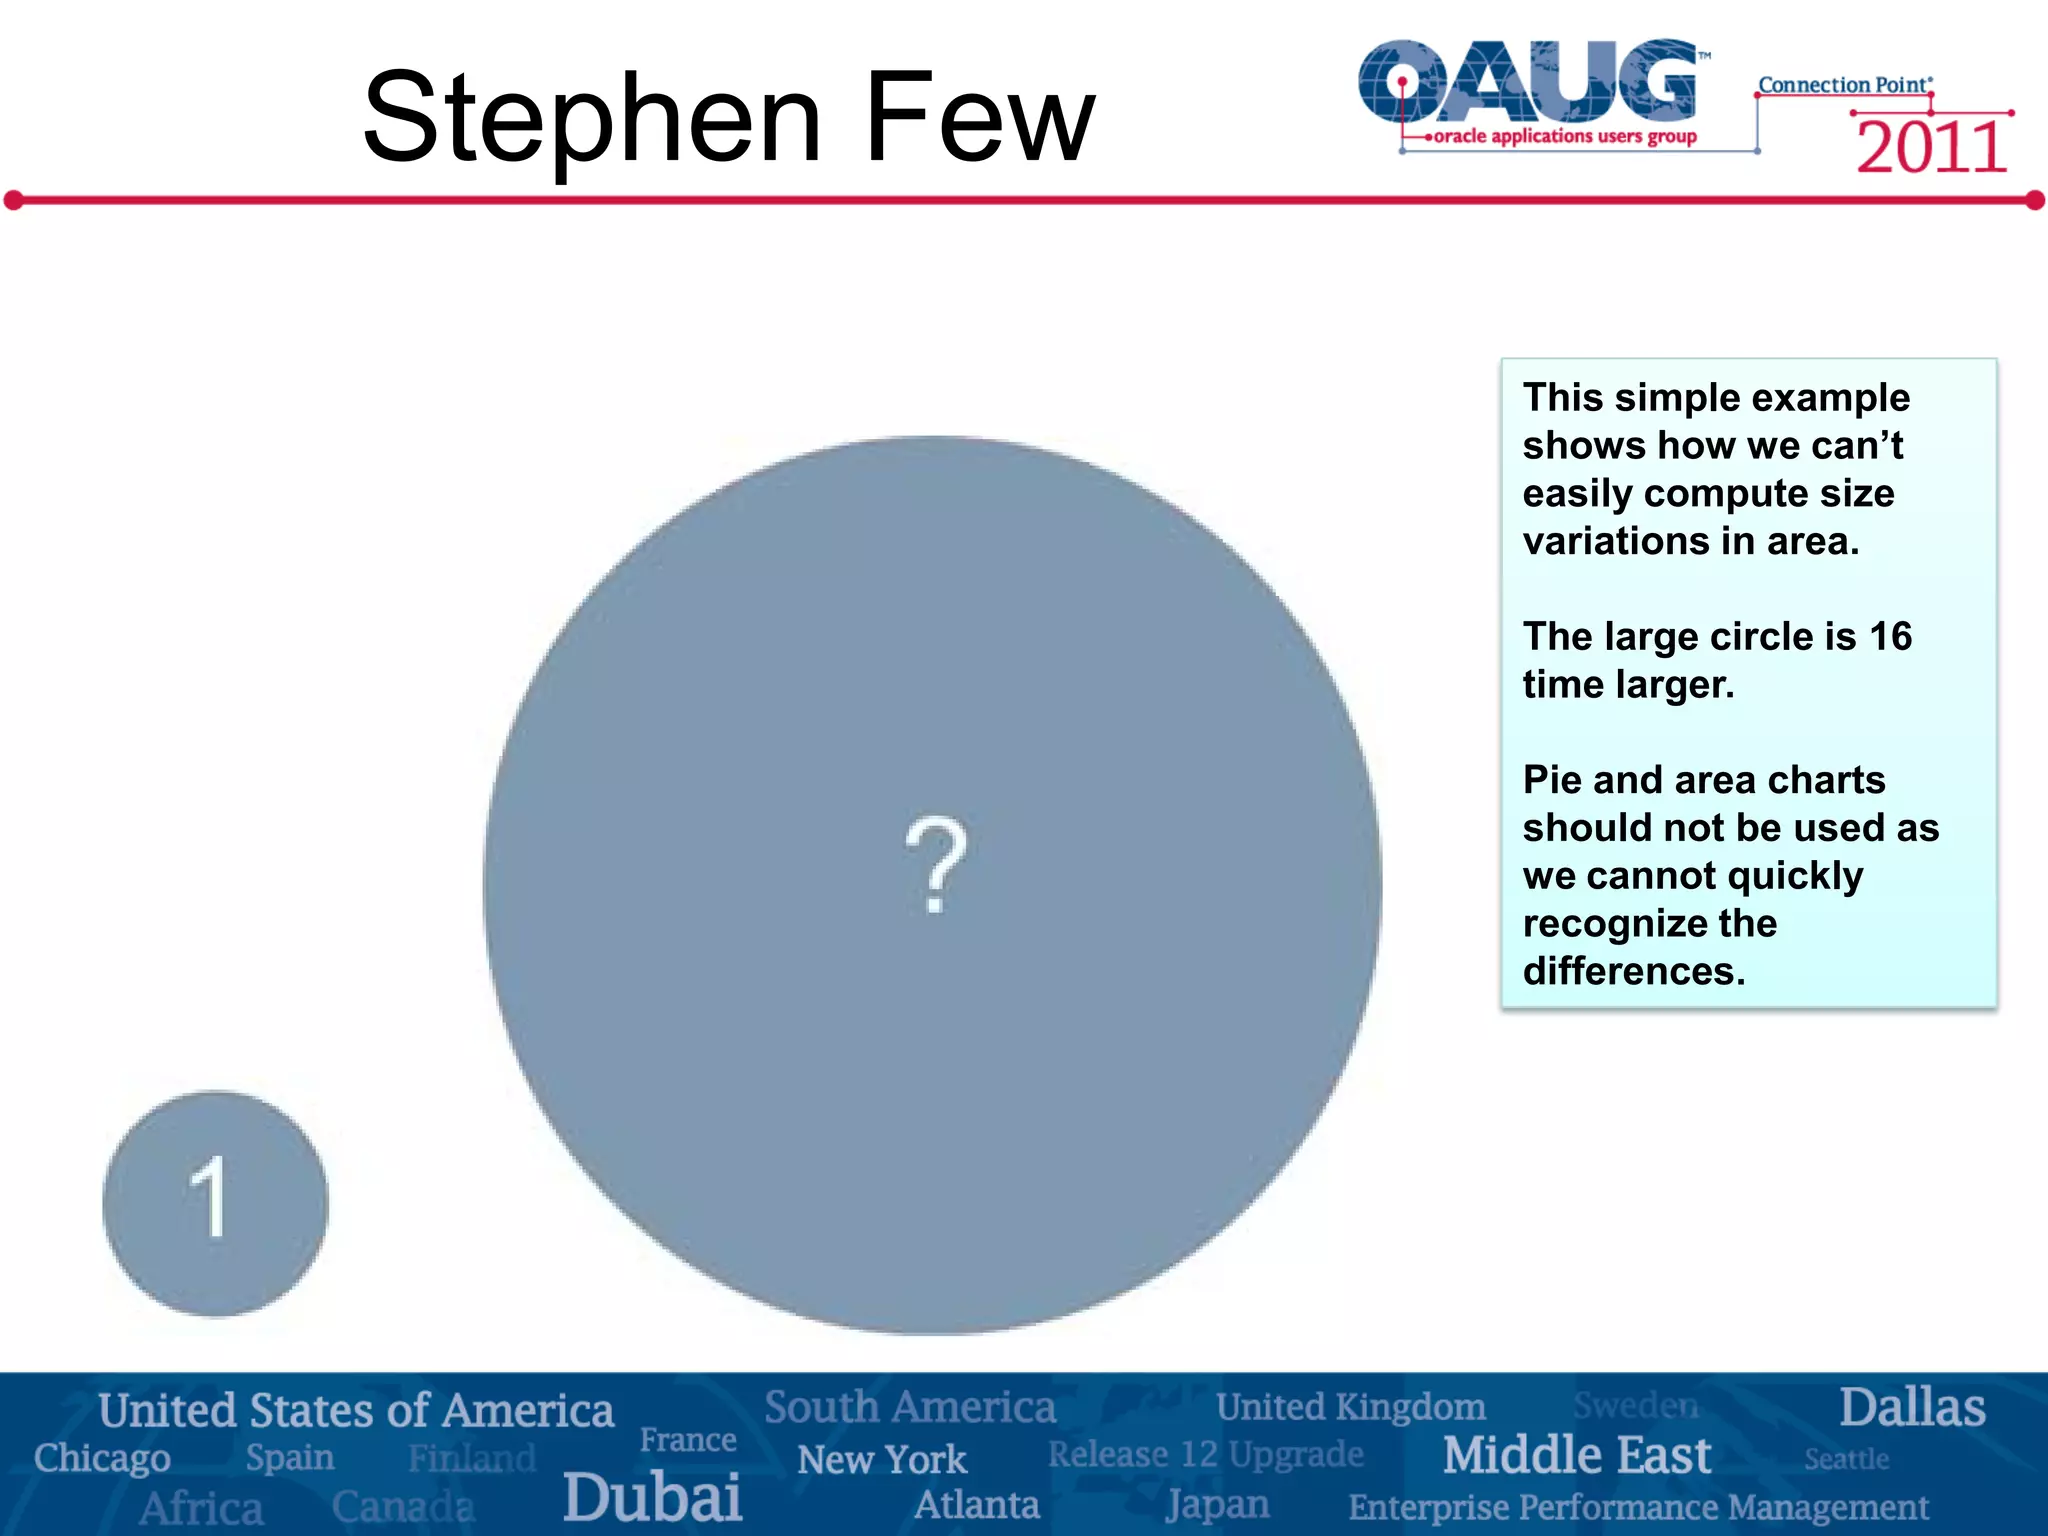
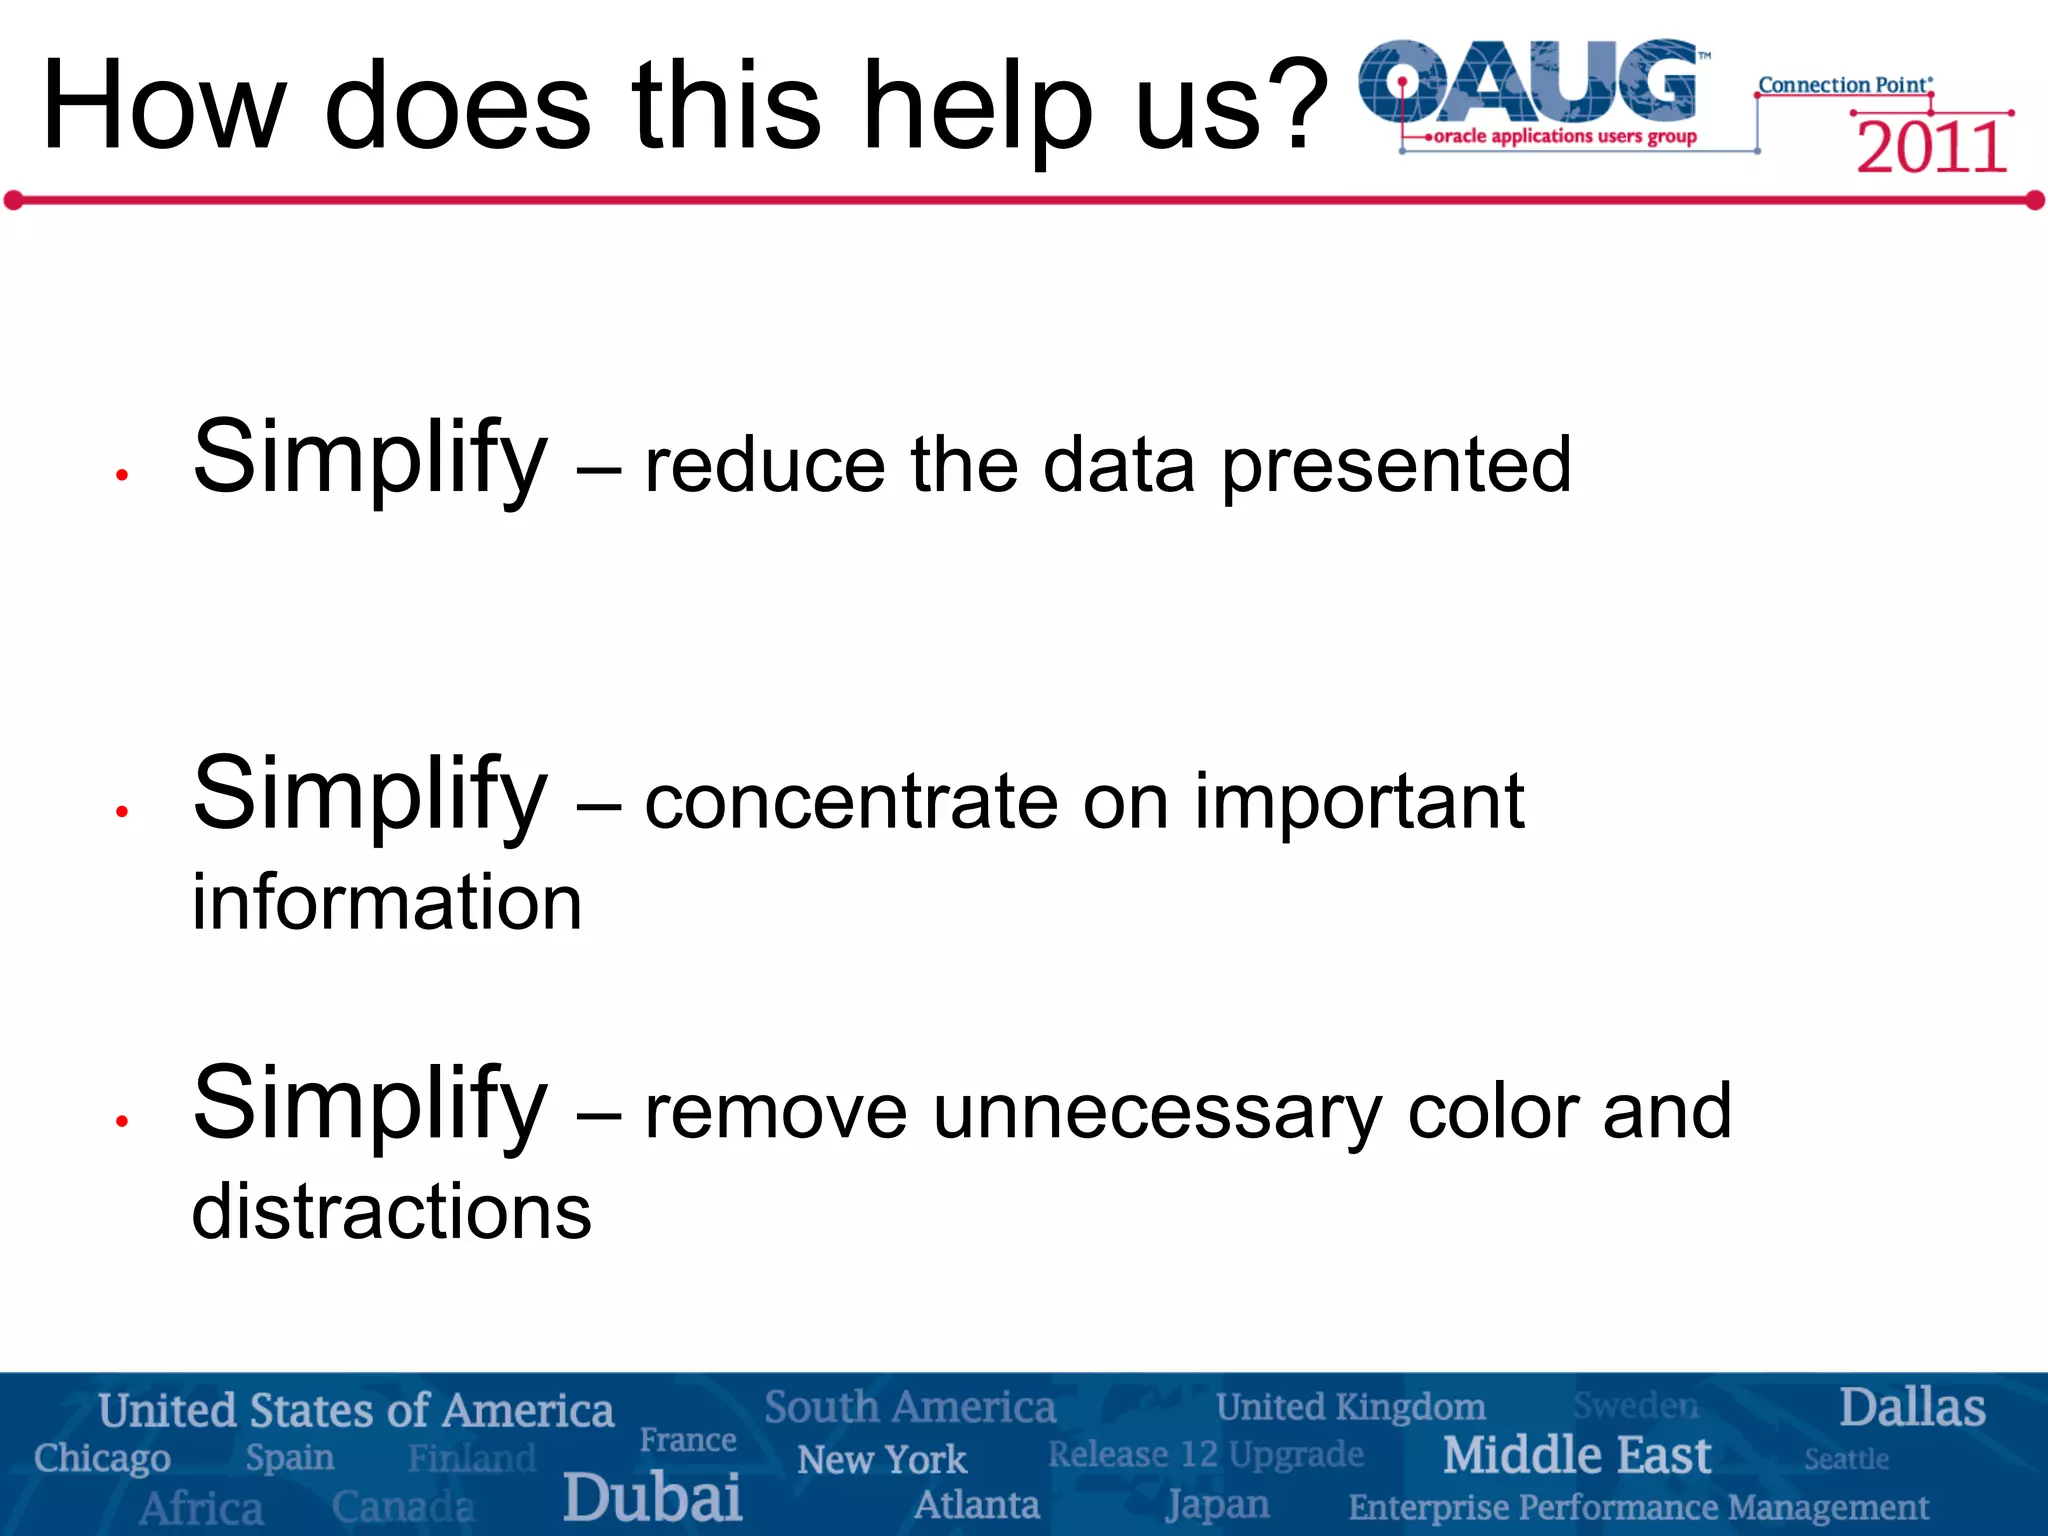
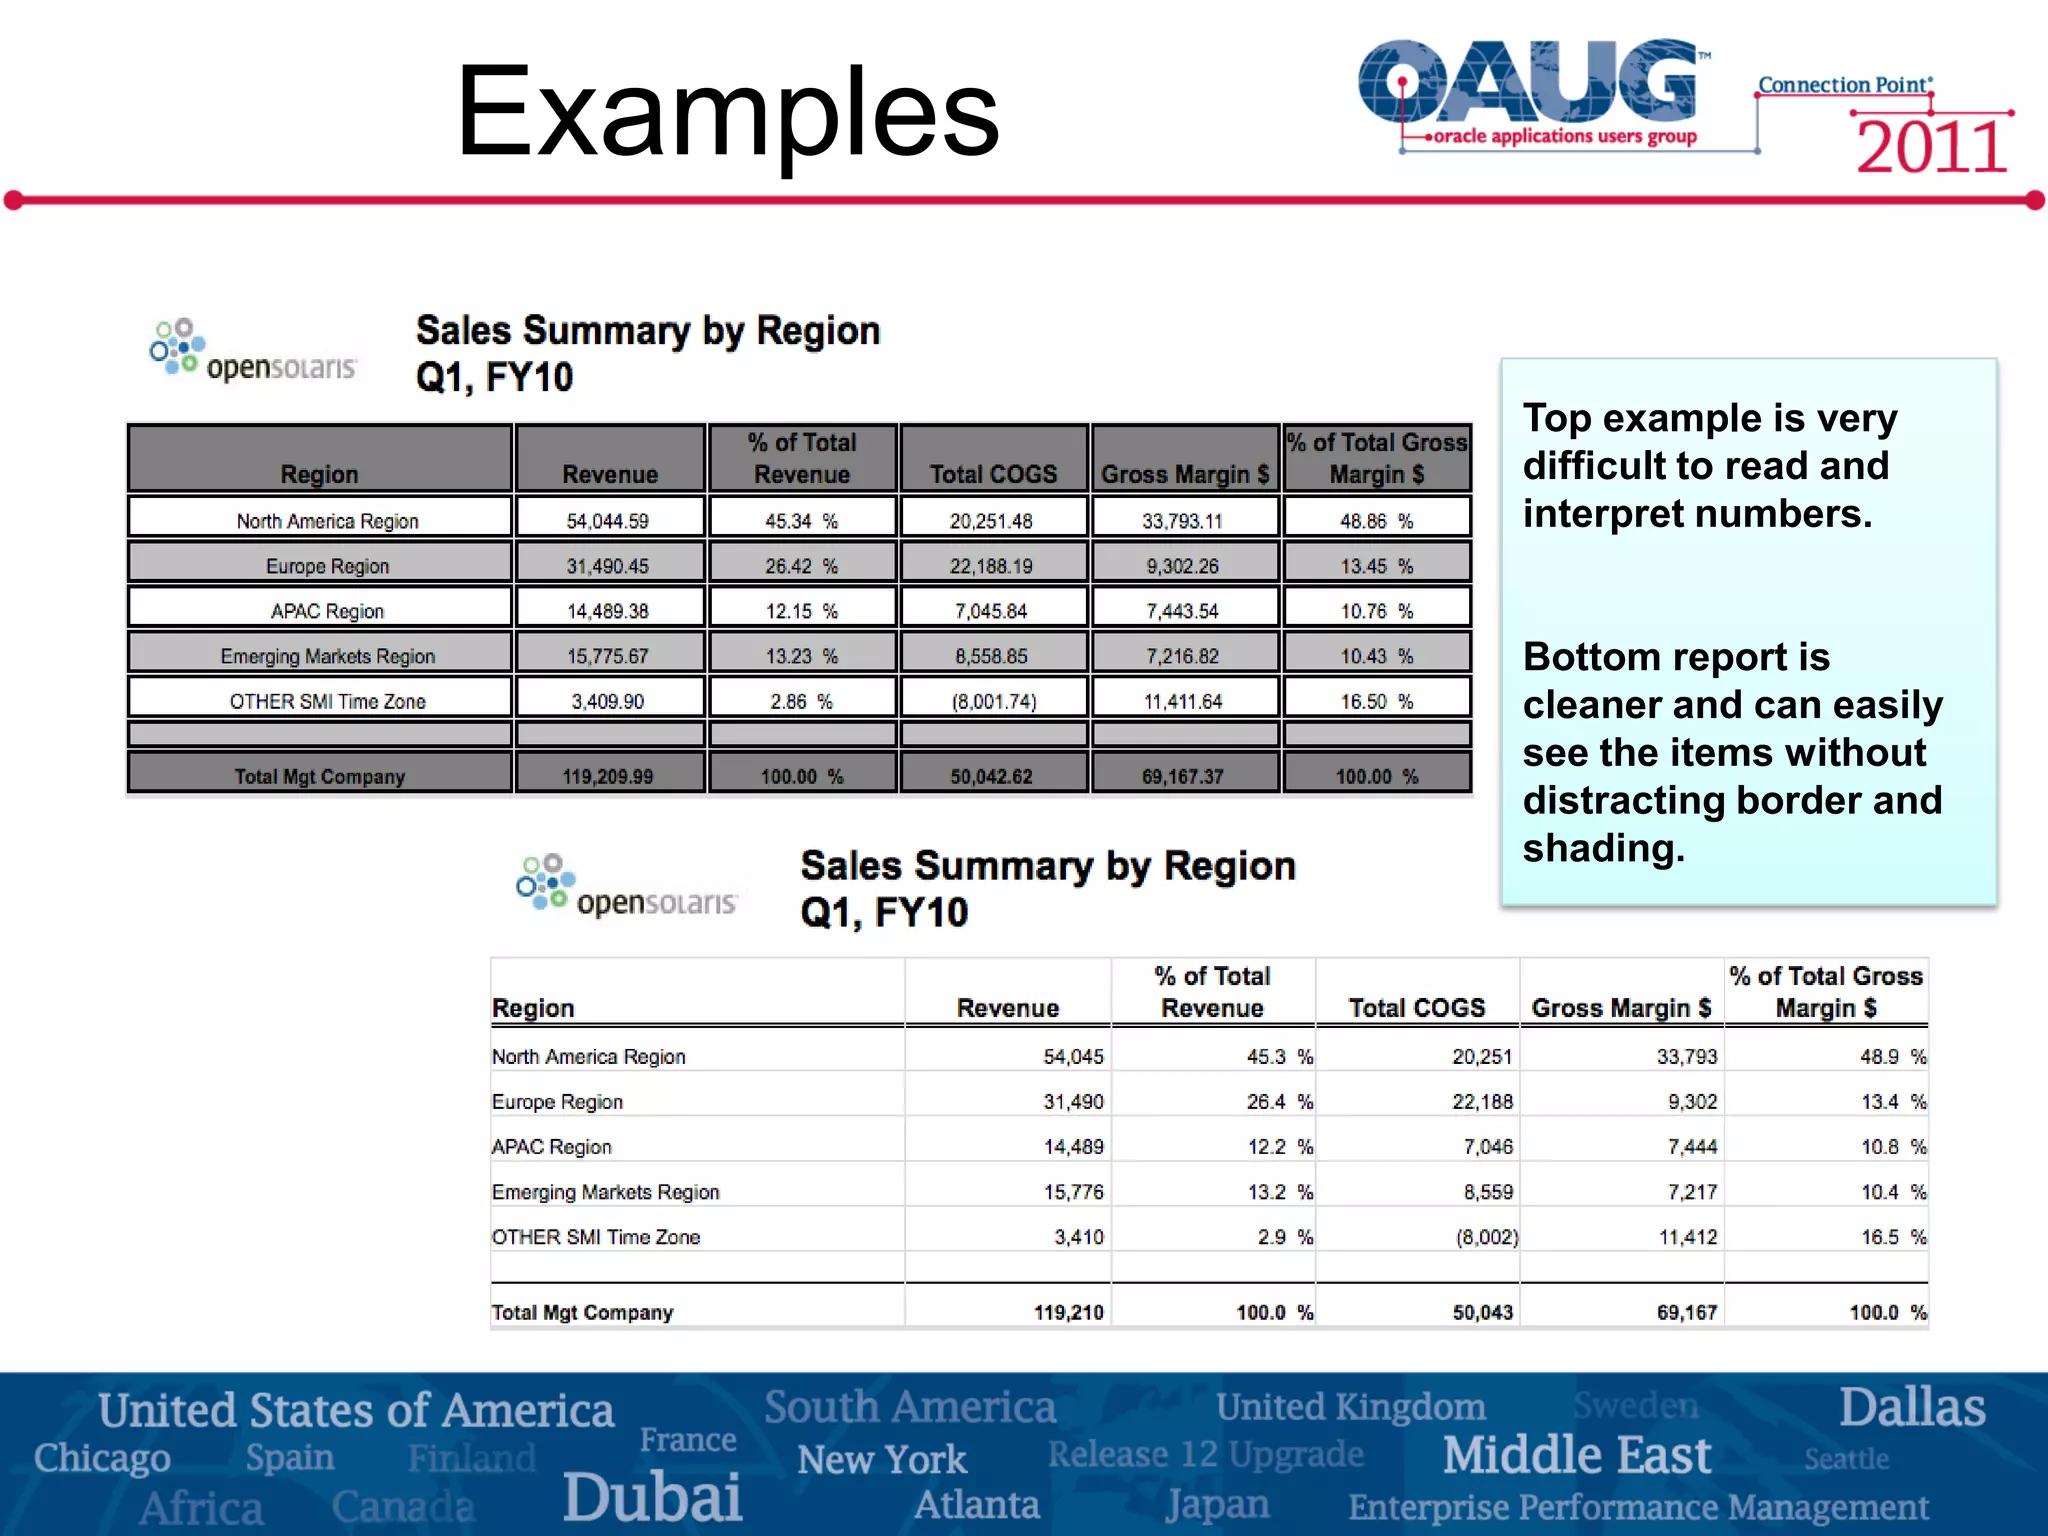
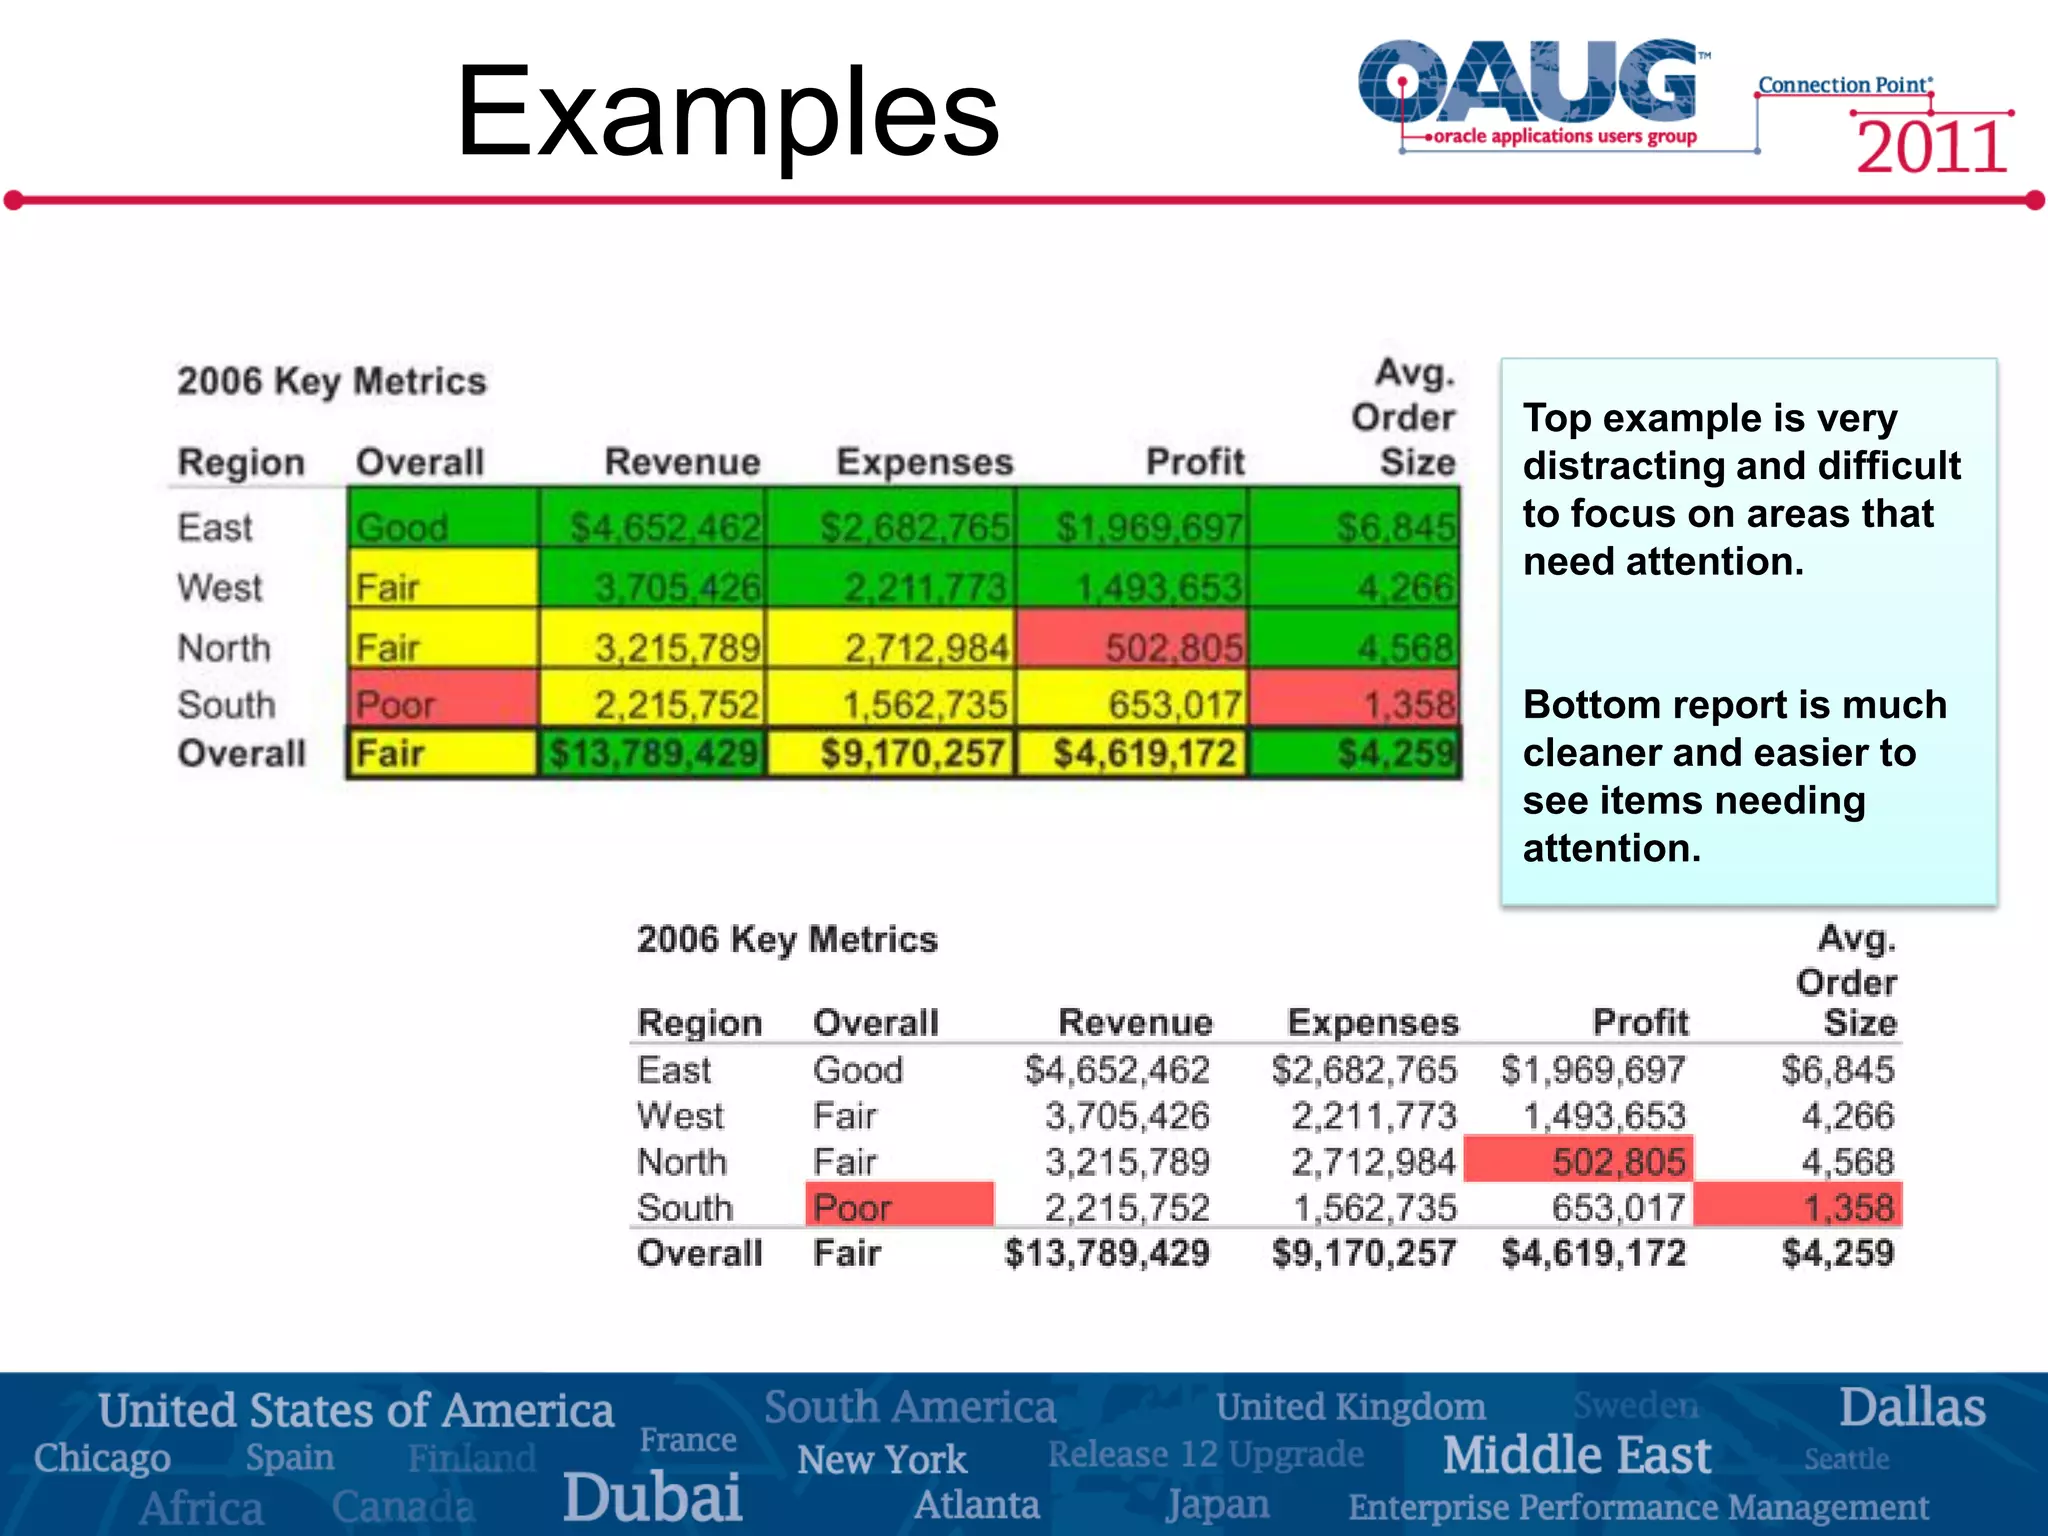
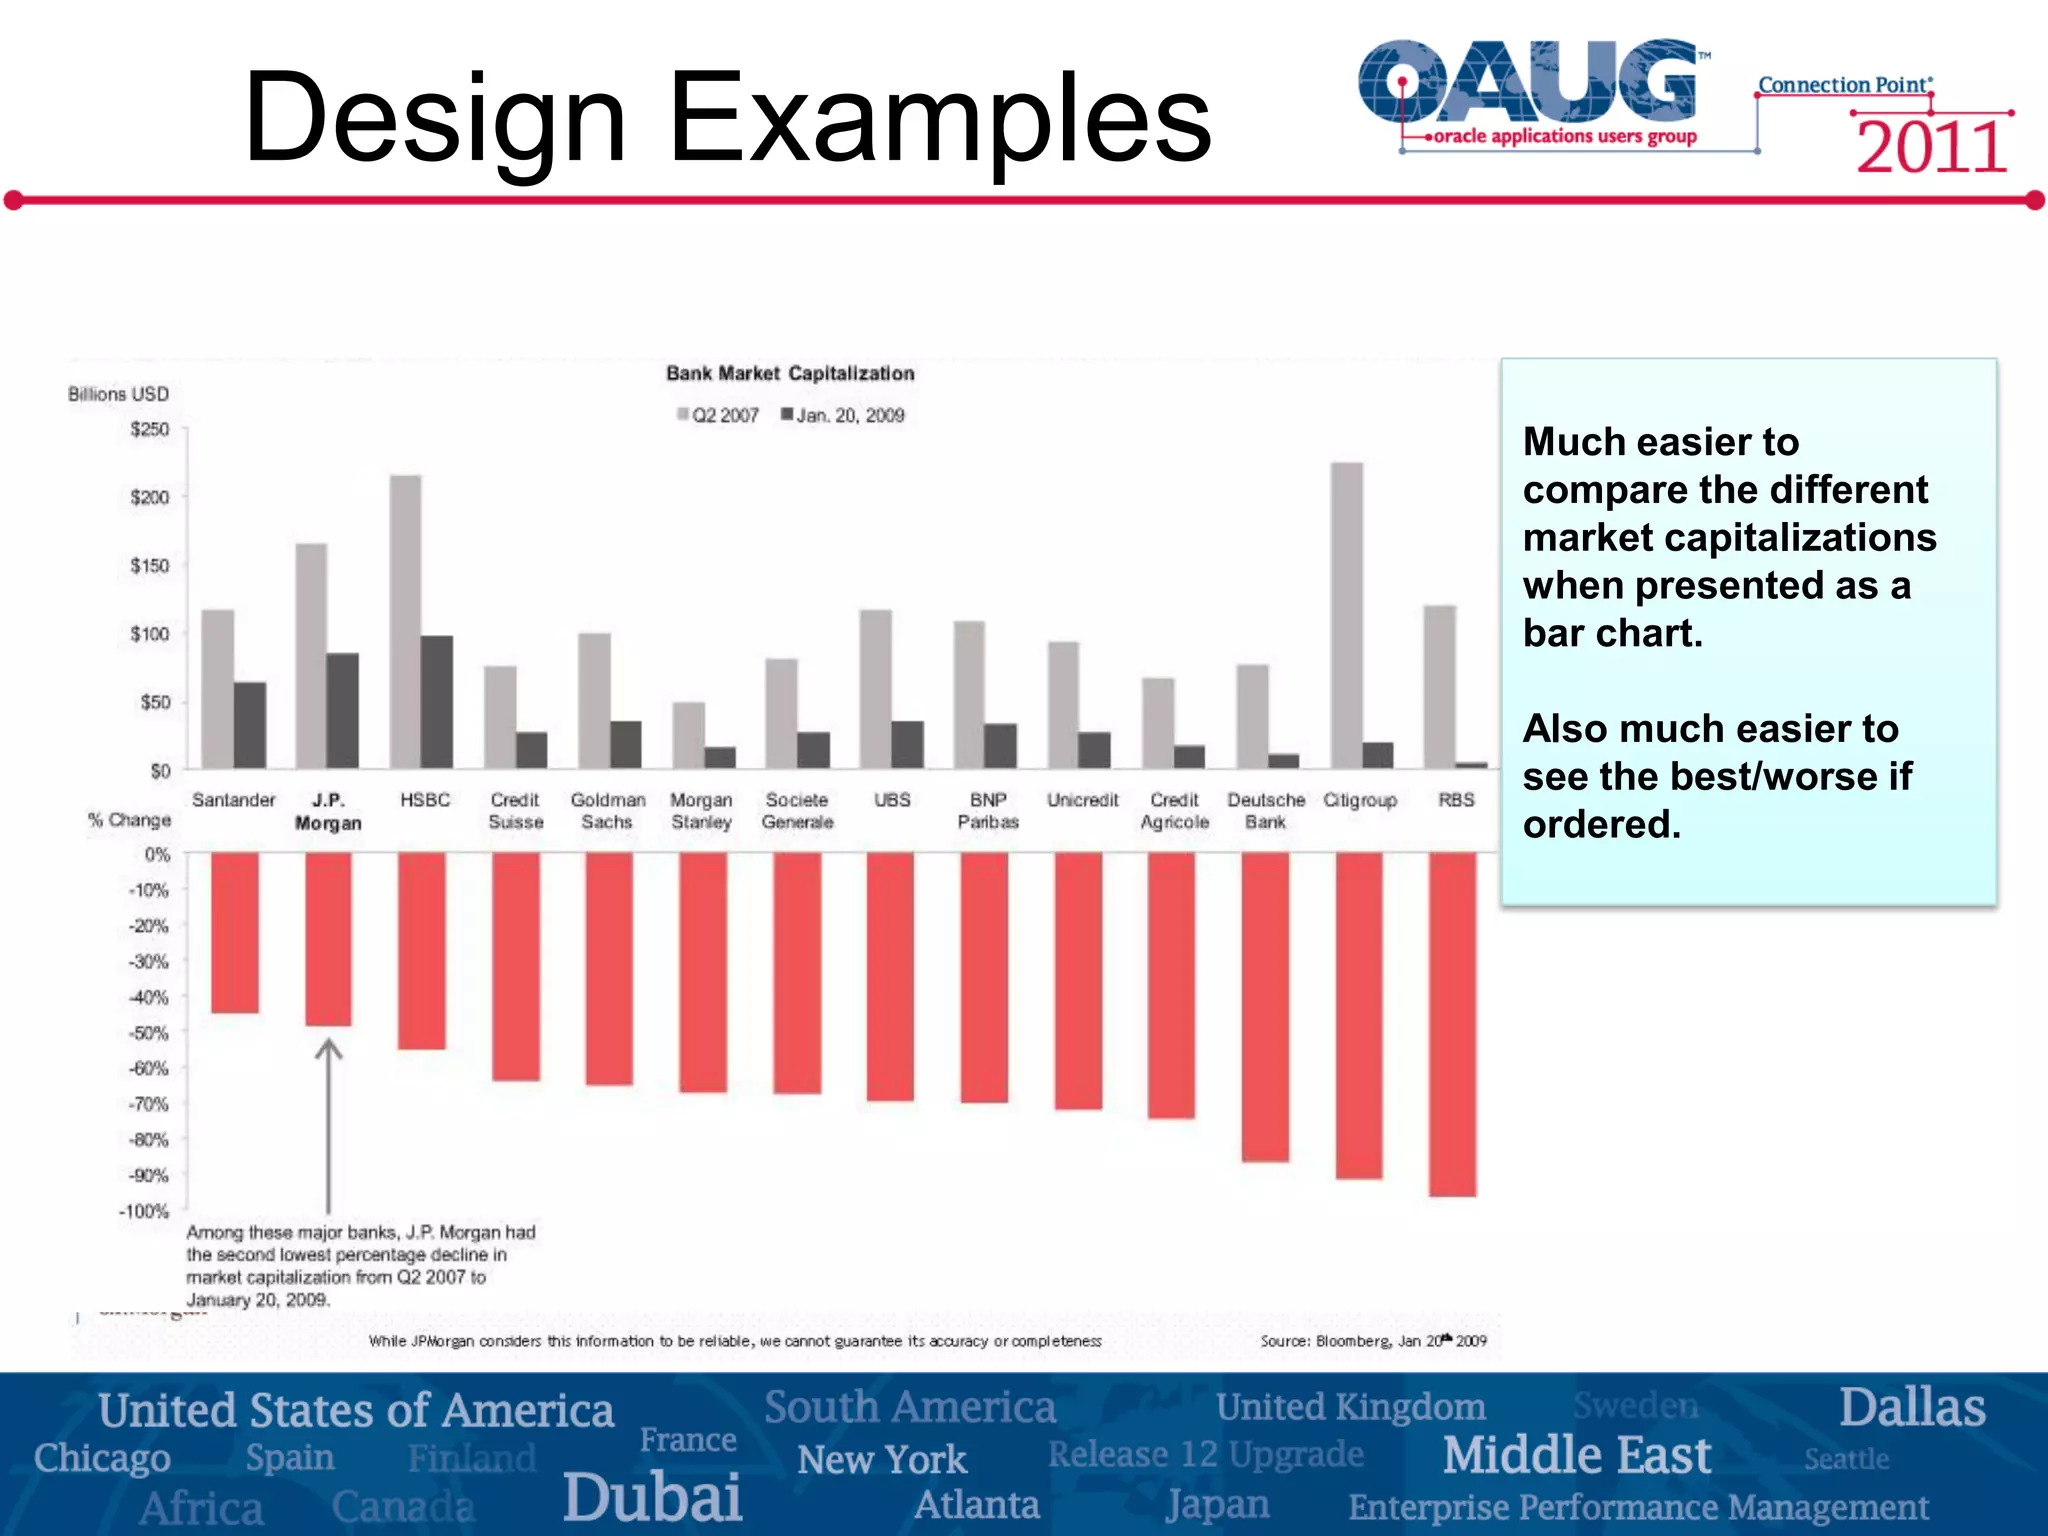
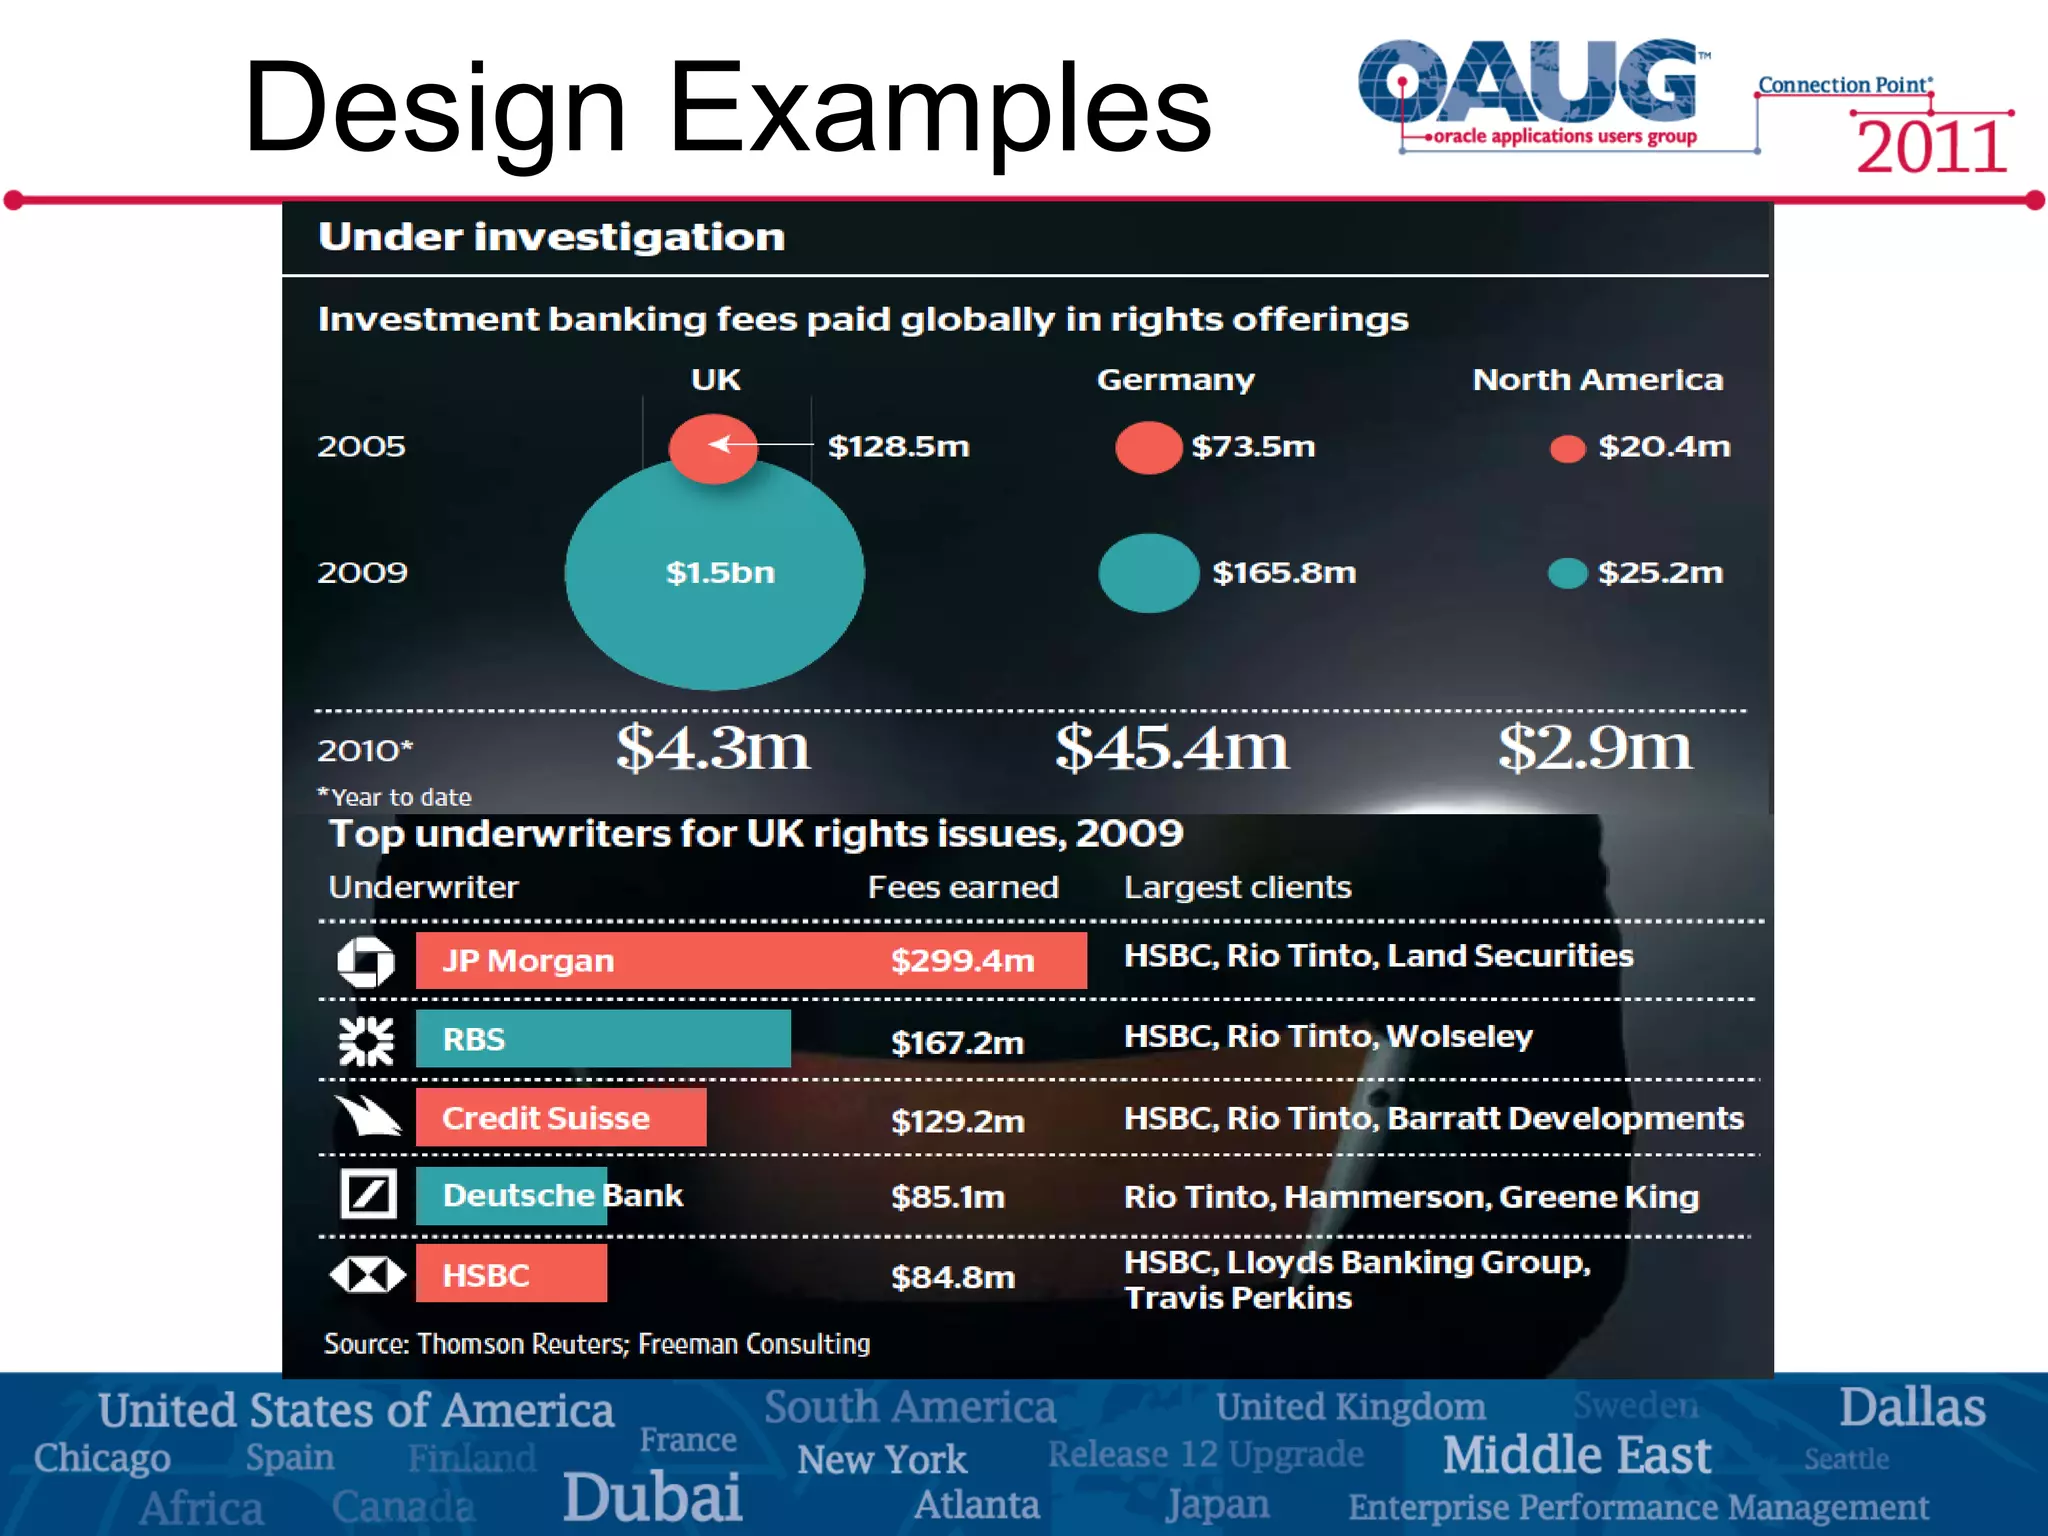
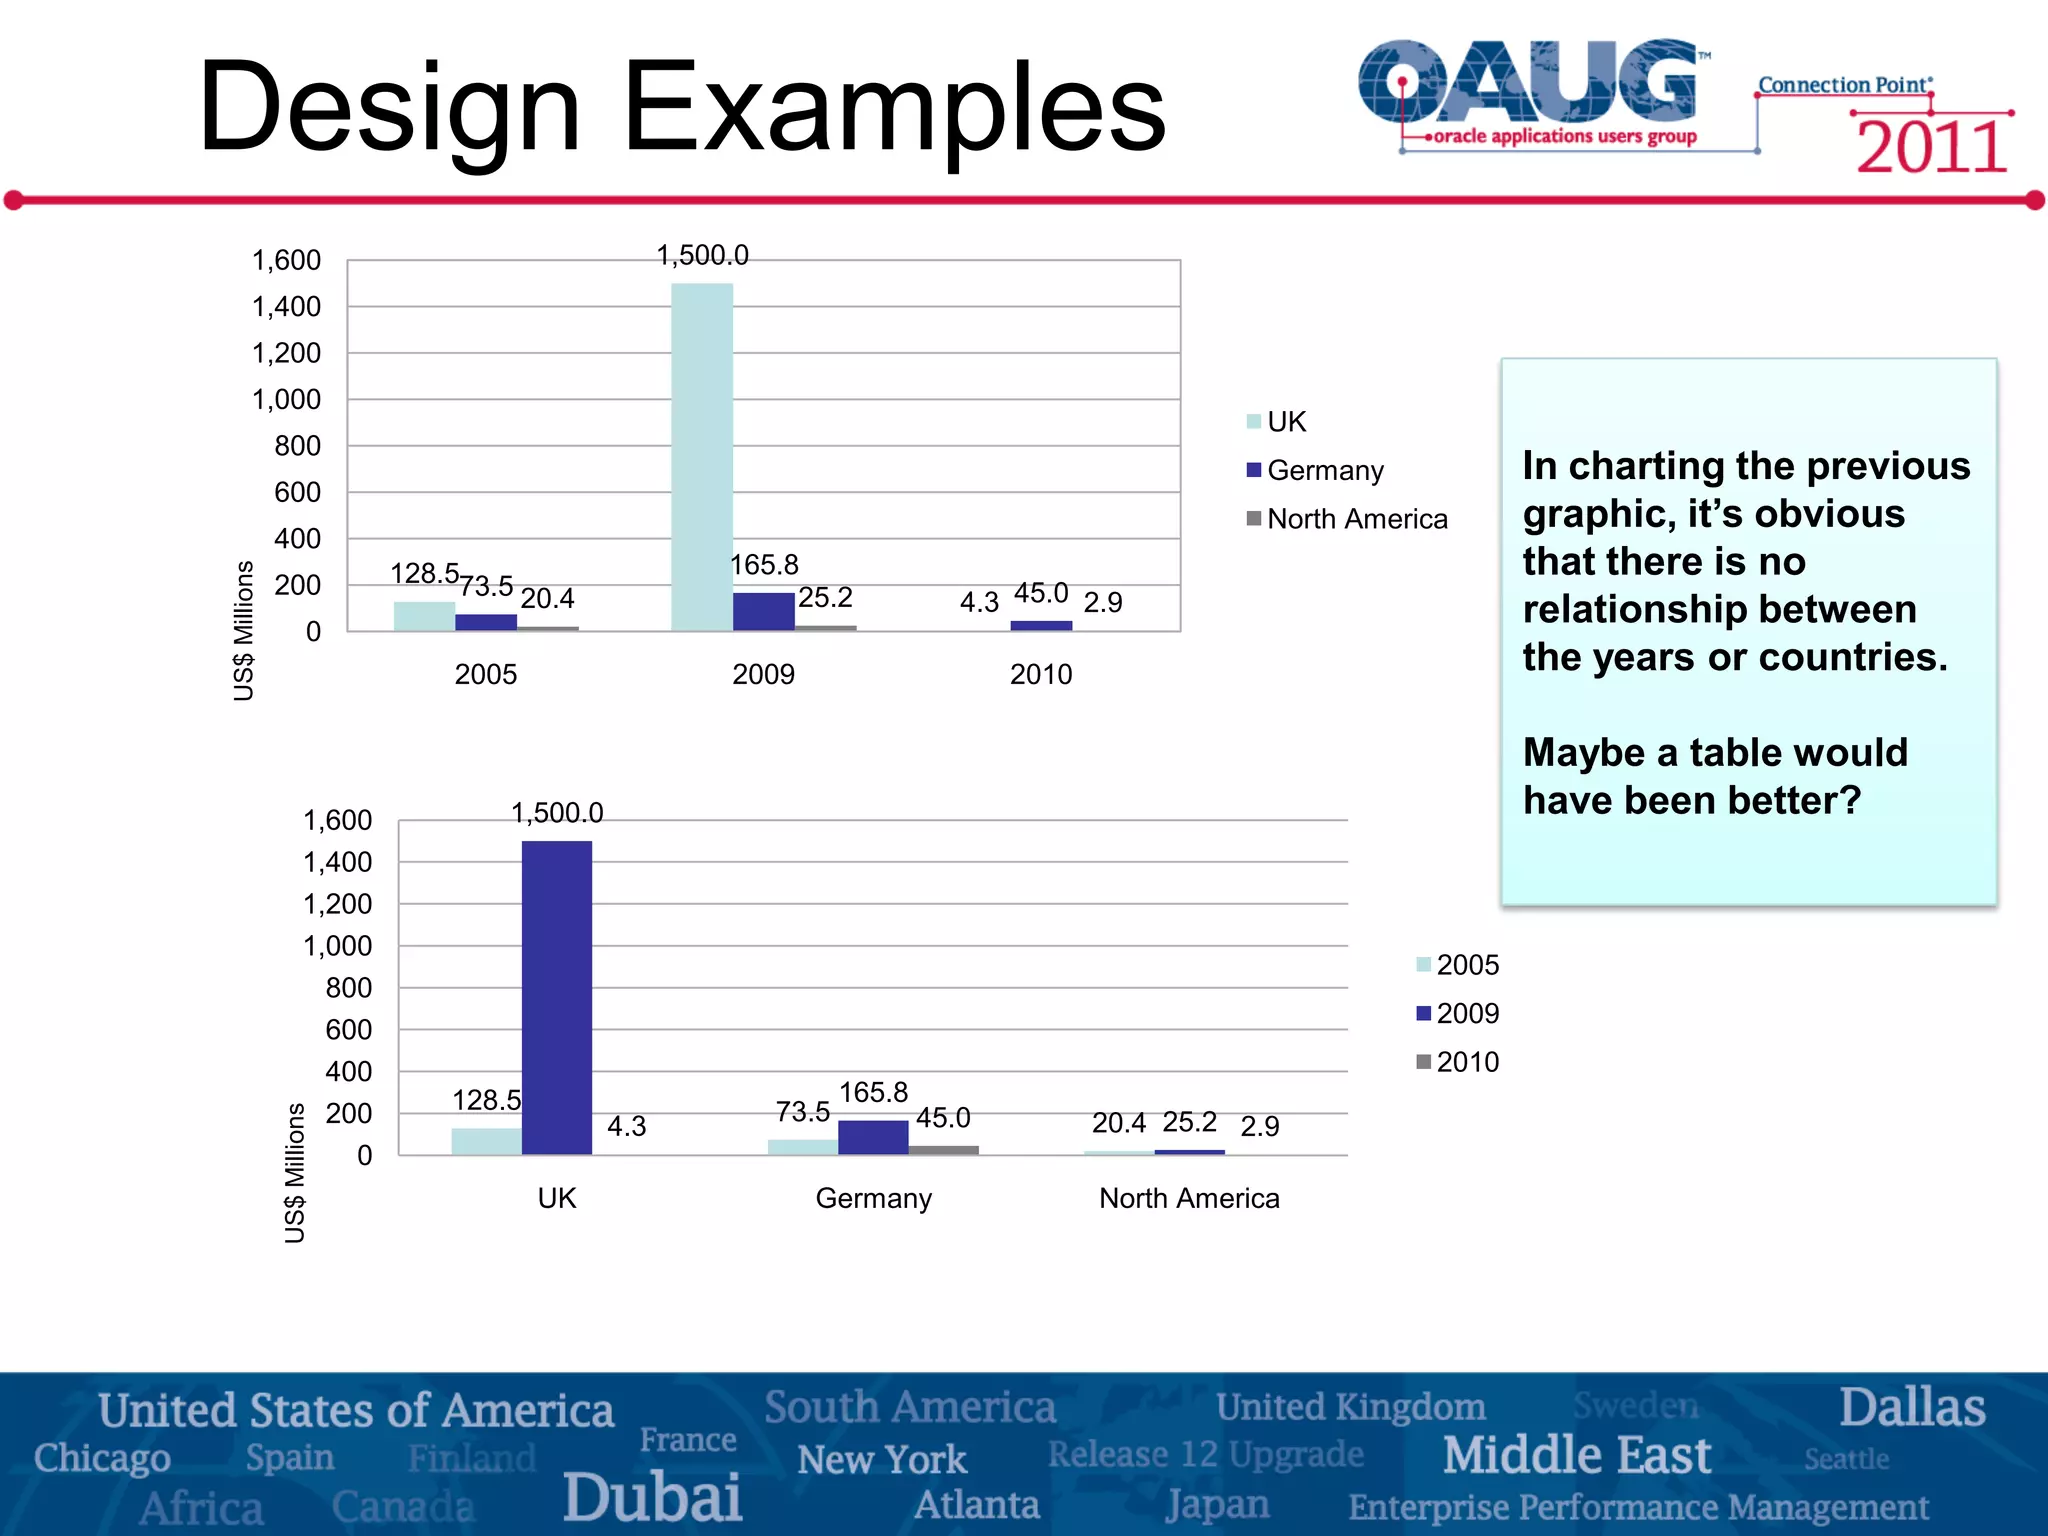
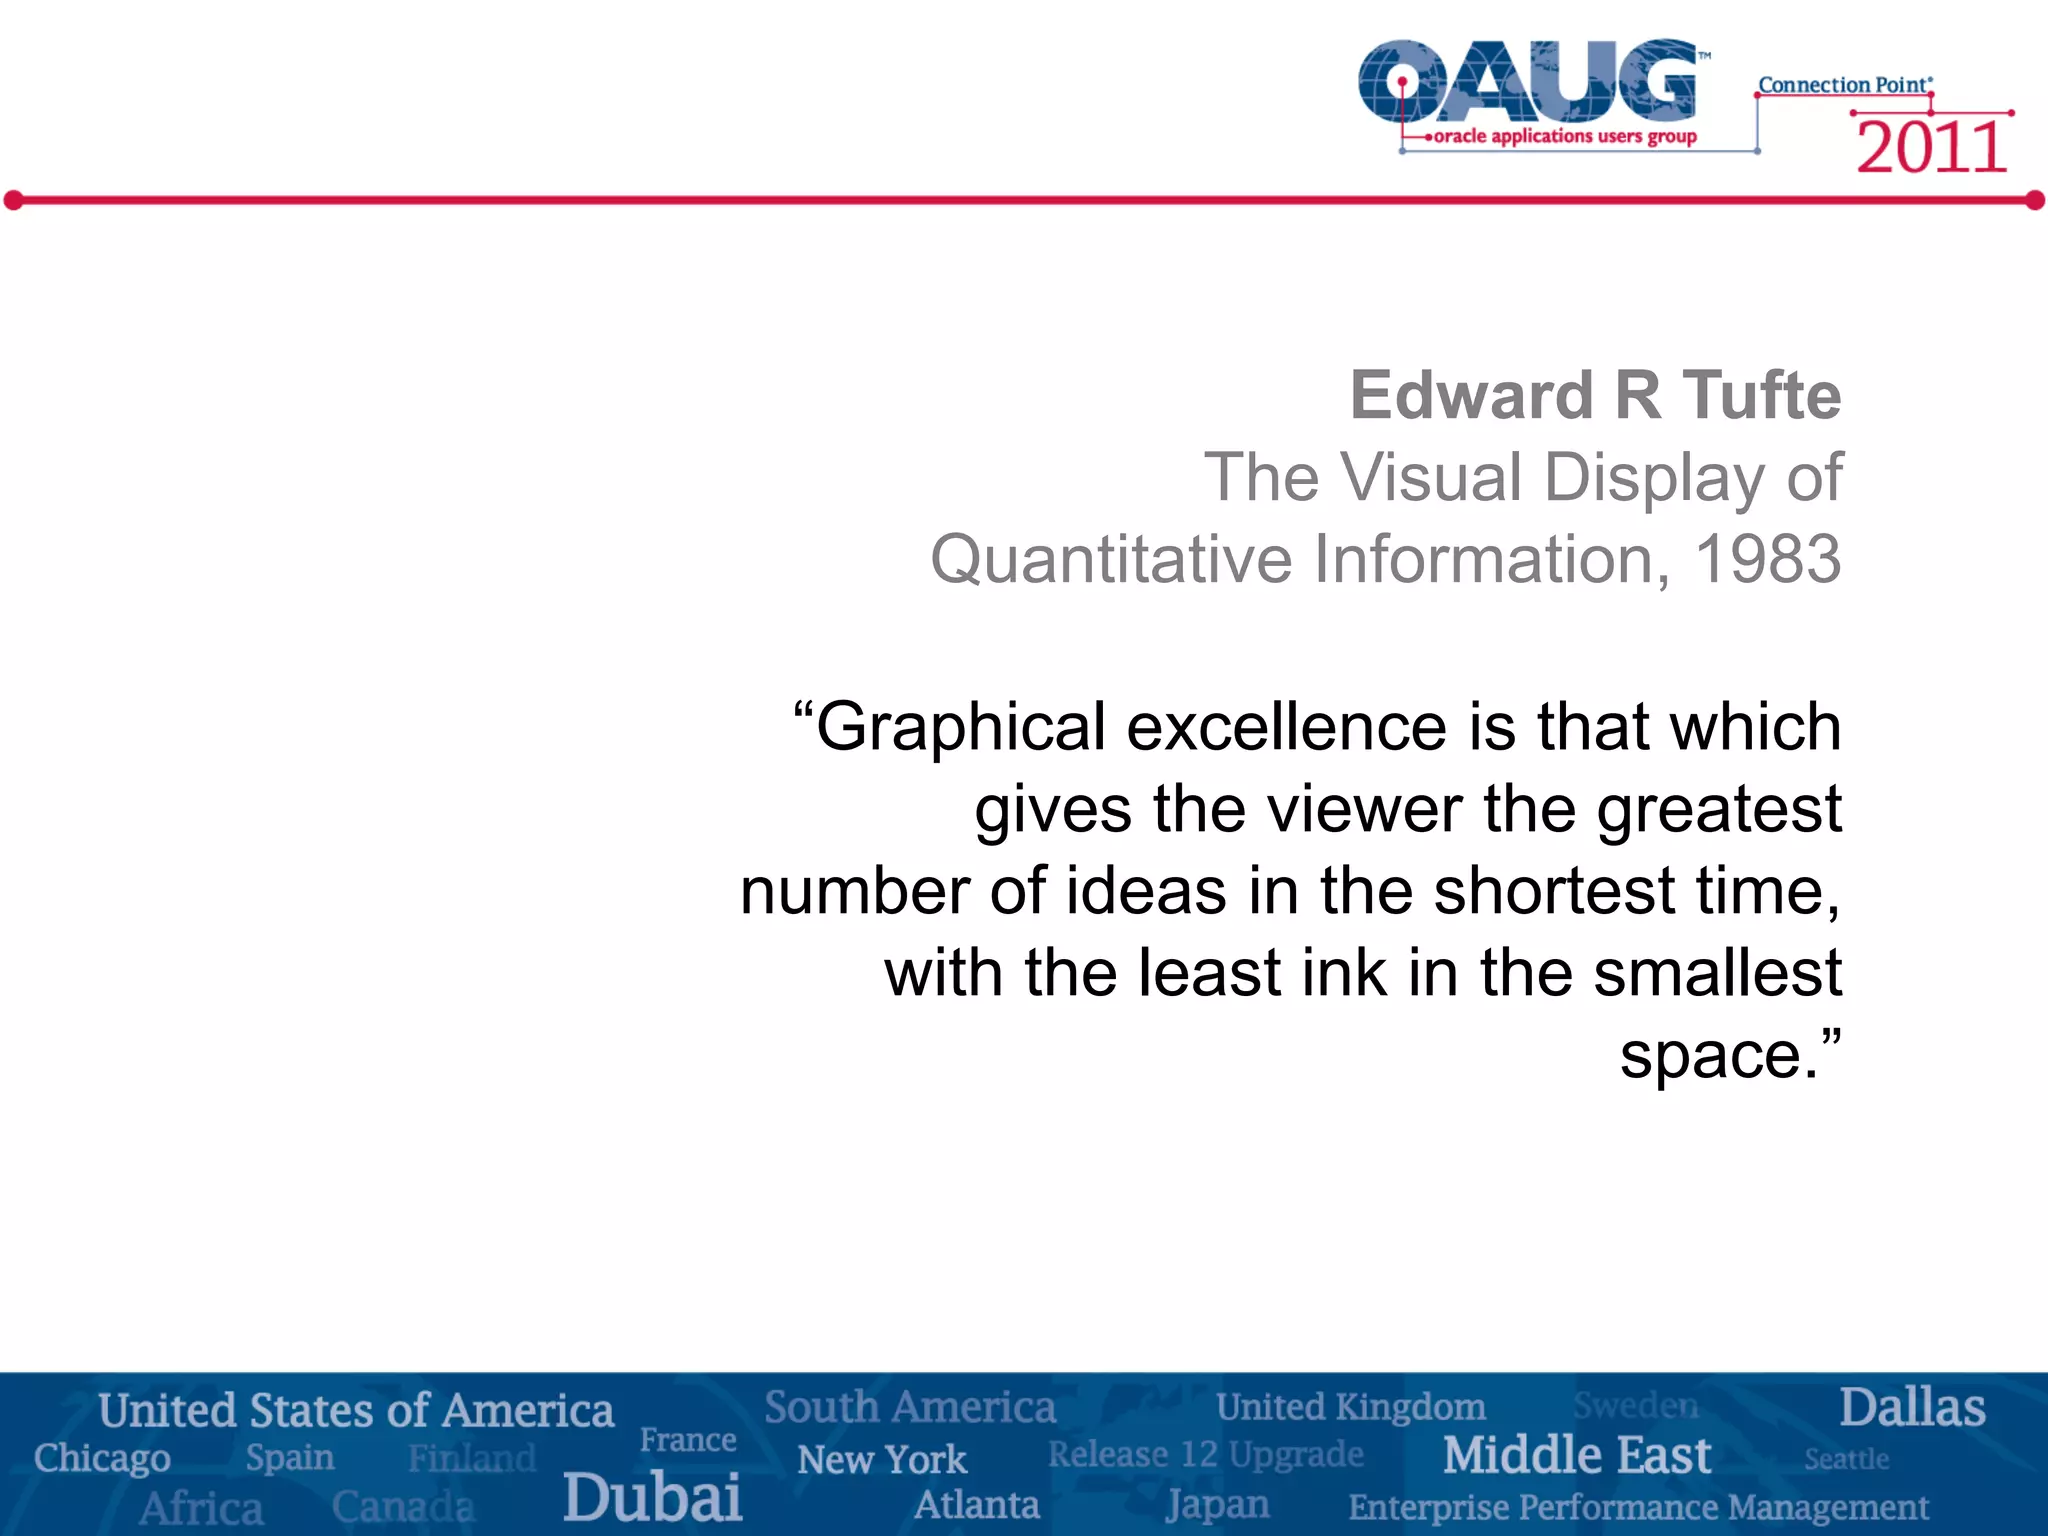
SlideShare a Scribd company logo
Iain Curtain
Edgewater Ranzal


WHY DATA VISUALIZATION IS IMPORTANT
IN DELIVERING ACTIONABLE INSIGHT
Agenda

• Introduction
• Design examples
• Understanding the customer
• What makes good design
• How to apply this to reporting
• Summary and examples
• Questions
About
Customer Sample
Design Examples

                  -   Lots of images
                  -   Attention not drawn
                      to specific items
                  -   Too much color
                  -   Visuals used when
                      charts or data could
                      convey messages
                      better
                  -   Waste of valuable
                      screen real estate
Design Examples

                  -   3-D rendering
                      makes it harder to
                      interpret the values
                  -   Forecasted Units
                      and Dollars lines
                      connect the regions,
                      when they are
                      distinct data points
                  -   Dollars and Year
                      Ago Dollars are
                      stacked, when they
                      are also distinct
                      values
                  -   Excessive use of
                      the word ‘Region’
Design Examples

                  -   Recent example of
                      visuals over
                      substance and
                      meaning
                  -   Very difficult to
                      determine
                      correlation between
                      circle sizes
Design Examples

                  -   Dark images and
                      background distract
                      the viewer
                  -   Cannot determine
                      trends with only 2
                      data points
                  -   Confusing as 2010
                      values are not
                      circles
                  -   Visuals used when
                      charts or data could
                      convey messages
                      better
Customer Maturity

                        Customers are on a
                        reporting journey and
                        determining what their
                        requirements and
                        future plans are
          Scorecards    important in
                        understanding where
                        they are, what their
         Dashboards     needs are and where
                        they think they are
                        going.
         Mgmt Reports   You must satisfy the
                        pre-requisites before
                        climbing up the
          Operations    pyramid.


          Foundation
Customer Maturity
     Areas to grow


                                            Consider 3 different
                                            part of the organization
                                            at different stages of
                                            maturity:
                                            - Finance = Area 1
                                            - Logistics = Area 2
                                            - Manufacturing =
                                                Area 3
Maintain current

  operations
   business


                     Area 1   Area 2   Area 3
User Requirements


•   Talk to users

•   Listen to users

•   Ask why, why, why?
Good design concepts


•   Memory limits

•   Encoding data for rapid perception

•   Gestalt principles of perception
Memory Limits


•   Iconic memory – visual cues, pre-conscious
    /pre-attentive processing

•   Short term memory – conscious
    processing, 3-9 chunks only

•   Long term memory
Data Encoding

                               -   How many 3’s can
                                   you find?


                               -   As there is no
1723957695026398027384956012       encoding of data,
                                   we process
9847536970898726547867925019       sequentially –
                                   attentive processing
2005928976548102985079827158       - very slow!

0297456478597069873940588698
5726327189506972915069871256
2783789
Data Encoding

                               -   7 is the correct
                                   answer

                               -   Much easier to see
                                   when data is in a
1723957695026398027384956012       different color, the
                                   same goes for
9847536970898726547867925019       bolding, size, shape
                                   and orientation
2005928976548102985079827158       changes as well

0297456478597069873940588698
5726327189506972915069871256
2783789
Gestalt Principles

                                Here we see:
               •   Proximity
                                -   2 groups rather than
                                    7 blogs

                                -   2 different sets
                                    within the groups

                                -   2 further groups
               •   Similarity       within the groups


               •   Enclosure
Gestalt Principles

                              Our minds:
             •   Closure      -   Close

                              -   Continue

                              -   Link

                              even though these can
             •   Continuity   be seen as discrete
                              items.


             •   Connection
Applying concepts


•   Focus on the value add you are showing by organising
    and minimising the data shown.

•   Arrange information in a way that makes sense, making
    sure that the important data stands out.
Edward R Tufte


•   Tufte provided lots of thought around how we view and
    perceive data
Data Ink Ratio


•   Key concepts: reduce non data ink from graphics, focus
    on the values

•   Reduce graphic paraphernalia (chartjunk)
Chartjunk


•   Which of these has clutter
    and unnecessary items?

•   Which is easier to see the
    data?
Colin Ware

                             Colin Ware
              Information Visualization -
             Perception for Design, 2000

              “We can easily see patterns
     presented in certain ways, but if they
         are presented in other ways they
                        become invisible.”
Colin Ware

                    We distinguish the
                    items if different in
                    terms of:
        •   Color   -   Color – either hue or
                        intensity

                    -   Form – can also be
                        size, shape,
                        orientation


        •   Form
Colin Ware

                       We distinguish the
                       items if different in
                       terms of:

        •   Position   -   Position

                       -   Motion:
                           flashing/moving
                           should only be used
                           for real time data or
                           issues requiring
                           immediate attention


        •   Motion
Stephen Few


•   Combined previous theories and melded with current
    designs and dashboard and communication ideas
Stephen Few
              This simple example
              shows how we can’t
              easily compute size
              variations in area.

              The large circle is 16
              time larger.

              Pie and area charts
              should not be used as
              we cannot quickly
              recognize the
              differences.
How does this help us?

 •   Simplify – reduce the data presented


 •   Simplify – concentrate on important
     information

 •   Simplify – remove unnecessary color and
     distractions
Examples

           Top example is very
           difficult to read and
           interpret numbers.


           Bottom report is
           cleaner and can easily
           see the items without
           distracting border and
           shading.
Examples

           Top example is very
           distracting and difficult
           to focus on areas that
           need attention.


           Bottom report is much
           cleaner and easier to
           see items needing
           attention.
Design Examples

                  Much easier to
                  compare the different
                  market capitalizations
                  when presented as a
                  bar chart.

                  Also much easier to
                  see the best/worse if
                  ordered.
Design Examples
Design Examples
        1,600                                           1,500.0
        1,400
        1,200
        1,000
                                                                                                           UK
               800
                                                                                                           Germany            In charting the previous
               600
                                                                                                           North America      graphic, it’s obvious
               400
                                                             165.8                                                            that there is no
US$ Millions


               200             128.573.5
                                         20.4                     25.2              4.3 45.0 2.9                              relationship between
                         0
                                   2005                      2009                       2010                                  the years or countries.

                                                                                                                              Maybe a table would
                       1,600            1,500.0                                                                               have been better?
                       1,400
                       1,200
                       1,000
                                                                                                                       2005
                         800
                                                                                                                       2009
                         600
                         400                                                                                           2010
                                   128.5                                 165.8
                                                                  73.5
               US$ Millions


                         200                      4.3                            45.0          20.4 25.2 2.9
                           0
                                           UK                       Germany                    North America
Edward R Tufte
               The Visual Display of
      Quantitative Information, 1983

 “Graphical excellence is that which
       gives the viewer the greatest
number of ideas in the shortest time,
    with the least ink in the smallest
                               space.”
Iain Curtain
Consultant
iain.curtain@ranzal.com
http://thinsliced.wordpress.com/
202 683 0874
www.ranzal.com

More Related Content

Similar to Why Data Visualization is Important in Delivering Actionable Insight

ExactTarget & Crown Audience Builder
ExactTarget & Crown Audience BuilderExactTarget & Crown Audience Builder
ExactTarget & Crown Audience Builder
Crown
 
Visual Attention
Visual Attention Visual Attention
Visual Attention
Sefat Chowdhury
 
Envisioning Experience
Envisioning ExperienceEnvisioning Experience
Envisioning Experience
Stephanie Sansoucie
 
Surrey University Presentation
Surrey University PresentationSurrey University Presentation
Surrey University Presentation
dseConsulting
 
Andrii Belas "Modern approaches to working with categorical data in machine l...
Andrii Belas "Modern approaches to working with categorical data in machine l...Andrii Belas "Modern approaches to working with categorical data in machine l...
Andrii Belas "Modern approaches to working with categorical data in machine l...
Lviv Startup Club
 
Power View from the Data Visualisation Perspective
Power View from the Data Visualisation PerspectivePower View from the Data Visualisation Perspective
Power View from the Data Visualisation Perspective
Microsoft TechNet - Belgium and Luxembourg
 
Shutterfly and Dell: Driving B-to-B ROI through Directed Content
Shutterfly and Dell: Driving B-to-B ROI through Directed ContentShutterfly and Dell: Driving B-to-B ROI through Directed Content
Shutterfly and Dell: Driving B-to-B ROI through Directed Content
Vivastream
 
Inhibitors to Information Sharing
Inhibitors to Information SharingInhibitors to Information Sharing
Inhibitors to Information Sharing
Walter Kitchenman
 
Session 1
Session 1Session 1
Session 1
vivek_shaw
 
Condesign powerful portfolio planning
Condesign   powerful portfolio planningCondesign   powerful portfolio planning
Condesign powerful portfolio planning
Svenskt Projektforum
 
Is Your Marketing Database "Model Ready"?
Is Your Marketing Database "Model Ready"?Is Your Marketing Database "Model Ready"?
Is Your Marketing Database "Model Ready"?
Vivastream
 
Data Warehouse Logical Design Guide
Data Warehouse Logical Design GuideData Warehouse Logical Design Guide
Data Warehouse Logical Design Guide
Andy Yuan
 
SQL Server and Azure Mobile Business Intelligence
SQL Server and Azure Mobile Business IntelligenceSQL Server and Azure Mobile Business Intelligence
SQL Server and Azure Mobile Business Intelligence
Jen Stirrup
 
Is Your Marketing Database "Model Ready"?
Is Your Marketing Database "Model Ready"?Is Your Marketing Database "Model Ready"?
Is Your Marketing Database "Model Ready"?
Vivastream
 
Data Visualization dataviz superpower
Data Visualization dataviz superpowerData Visualization dataviz superpower
Data Visualization dataviz superpower
Jen Stirrup
 
Data to Dollars™ - Practical Analytics in the Big Data Era Jaime Fitzgerald A...
Data to Dollars™ - Practical Analytics in the Big Data Era Jaime Fitzgerald A...Data to Dollars™ - Practical Analytics in the Big Data Era Jaime Fitzgerald A...
Data to Dollars™ - Practical Analytics in the Big Data Era Jaime Fitzgerald A...
Fitzgerald Analytics, Inc.
 
IBM Innovate 2010 - Case Study Presentation 1007 Final W Notes
IBM Innovate 2010 - Case Study Presentation   1007 Final W NotesIBM Innovate 2010 - Case Study Presentation   1007 Final W Notes
IBM Innovate 2010 - Case Study Presentation 1007 Final W Notes
garyrubinstein
 
Data visualization
Data visualizationData visualization
Data visualization
Scott Howell III
 
Business intelligence for the postal operator
Business intelligence for the postal operatorBusiness intelligence for the postal operator
Business intelligence for the postal operator
decision/analysis partners LLC
 
ETE 2013: Going Big with Big Data...one step at a time
ETE 2013:  Going Big with Big Data...one step at a timeETE 2013:  Going Big with Big Data...one step at a time
ETE 2013: Going Big with Big Data...one step at a time
Anita Andrews
 

Similar to Why Data Visualization is Important in Delivering Actionable Insight (20)

ExactTarget & Crown Audience Builder
ExactTarget & Crown Audience BuilderExactTarget & Crown Audience Builder
ExactTarget & Crown Audience Builder
 
Visual Attention
Visual Attention Visual Attention
Visual Attention
 
Envisioning Experience
Envisioning ExperienceEnvisioning Experience
Envisioning Experience
 
Surrey University Presentation
Surrey University PresentationSurrey University Presentation
Surrey University Presentation
 
Andrii Belas "Modern approaches to working with categorical data in machine l...
Andrii Belas "Modern approaches to working with categorical data in machine l...Andrii Belas "Modern approaches to working with categorical data in machine l...
Andrii Belas "Modern approaches to working with categorical data in machine l...
 
Power View from the Data Visualisation Perspective
Power View from the Data Visualisation PerspectivePower View from the Data Visualisation Perspective
Power View from the Data Visualisation Perspective
 
Shutterfly and Dell: Driving B-to-B ROI through Directed Content
Shutterfly and Dell: Driving B-to-B ROI through Directed ContentShutterfly and Dell: Driving B-to-B ROI through Directed Content
Shutterfly and Dell: Driving B-to-B ROI through Directed Content
 
Inhibitors to Information Sharing
Inhibitors to Information SharingInhibitors to Information Sharing
Inhibitors to Information Sharing
 
Session 1
Session 1Session 1
Session 1
 
Condesign powerful portfolio planning
Condesign   powerful portfolio planningCondesign   powerful portfolio planning
Condesign powerful portfolio planning
 
Is Your Marketing Database "Model Ready"?
Is Your Marketing Database "Model Ready"?Is Your Marketing Database "Model Ready"?
Is Your Marketing Database "Model Ready"?
 
Data Warehouse Logical Design Guide
Data Warehouse Logical Design GuideData Warehouse Logical Design Guide
Data Warehouse Logical Design Guide
 
SQL Server and Azure Mobile Business Intelligence
SQL Server and Azure Mobile Business IntelligenceSQL Server and Azure Mobile Business Intelligence
SQL Server and Azure Mobile Business Intelligence
 
Is Your Marketing Database "Model Ready"?
Is Your Marketing Database "Model Ready"?Is Your Marketing Database "Model Ready"?
Is Your Marketing Database "Model Ready"?
 
Data Visualization dataviz superpower
Data Visualization dataviz superpowerData Visualization dataviz superpower
Data Visualization dataviz superpower
 
Data to Dollars™ - Practical Analytics in the Big Data Era Jaime Fitzgerald A...
Data to Dollars™ - Practical Analytics in the Big Data Era Jaime Fitzgerald A...Data to Dollars™ - Practical Analytics in the Big Data Era Jaime Fitzgerald A...
Data to Dollars™ - Practical Analytics in the Big Data Era Jaime Fitzgerald A...
 
IBM Innovate 2010 - Case Study Presentation 1007 Final W Notes
IBM Innovate 2010 - Case Study Presentation   1007 Final W NotesIBM Innovate 2010 - Case Study Presentation   1007 Final W Notes
IBM Innovate 2010 - Case Study Presentation 1007 Final W Notes
 
Data visualization
Data visualizationData visualization
Data visualization
 
Business intelligence for the postal operator
Business intelligence for the postal operatorBusiness intelligence for the postal operator
Business intelligence for the postal operator
 
ETE 2013: Going Big with Big Data...one step at a time
ETE 2013:  Going Big with Big Data...one step at a timeETE 2013:  Going Big with Big Data...one step at a time
ETE 2013: Going Big with Big Data...one step at a time
 

More from Alithya

Journey to the Oracle Talent Management Cloud
Journey to the Oracle Talent Management CloudJourney to the Oracle Talent Management Cloud
Journey to the Oracle Talent Management Cloud
Alithya
 
What Did I Miss? Addressing Non-Traditional Reconciliations in AR and Data In...
What Did I Miss? Addressing Non-Traditional Reconciliations in AR and Data In...What Did I Miss? Addressing Non-Traditional Reconciliations in AR and Data In...
What Did I Miss? Addressing Non-Traditional Reconciliations in AR and Data In...
Alithya
 
Leading Practices in Multi-Pillar Oracle Cloud Implementations
Leading Practices in Multi-Pillar Oracle Cloud ImplementationsLeading Practices in Multi-Pillar Oracle Cloud Implementations
Leading Practices in Multi-Pillar Oracle Cloud Implementations
Alithya
 
Why and How to Implement Operation Transfer Pricing (OTP) with Oracle EPM Cloud
Why and How to Implement Operation Transfer Pricing (OTP) with Oracle EPM Cloud Why and How to Implement Operation Transfer Pricing (OTP) with Oracle EPM Cloud
Why and How to Implement Operation Transfer Pricing (OTP) with Oracle EPM Cloud
Alithya
 
How to Deploy & Integrate Oracle EPM Cloud Profitability and Cost Management ...
How to Deploy & Integrate Oracle EPM Cloud Profitability and Cost Management ...How to Deploy & Integrate Oracle EPM Cloud Profitability and Cost Management ...
How to Deploy & Integrate Oracle EPM Cloud Profitability and Cost Management ...
Alithya
 
Workforce Plus: Tips and Tricks to Give Workforce an Extra Kick!
Workforce Plus: Tips and Tricks to Give Workforce an Extra Kick! Workforce Plus: Tips and Tricks to Give Workforce an Extra Kick!
Workforce Plus: Tips and Tricks to Give Workforce an Extra Kick!
Alithya
 
How to Allocate Your Close Time More Effectively
How to Allocate Your Close Time More EffectivelyHow to Allocate Your Close Time More Effectively
How to Allocate Your Close Time More Effectively
Alithya
 
Viasat Launches to the Cloud with Oracle Enterprise Data Management
Viasat Launches to the Cloud with Oracle Enterprise Data Management Viasat Launches to the Cloud with Oracle Enterprise Data Management
Viasat Launches to the Cloud with Oracle Enterprise Data Management
Alithya
 
How Do I Love Cash Flow? Let Me Count the Ways…
How Do I Love Cash Flow? Let Me Count the Ways… How Do I Love Cash Flow? Let Me Count the Ways…
How Do I Love Cash Flow? Let Me Count the Ways…
Alithya
 
How WillScot-Mobile Mini Utilized Enterprise Data Management for Business Tra...
How WillScot-Mobile Mini Utilized Enterprise Data Management for Business Tra...How WillScot-Mobile Mini Utilized Enterprise Data Management for Business Tra...
How WillScot-Mobile Mini Utilized Enterprise Data Management for Business Tra...
Alithya
 
❤️ Matchmaker, Make Me a Match: Can AR Intercompany Matchmaking Tools Be a Pe...
❤️ Matchmaker, Make Me a Match: Can AR Intercompany Matchmaking Tools Be a Pe...❤️ Matchmaker, Make Me a Match: Can AR Intercompany Matchmaking Tools Be a Pe...
❤️ Matchmaker, Make Me a Match: Can AR Intercompany Matchmaking Tools Be a Pe...
Alithya
 
Legg Mason’s Enterprise, Profit Driven Quest with Oracle EPM Cloud
Legg Mason’s Enterprise, Profit Driven Quest with Oracle EPM CloudLegg Mason’s Enterprise, Profit Driven Quest with Oracle EPM Cloud
Legg Mason’s Enterprise, Profit Driven Quest with Oracle EPM Cloud
Alithya
 
Supply Chain Advisory and MMIS System Oracle Implementation
Supply Chain Advisory and MMIS System Oracle ImplementationSupply Chain Advisory and MMIS System Oracle Implementation
Supply Chain Advisory and MMIS System Oracle Implementation
Alithya
 
Digital Transformation in Healthcare: Journey to Oracle Cloud for Integrated,...
Digital Transformation in Healthcare: Journey to Oracle Cloud for Integrated,...Digital Transformation in Healthcare: Journey to Oracle Cloud for Integrated,...
Digital Transformation in Healthcare: Journey to Oracle Cloud for Integrated,...
Alithya
 
nter-pod Revolutions: Connected Enterprise Solution in Oracle EPM Cloud
nter-pod Revolutions: Connected Enterprise Solution in Oracle EPM Cloud nter-pod Revolutions: Connected Enterprise Solution in Oracle EPM Cloud
nter-pod Revolutions: Connected Enterprise Solution in Oracle EPM Cloud
Alithya
 
ODTUG Configuring Workforce: Employee? Job? or Both?
ODTUG Configuring Workforce: Employee? Job? or Both? ODTUG Configuring Workforce: Employee? Job? or Both?
ODTUG Configuring Workforce: Employee? Job? or Both?
Alithya
 
Oracle Cloud Time and Labor: Default Payroll Rate, Override Rate and Flat Dol...
Oracle Cloud Time and Labor: Default Payroll Rate, Override Rate and Flat Dol...Oracle Cloud Time and Labor: Default Payroll Rate, Override Rate and Flat Dol...
Oracle Cloud Time and Labor: Default Payroll Rate, Override Rate and Flat Dol...
Alithya
 
AUSOUG I Am Paying for my Cloud License. What's Next?
AUSOUG I Am Paying for my Cloud License. What's Next?AUSOUG I Am Paying for my Cloud License. What's Next?
AUSOUG I Am Paying for my Cloud License. What's Next?
Alithya
 
A Journey to Profitability with Oracle PCMCS
A Journey to Profitability with Oracle PCMCSA Journey to Profitability with Oracle PCMCS
A Journey to Profitability with Oracle PCMCS
Alithya
 
Essbase Calculations: Elements of Style
Essbase Calculations: Elements of StyleEssbase Calculations: Elements of Style
Essbase Calculations: Elements of Style
Alithya
 

More from Alithya (20)

Journey to the Oracle Talent Management Cloud
Journey to the Oracle Talent Management CloudJourney to the Oracle Talent Management Cloud
Journey to the Oracle Talent Management Cloud
 
What Did I Miss? Addressing Non-Traditional Reconciliations in AR and Data In...
What Did I Miss? Addressing Non-Traditional Reconciliations in AR and Data In...What Did I Miss? Addressing Non-Traditional Reconciliations in AR and Data In...
What Did I Miss? Addressing Non-Traditional Reconciliations in AR and Data In...
 
Leading Practices in Multi-Pillar Oracle Cloud Implementations
Leading Practices in Multi-Pillar Oracle Cloud ImplementationsLeading Practices in Multi-Pillar Oracle Cloud Implementations
Leading Practices in Multi-Pillar Oracle Cloud Implementations
 
Why and How to Implement Operation Transfer Pricing (OTP) with Oracle EPM Cloud
Why and How to Implement Operation Transfer Pricing (OTP) with Oracle EPM Cloud Why and How to Implement Operation Transfer Pricing (OTP) with Oracle EPM Cloud
Why and How to Implement Operation Transfer Pricing (OTP) with Oracle EPM Cloud
 
How to Deploy & Integrate Oracle EPM Cloud Profitability and Cost Management ...
How to Deploy & Integrate Oracle EPM Cloud Profitability and Cost Management ...How to Deploy & Integrate Oracle EPM Cloud Profitability and Cost Management ...
How to Deploy & Integrate Oracle EPM Cloud Profitability and Cost Management ...
 
Workforce Plus: Tips and Tricks to Give Workforce an Extra Kick!
Workforce Plus: Tips and Tricks to Give Workforce an Extra Kick! Workforce Plus: Tips and Tricks to Give Workforce an Extra Kick!
Workforce Plus: Tips and Tricks to Give Workforce an Extra Kick!
 
How to Allocate Your Close Time More Effectively
How to Allocate Your Close Time More EffectivelyHow to Allocate Your Close Time More Effectively
How to Allocate Your Close Time More Effectively
 
Viasat Launches to the Cloud with Oracle Enterprise Data Management
Viasat Launches to the Cloud with Oracle Enterprise Data Management Viasat Launches to the Cloud with Oracle Enterprise Data Management
Viasat Launches to the Cloud with Oracle Enterprise Data Management
 
How Do I Love Cash Flow? Let Me Count the Ways…
How Do I Love Cash Flow? Let Me Count the Ways… How Do I Love Cash Flow? Let Me Count the Ways…
How Do I Love Cash Flow? Let Me Count the Ways…
 
How WillScot-Mobile Mini Utilized Enterprise Data Management for Business Tra...
How WillScot-Mobile Mini Utilized Enterprise Data Management for Business Tra...How WillScot-Mobile Mini Utilized Enterprise Data Management for Business Tra...
How WillScot-Mobile Mini Utilized Enterprise Data Management for Business Tra...
 
❤️ Matchmaker, Make Me a Match: Can AR Intercompany Matchmaking Tools Be a Pe...
❤️ Matchmaker, Make Me a Match: Can AR Intercompany Matchmaking Tools Be a Pe...❤️ Matchmaker, Make Me a Match: Can AR Intercompany Matchmaking Tools Be a Pe...
❤️ Matchmaker, Make Me a Match: Can AR Intercompany Matchmaking Tools Be a Pe...
 
Legg Mason’s Enterprise, Profit Driven Quest with Oracle EPM Cloud
Legg Mason’s Enterprise, Profit Driven Quest with Oracle EPM CloudLegg Mason’s Enterprise, Profit Driven Quest with Oracle EPM Cloud
Legg Mason’s Enterprise, Profit Driven Quest with Oracle EPM Cloud
 
Supply Chain Advisory and MMIS System Oracle Implementation
Supply Chain Advisory and MMIS System Oracle ImplementationSupply Chain Advisory and MMIS System Oracle Implementation
Supply Chain Advisory and MMIS System Oracle Implementation
 
Digital Transformation in Healthcare: Journey to Oracle Cloud for Integrated,...
Digital Transformation in Healthcare: Journey to Oracle Cloud for Integrated,...Digital Transformation in Healthcare: Journey to Oracle Cloud for Integrated,...
Digital Transformation in Healthcare: Journey to Oracle Cloud for Integrated,...
 
nter-pod Revolutions: Connected Enterprise Solution in Oracle EPM Cloud
nter-pod Revolutions: Connected Enterprise Solution in Oracle EPM Cloud nter-pod Revolutions: Connected Enterprise Solution in Oracle EPM Cloud
nter-pod Revolutions: Connected Enterprise Solution in Oracle EPM Cloud
 
ODTUG Configuring Workforce: Employee? Job? or Both?
ODTUG Configuring Workforce: Employee? Job? or Both? ODTUG Configuring Workforce: Employee? Job? or Both?
ODTUG Configuring Workforce: Employee? Job? or Both?
 
Oracle Cloud Time and Labor: Default Payroll Rate, Override Rate and Flat Dol...
Oracle Cloud Time and Labor: Default Payroll Rate, Override Rate and Flat Dol...Oracle Cloud Time and Labor: Default Payroll Rate, Override Rate and Flat Dol...
Oracle Cloud Time and Labor: Default Payroll Rate, Override Rate and Flat Dol...
 
AUSOUG I Am Paying for my Cloud License. What's Next?
AUSOUG I Am Paying for my Cloud License. What's Next?AUSOUG I Am Paying for my Cloud License. What's Next?
AUSOUG I Am Paying for my Cloud License. What's Next?
 
A Journey to Profitability with Oracle PCMCS
A Journey to Profitability with Oracle PCMCSA Journey to Profitability with Oracle PCMCS
A Journey to Profitability with Oracle PCMCS
 
Essbase Calculations: Elements of Style
Essbase Calculations: Elements of StyleEssbase Calculations: Elements of Style
Essbase Calculations: Elements of Style
 

Recently uploaded

AI 101: An Introduction to the Basics and Impact of Artificial Intelligence
AI 101: An Introduction to the Basics and Impact of Artificial IntelligenceAI 101: An Introduction to the Basics and Impact of Artificial Intelligence
AI 101: An Introduction to the Basics and Impact of Artificial Intelligence
IndexBug
 
“Building and Scaling AI Applications with the Nx AI Manager,” a Presentation...
“Building and Scaling AI Applications with the Nx AI Manager,” a Presentation...“Building and Scaling AI Applications with the Nx AI Manager,” a Presentation...
“Building and Scaling AI Applications with the Nx AI Manager,” a Presentation...
Edge AI and Vision Alliance
 
“I’m still / I’m still / Chaining from the Block”
“I’m still / I’m still / Chaining from the Block”“I’m still / I’m still / Chaining from the Block”
“I’m still / I’m still / Chaining from the Block”
Claudio Di Ciccio
 
HCL Notes and Domino License Cost Reduction in the World of DLAU
HCL Notes and Domino License Cost Reduction in the World of DLAUHCL Notes and Domino License Cost Reduction in the World of DLAU
HCL Notes and Domino License Cost Reduction in the World of DLAU
panagenda
 
Monitoring and Managing Anomaly Detection on OpenShift.pdf
Monitoring and Managing Anomaly Detection on OpenShift.pdfMonitoring and Managing Anomaly Detection on OpenShift.pdf
Monitoring and Managing Anomaly Detection on OpenShift.pdf
Tosin Akinosho
 
Climate Impact of Software Testing at Nordic Testing Days
Climate Impact of Software Testing at Nordic Testing DaysClimate Impact of Software Testing at Nordic Testing Days
Climate Impact of Software Testing at Nordic Testing Days
Kari Kakkonen
 
Choosing The Best AWS Service For Your Website + API.pptx
Choosing The Best AWS Service For Your Website + API.pptxChoosing The Best AWS Service For Your Website + API.pptx
Choosing The Best AWS Service For Your Website + API.pptx
Brandon Minnick, MBA
 
TrustArc Webinar - 2024 Global Privacy Survey
TrustArc Webinar - 2024 Global Privacy SurveyTrustArc Webinar - 2024 Global Privacy Survey
TrustArc Webinar - 2024 Global Privacy Survey
TrustArc
 
Uni Systems Copilot event_05062024_C.Vlachos.pdf
Uni Systems Copilot event_05062024_C.Vlachos.pdfUni Systems Copilot event_05062024_C.Vlachos.pdf
Uni Systems Copilot event_05062024_C.Vlachos.pdf
Uni Systems S.M.S.A.
 
20240607 QFM018 Elixir Reading List May 2024
20240607 QFM018 Elixir Reading List May 202420240607 QFM018 Elixir Reading List May 2024
20240607 QFM018 Elixir Reading List May 2024
Matthew Sinclair
 
Infrastructure Challenges in Scaling RAG with Custom AI models
Infrastructure Challenges in Scaling RAG with Custom AI modelsInfrastructure Challenges in Scaling RAG with Custom AI models
Infrastructure Challenges in Scaling RAG with Custom AI models
Zilliz
 
HCL Notes und Domino Lizenzkostenreduzierung in der Welt von DLAU
HCL Notes und Domino Lizenzkostenreduzierung in der Welt von DLAUHCL Notes und Domino Lizenzkostenreduzierung in der Welt von DLAU
HCL Notes und Domino Lizenzkostenreduzierung in der Welt von DLAU
panagenda
 
Removing Uninteresting Bytes in Software Fuzzing
Removing Uninteresting Bytes in Software FuzzingRemoving Uninteresting Bytes in Software Fuzzing
Removing Uninteresting Bytes in Software Fuzzing
Aftab Hussain
 
GraphRAG for Life Science to increase LLM accuracy
GraphRAG for Life Science to increase LLM accuracyGraphRAG for Life Science to increase LLM accuracy
GraphRAG for Life Science to increase LLM accuracy
Tomaz Bratanic
 
Mariano G Tinti - Decoding SpaceX
Mariano G Tinti - Decoding SpaceXMariano G Tinti - Decoding SpaceX
Mariano G Tinti - Decoding SpaceX
Mariano Tinti
 
20240609 QFM020 Irresponsible AI Reading List May 2024
20240609 QFM020 Irresponsible AI Reading List May 202420240609 QFM020 Irresponsible AI Reading List May 2024
20240609 QFM020 Irresponsible AI Reading List May 2024
Matthew Sinclair
 
CAKE: Sharing Slices of Confidential Data on Blockchain
CAKE: Sharing Slices of Confidential Data on BlockchainCAKE: Sharing Slices of Confidential Data on Blockchain
CAKE: Sharing Slices of Confidential Data on Blockchain
Claudio Di Ciccio
 
Programming Foundation Models with DSPy - Meetup Slides
Programming Foundation Models with DSPy - Meetup SlidesProgramming Foundation Models with DSPy - Meetup Slides
Programming Foundation Models with DSPy - Meetup Slides
Zilliz
 
Unlock the Future of Search with MongoDB Atlas_ Vector Search Unleashed.pdf
Unlock the Future of Search with MongoDB Atlas_ Vector Search Unleashed.pdfUnlock the Future of Search with MongoDB Atlas_ Vector Search Unleashed.pdf
Unlock the Future of Search with MongoDB Atlas_ Vector Search Unleashed.pdf
Malak Abu Hammad
 
UI5 Controls simplified - UI5con2024 presentation
UI5 Controls simplified - UI5con2024 presentationUI5 Controls simplified - UI5con2024 presentation
UI5 Controls simplified - UI5con2024 presentation
Wouter Lemaire
 

Recently uploaded (20)

AI 101: An Introduction to the Basics and Impact of Artificial Intelligence
AI 101: An Introduction to the Basics and Impact of Artificial IntelligenceAI 101: An Introduction to the Basics and Impact of Artificial Intelligence
AI 101: An Introduction to the Basics and Impact of Artificial Intelligence
 
“Building and Scaling AI Applications with the Nx AI Manager,” a Presentation...
“Building and Scaling AI Applications with the Nx AI Manager,” a Presentation...“Building and Scaling AI Applications with the Nx AI Manager,” a Presentation...
“Building and Scaling AI Applications with the Nx AI Manager,” a Presentation...
 
“I’m still / I’m still / Chaining from the Block”
“I’m still / I’m still / Chaining from the Block”“I’m still / I’m still / Chaining from the Block”
“I’m still / I’m still / Chaining from the Block”
 
HCL Notes and Domino License Cost Reduction in the World of DLAU
HCL Notes and Domino License Cost Reduction in the World of DLAUHCL Notes and Domino License Cost Reduction in the World of DLAU
HCL Notes and Domino License Cost Reduction in the World of DLAU
 
Monitoring and Managing Anomaly Detection on OpenShift.pdf
Monitoring and Managing Anomaly Detection on OpenShift.pdfMonitoring and Managing Anomaly Detection on OpenShift.pdf
Monitoring and Managing Anomaly Detection on OpenShift.pdf
 
Climate Impact of Software Testing at Nordic Testing Days
Climate Impact of Software Testing at Nordic Testing DaysClimate Impact of Software Testing at Nordic Testing Days
Climate Impact of Software Testing at Nordic Testing Days
 
Choosing The Best AWS Service For Your Website + API.pptx
Choosing The Best AWS Service For Your Website + API.pptxChoosing The Best AWS Service For Your Website + API.pptx
Choosing The Best AWS Service For Your Website + API.pptx
 
TrustArc Webinar - 2024 Global Privacy Survey
TrustArc Webinar - 2024 Global Privacy SurveyTrustArc Webinar - 2024 Global Privacy Survey
TrustArc Webinar - 2024 Global Privacy Survey
 
Uni Systems Copilot event_05062024_C.Vlachos.pdf
Uni Systems Copilot event_05062024_C.Vlachos.pdfUni Systems Copilot event_05062024_C.Vlachos.pdf
Uni Systems Copilot event_05062024_C.Vlachos.pdf
 
20240607 QFM018 Elixir Reading List May 2024
20240607 QFM018 Elixir Reading List May 202420240607 QFM018 Elixir Reading List May 2024
20240607 QFM018 Elixir Reading List May 2024
 
Infrastructure Challenges in Scaling RAG with Custom AI models
Infrastructure Challenges in Scaling RAG with Custom AI modelsInfrastructure Challenges in Scaling RAG with Custom AI models
Infrastructure Challenges in Scaling RAG with Custom AI models
 
HCL Notes und Domino Lizenzkostenreduzierung in der Welt von DLAU
HCL Notes und Domino Lizenzkostenreduzierung in der Welt von DLAUHCL Notes und Domino Lizenzkostenreduzierung in der Welt von DLAU
HCL Notes und Domino Lizenzkostenreduzierung in der Welt von DLAU
 
Removing Uninteresting Bytes in Software Fuzzing
Removing Uninteresting Bytes in Software FuzzingRemoving Uninteresting Bytes in Software Fuzzing
Removing Uninteresting Bytes in Software Fuzzing
 
GraphRAG for Life Science to increase LLM accuracy
GraphRAG for Life Science to increase LLM accuracyGraphRAG for Life Science to increase LLM accuracy
GraphRAG for Life Science to increase LLM accuracy
 
Mariano G Tinti - Decoding SpaceX
Mariano G Tinti - Decoding SpaceXMariano G Tinti - Decoding SpaceX
Mariano G Tinti - Decoding SpaceX
 
20240609 QFM020 Irresponsible AI Reading List May 2024
20240609 QFM020 Irresponsible AI Reading List May 202420240609 QFM020 Irresponsible AI Reading List May 2024
20240609 QFM020 Irresponsible AI Reading List May 2024
 
CAKE: Sharing Slices of Confidential Data on Blockchain
CAKE: Sharing Slices of Confidential Data on BlockchainCAKE: Sharing Slices of Confidential Data on Blockchain
CAKE: Sharing Slices of Confidential Data on Blockchain
 
Programming Foundation Models with DSPy - Meetup Slides
Programming Foundation Models with DSPy - Meetup SlidesProgramming Foundation Models with DSPy - Meetup Slides
Programming Foundation Models with DSPy - Meetup Slides
 
Unlock the Future of Search with MongoDB Atlas_ Vector Search Unleashed.pdf
Unlock the Future of Search with MongoDB Atlas_ Vector Search Unleashed.pdfUnlock the Future of Search with MongoDB Atlas_ Vector Search Unleashed.pdf
Unlock the Future of Search with MongoDB Atlas_ Vector Search Unleashed.pdf
 
UI5 Controls simplified - UI5con2024 presentation
UI5 Controls simplified - UI5con2024 presentationUI5 Controls simplified - UI5con2024 presentation
UI5 Controls simplified - UI5con2024 presentation
 

Why Data Visualization is Important in Delivering Actionable Insight

  • 1. Iain Curtain Edgewater Ranzal WHY DATA VISUALIZATION IS IMPORTANT IN DELIVERING ACTIONABLE INSIGHT
  • 2. Agenda • Introduction • Design examples • Understanding the customer • What makes good design • How to apply this to reporting • Summary and examples • Questions
  • 5. Design Examples - Lots of images - Attention not drawn to specific items - Too much color - Visuals used when charts or data could convey messages better - Waste of valuable screen real estate
  • 6. Design Examples - 3-D rendering makes it harder to interpret the values - Forecasted Units and Dollars lines connect the regions, when they are distinct data points - Dollars and Year Ago Dollars are stacked, when they are also distinct values - Excessive use of the word ‘Region’
  • 7. Design Examples - Recent example of visuals over substance and meaning - Very difficult to determine correlation between circle sizes
  • 8. Design Examples - Dark images and background distract the viewer - Cannot determine trends with only 2 data points - Confusing as 2010 values are not circles - Visuals used when charts or data could convey messages better
  • 9. Customer Maturity Customers are on a reporting journey and determining what their requirements and future plans are Scorecards important in understanding where they are, what their Dashboards needs are and where they think they are going. Mgmt Reports You must satisfy the pre-requisites before climbing up the Operations pyramid. Foundation
  • 10. Customer Maturity Areas to grow Consider 3 different part of the organization at different stages of maturity: - Finance = Area 1 - Logistics = Area 2 - Manufacturing = Area 3 Maintain current operations business Area 1 Area 2 Area 3
  • 11. User Requirements • Talk to users • Listen to users • Ask why, why, why?
  • 12. Good design concepts • Memory limits • Encoding data for rapid perception • Gestalt principles of perception
  • 13. Memory Limits • Iconic memory – visual cues, pre-conscious /pre-attentive processing • Short term memory – conscious processing, 3-9 chunks only • Long term memory
  • 14. Data Encoding - How many 3’s can you find? - As there is no 1723957695026398027384956012 encoding of data, we process 9847536970898726547867925019 sequentially – attentive processing 2005928976548102985079827158 - very slow! 0297456478597069873940588698 5726327189506972915069871256 2783789
  • 15. Data Encoding - 7 is the correct answer - Much easier to see when data is in a 1723957695026398027384956012 different color, the same goes for 9847536970898726547867925019 bolding, size, shape and orientation 2005928976548102985079827158 changes as well 0297456478597069873940588698 5726327189506972915069871256 2783789
  • 16. Gestalt Principles Here we see: • Proximity - 2 groups rather than 7 blogs - 2 different sets within the groups - 2 further groups • Similarity within the groups • Enclosure
  • 17. Gestalt Principles Our minds: • Closure - Close - Continue - Link even though these can • Continuity be seen as discrete items. • Connection
  • 18. Applying concepts • Focus on the value add you are showing by organising and minimising the data shown. • Arrange information in a way that makes sense, making sure that the important data stands out.
  • 19. Edward R Tufte • Tufte provided lots of thought around how we view and perceive data
  • 20. Data Ink Ratio • Key concepts: reduce non data ink from graphics, focus on the values • Reduce graphic paraphernalia (chartjunk)
  • 21. Chartjunk • Which of these has clutter and unnecessary items? • Which is easier to see the data?
  • 22. Colin Ware Colin Ware Information Visualization - Perception for Design, 2000 “We can easily see patterns presented in certain ways, but if they are presented in other ways they become invisible.”
  • 23. Colin Ware We distinguish the items if different in terms of: • Color - Color – either hue or intensity - Form – can also be size, shape, orientation • Form
  • 24. Colin Ware We distinguish the items if different in terms of: • Position - Position - Motion: flashing/moving should only be used for real time data or issues requiring immediate attention • Motion
  • 25. Stephen Few • Combined previous theories and melded with current designs and dashboard and communication ideas
  • 26. Stephen Few This simple example shows how we can’t easily compute size variations in area. The large circle is 16 time larger. Pie and area charts should not be used as we cannot quickly recognize the differences.
  • 27. How does this help us? • Simplify – reduce the data presented • Simplify – concentrate on important information • Simplify – remove unnecessary color and distractions
  • 28. Examples Top example is very difficult to read and interpret numbers. Bottom report is cleaner and can easily see the items without distracting border and shading.
  • 29. Examples Top example is very distracting and difficult to focus on areas that need attention. Bottom report is much cleaner and easier to see items needing attention.
  • 30. Design Examples Much easier to compare the different market capitalizations when presented as a bar chart. Also much easier to see the best/worse if ordered.
  • 32. Design Examples 1,600 1,500.0 1,400 1,200 1,000 UK 800 Germany In charting the previous 600 North America graphic, it’s obvious 400 165.8 that there is no US$ Millions 200 128.573.5 20.4 25.2 4.3 45.0 2.9 relationship between 0 2005 2009 2010 the years or countries. Maybe a table would 1,600 1,500.0 have been better? 1,400 1,200 1,000 2005 800 2009 600 400 2010 128.5 165.8 73.5 US$ Millions 200 4.3 45.0 20.4 25.2 2.9 0 UK Germany North America
  • 33. Edward R Tufte The Visual Display of Quantitative Information, 1983 “Graphical excellence is that which gives the viewer the greatest number of ideas in the shortest time, with the least ink in the smallest space.”