Downloaded 26 times

![Scientific Data Growth
3
0
1
2
3
4
5
6
7
8
9
10
2004 2005 2006 2007 2008 2009 2010 2011 2012 2013 2014
CumulativeSizeofDatasets
[Petabytes]
Year
Astronomy [NRAO]
Physics [LHC]
Simulation [ICESS]
Gene Sequencing [EBI]
Scientific Data Grows Exponentially!](https://image.slidesharecdn.com/braintalkcusonm-140523043244-phpapp02/85/Braintalk-cuso-nm-3-320.jpg)


![0
50
100
150
200
250
300
50 100 150 200 250 300 350 400 450
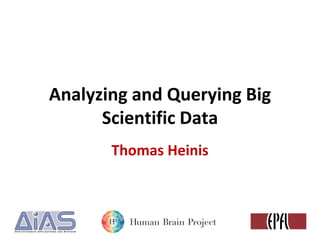
Time[seconds]
Dataset Density [Million of Elements per unit Volume]
Hilbert R-Tree
STR R-Tree
PR-Tree
13
Scalability Challenge
Dataset: 100K neurons, 450 Million 3D cylinders, 27 GB on disk.
Range Queries: Uniform Random 500 for each experiment.
Spatial Density Increases with Dataset SizeState of the Art Does Not Scale with Density](https://image.slidesharecdn.com/braintalkcusonm-140523043244-phpapp02/85/Braintalk-cuso-nm-13-320.jpg)


![0
50
100
150
200
250
300
50 100 150 200 250 300 350 400 450
Time[seconds]
Dataset Density [Million of Elements per unit Volume]
Hilbert R-Tree
STR R-Tree
PR-Tree
FLAT
19
FLAT: Performance Evaluation
Dataset: 100K neurons, 450 Million 3D cylinders, 27 GB on disk.
Range Queries: Uniform Random 500 for each experiment.
Spatial Density Increases with Dataset SizeDecouples Execution Time from Density
7.8 x](https://image.slidesharecdn.com/braintalkcusonm-140523043244-phpapp02/85/Braintalk-cuso-nm-19-320.jpg)
![FLAT: Scalability
20
0
0.5
1
1.5
2
2.5
3
3.5
4
4.5
5
50 100 150 200 250 300 350 400 450
TimeperResultObject[ms]
Dataset Density [Million of Elements per Unit Volume]
Hilbert R-Tree
STR R-Tree
PR-Tree
FLAT
Seeding cost amortizes with
increase in result cardinality
Trend is “FLAT”, Scales With Density
Dataset: 100K neurons, 450 Million 3D cylinders, 27 GB on disk.
Range Queries: Uniform Random 500 for each experiment.](https://image.slidesharecdn.com/braintalkcusonm-140523043244-phpapp02/85/Braintalk-cuso-nm-20-320.jpg)


![Existing techniques:
Extrapolate past query locations
Exponential Weighted Moving Average (EWMA)
Straight Line
Hilbert Prefetching
Predictive Prefetching
25
Large Volume
Queries
Small Volume
Queries
0
5
10
15
20
25
30
35
40
45
50
10k 80k 150k 220k
CacheHitRate[%]
Volume of Query [µm3]
Neuroscience Data set
25 query in sequence
Not Efficient With Arbitrary Query Volume!](https://image.slidesharecdn.com/braintalkcusonm-140523043244-phpapp02/85/Braintalk-cuso-nm-25-320.jpg)


![0
10
20
30
40
50
60
70
80
90
100CacheHitRate[%] EWMA Straight Line
Hilbert SCOUT
SCOUT: Prediction Accuracy
30
Sequence 1 Sequence 2
Visualization
Cache Hit Rate = Amount of data retrieved from cache
Total amount of data retrieved
x 100
80K [μm3]
32
Query Volume:
Sequence Length:
20K [μm3]
32
Dataset: 100K neurons, 450 Million 3D cylinders, 27 GB on disk
72% - 91% Prediction Accuracy
SCOUT speeds up sequences up to 14.7x
Speedup 2x
Speedup 14.7x](https://image.slidesharecdn.com/braintalkcusonm-140523043244-phpapp02/85/Braintalk-cuso-nm-30-320.jpg)
![SCOUT: Scalability
31
Increase in Data set Size
0
20
40
60
80
100
50M 150M 250M 350M 450M
Data set Size
[# of spatial objects]
SCOUT
CacheHitRate[%]
SCOUT scales with increase in data set size
CPU
DISK
Retrieve Query ResultsProcessing Results
Time
3rd Query2nd Query
PredictionPrefetching
SCOUT Overhead
0
50
100
150
200
50M 150M 250M 350M 450M
Time[sec]
Data set Size [# of spatial objects]
Prediction
Retrieve Query Results
15-16%](https://image.slidesharecdn.com/braintalkcusonm-140523043244-phpapp02/85/Braintalk-cuso-nm-31-320.jpg)


![Performance Evaluation
37
Linear Scan Outperforms Indexed Approaches
Not Enough Queries to Invest
on Index Maintenance
Monitor
timeSimulation
Time step
Monitor
Simulation
Time step
Few
Queries
Massive
Updates
SETUP:
Neural Mesh Dataset: 1.32 Billion
Tetrahedral Mesh (33GB)
15 Queries per 60 simulation time step
0
1000
2000
3000
4000
5000
6000
7000
8000
Statistical Analysis
Microbenchmark
TotalQueryResponseTime[sec]
LinearScan OCTREE
LUR-Tree QU-Trade
99.5%
80%
72%
Maintenance](https://image.slidesharecdn.com/braintalkcusonm-140523043244-phpapp02/85/Braintalk-cuso-nm-37-320.jpg)


![OCTOPUS: Performance
437.3-8X Speedup
0
1000
2000
3000
4000
5000
6000
7000
8000
9000
Visualization
MicrobenchMark
Statistical Analysis
Microbenchmark
TotalQueryExecutionTime[sec]
OCTOPUS
LinearScan
OCTREE
LUR-Tree
QU-Trade
8X 7.3X
Visualization
Microbenchmark](https://image.slidesharecdn.com/braintalkcusonm-140523043244-phpapp02/85/Braintalk-cuso-nm-43-320.jpg)
![OCTOPUS: Scalability
44
0
20
40
60
80
100
120
140
0.13 0.17 0.26 0.52 1.32
TotalQueryExecutionTime[sec]
Mesh Detail
[Tetrahedrals in Billions]
Graph Traversal
Surface Scan
OCTOPUS Breakdown
64%
41%
0
350
700
1050
1400
0.13 0.17 0.26 0.52 1.32
LinearScan
OCTOPUS
Mesh Detail
[Tetrahedrals in Billions]
TotalQueryExecutionTime[sec]
Scales with Mesh Detail
SETUP:
Queries: Uniform random
15 per time step, 60 time steps
8X 10X](https://image.slidesharecdn.com/braintalkcusonm-140523043244-phpapp02/85/Braintalk-cuso-nm-44-320.jpg)

![Human Brain Project:
Part of the toolset used every day
February 2013: first 10 million neuron model built
Still 4 orders of magnitude smaller than human brain
General Applicability:
Material Sciences
Astronomy
Geographical Information
Systems
Impact
46
2010
2008
2006
0
10
20
30
1K 10K 100K 10M
ModelSize[GB]
Simulation Size [# Neurons]
2013
(2.5 TB)](https://image.slidesharecdn.com/braintalkcusonm-140523043244-phpapp02/85/Braintalk-cuso-nm-46-320.jpg)


The document discusses the challenges of analyzing and querying large scientific datasets, particularly in projects like the Human Brain Project and the Large Hadron Collider, which generate massive amounts of data. It highlights methods for scalable spatial access and data exploration, utilizing connectivity for efficient query execution and prefetching techniques to enhance performance. The conclusions emphasize the necessity for advanced data management strategies to enable scientific breakthroughs in an era of exponentially growing data.


![[CVPR 2018] Utilizing unlabeled or noisy labeled data (classification, detect...](https://cdn.slidesharecdn.com/ss_thumbnails/cvpr18detectionclassification-180817015950-thumbnail.jpg?width=640&height=640&fit=bounds)