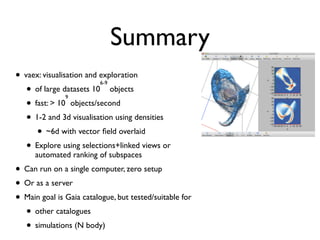
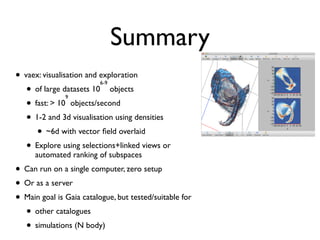
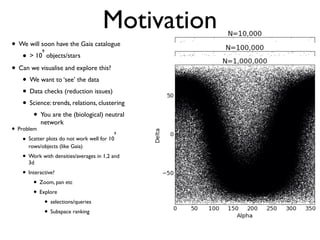
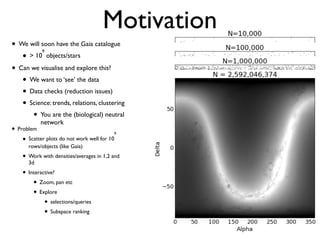
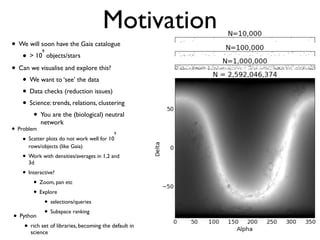
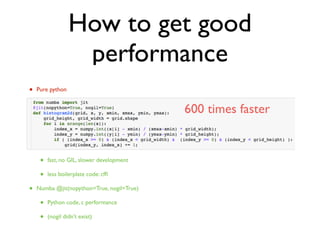
The document discusses the use of Vaex, a Python library designed for the interactive visualization and exploration of large datasets, specifically targeting the Gaia catalogue which contains data on over a billion stars. It highlights the challenges of visualizing such massive data sets and outlines technical solutions including memory management, efficient algorithms, and visualization techniques in 1, 2, and 3 dimensions. Vaex is positioned as a fast and flexible tool capable of handling datasets ranging from millions to billions of objects, allowing for exploratory data analysis with minimal setup.


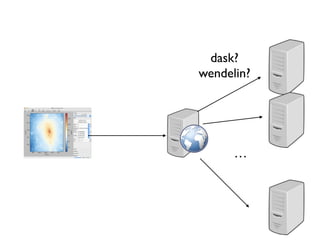
![Client/Server
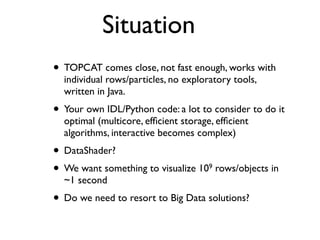
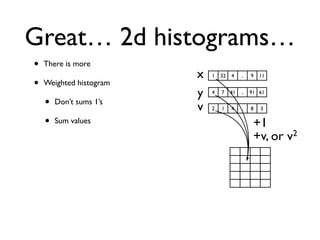
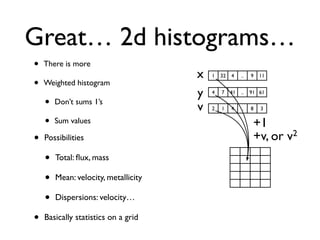
• 2d histogram example
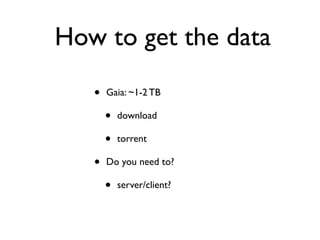
• raw data:15 GB
• binned 256x256 grid
• 500KB, or 10-100kb compressed
• Proof of concept
• over http / websocket
• vaex webserver [file …]](https://image.slidesharecdn.com/vaex-talk-pydata-paris-160614100836/85/Vaex-talk-pydata-paris-58-320.jpg)