Download as PDF, PPTX


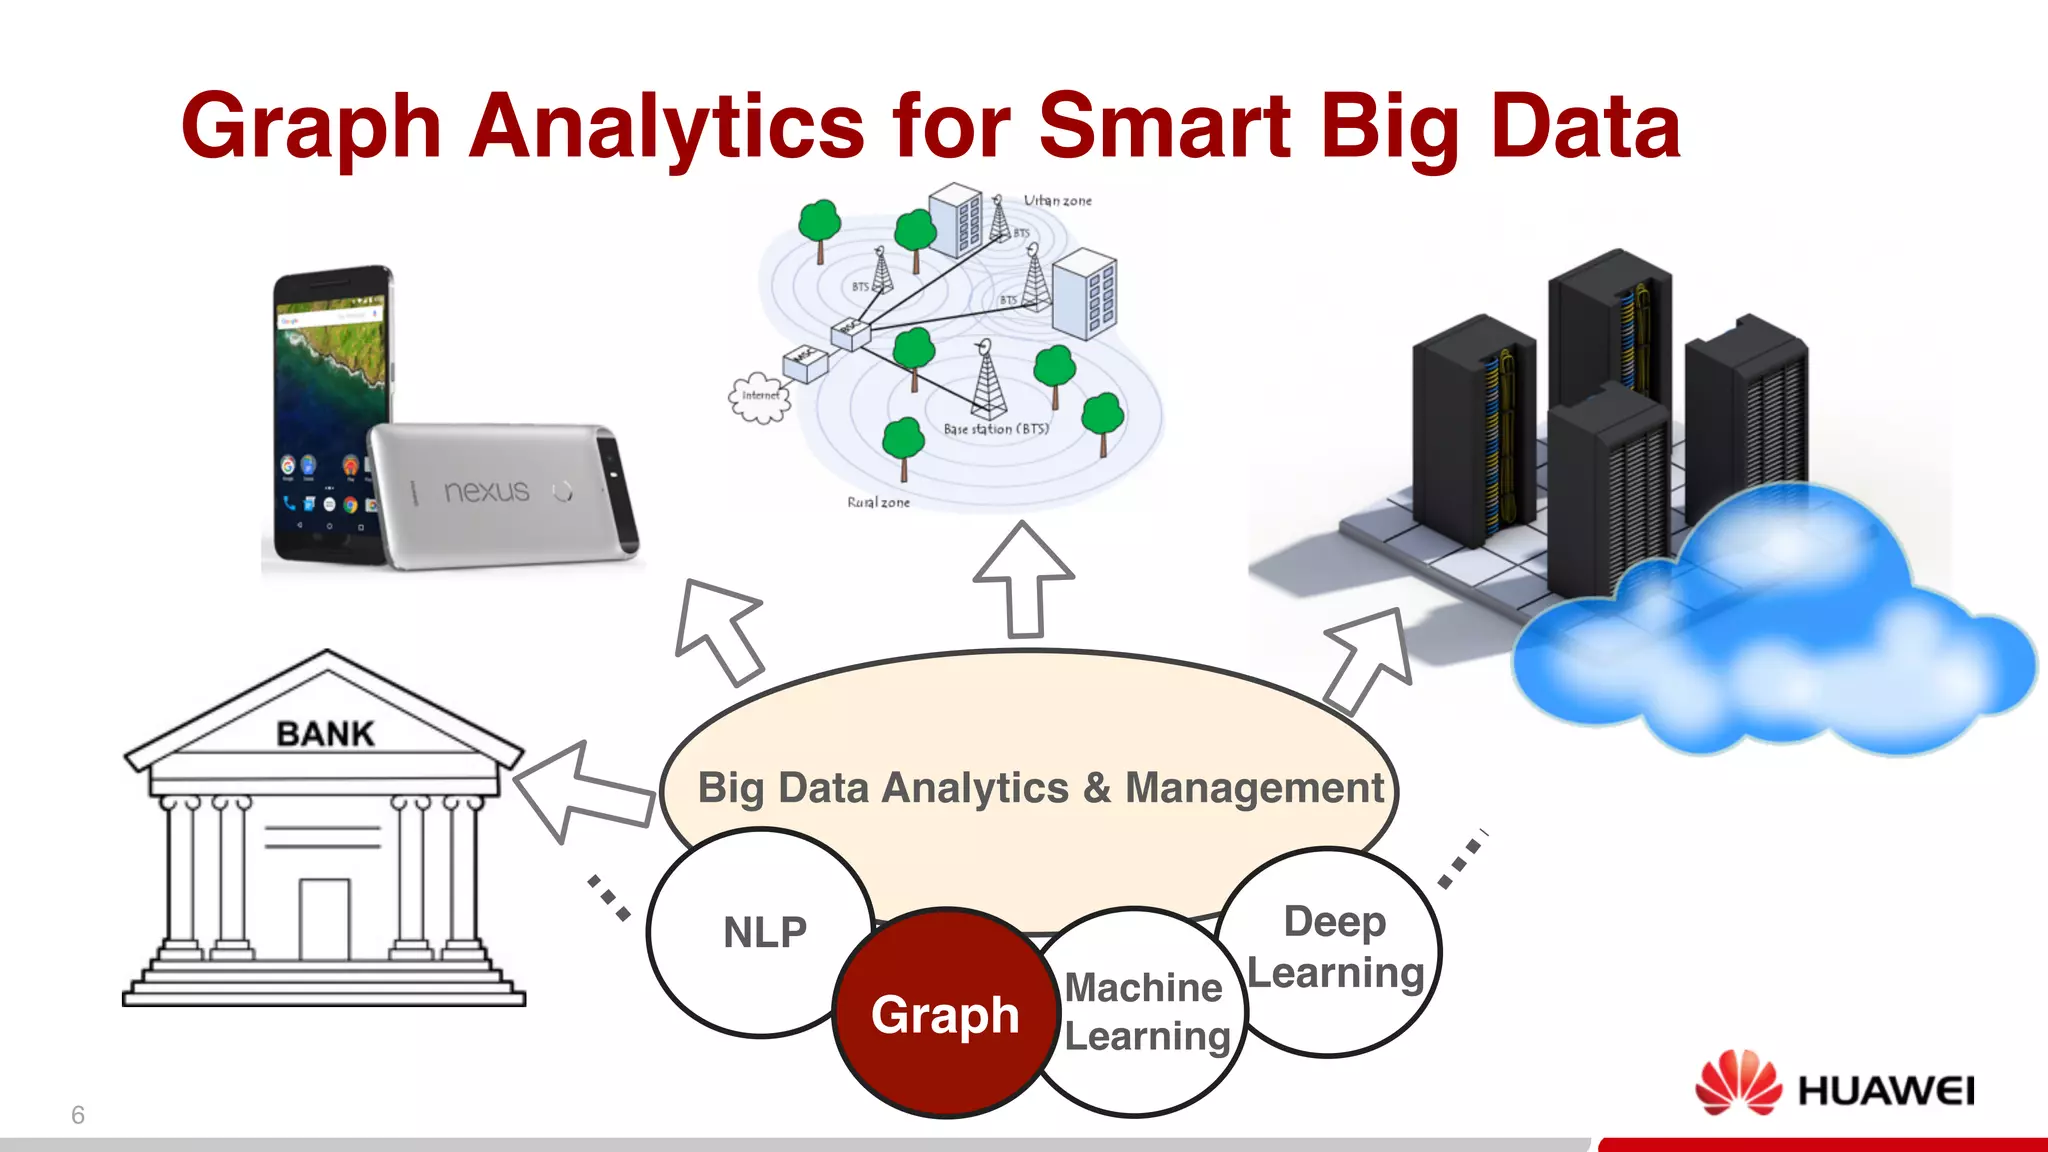


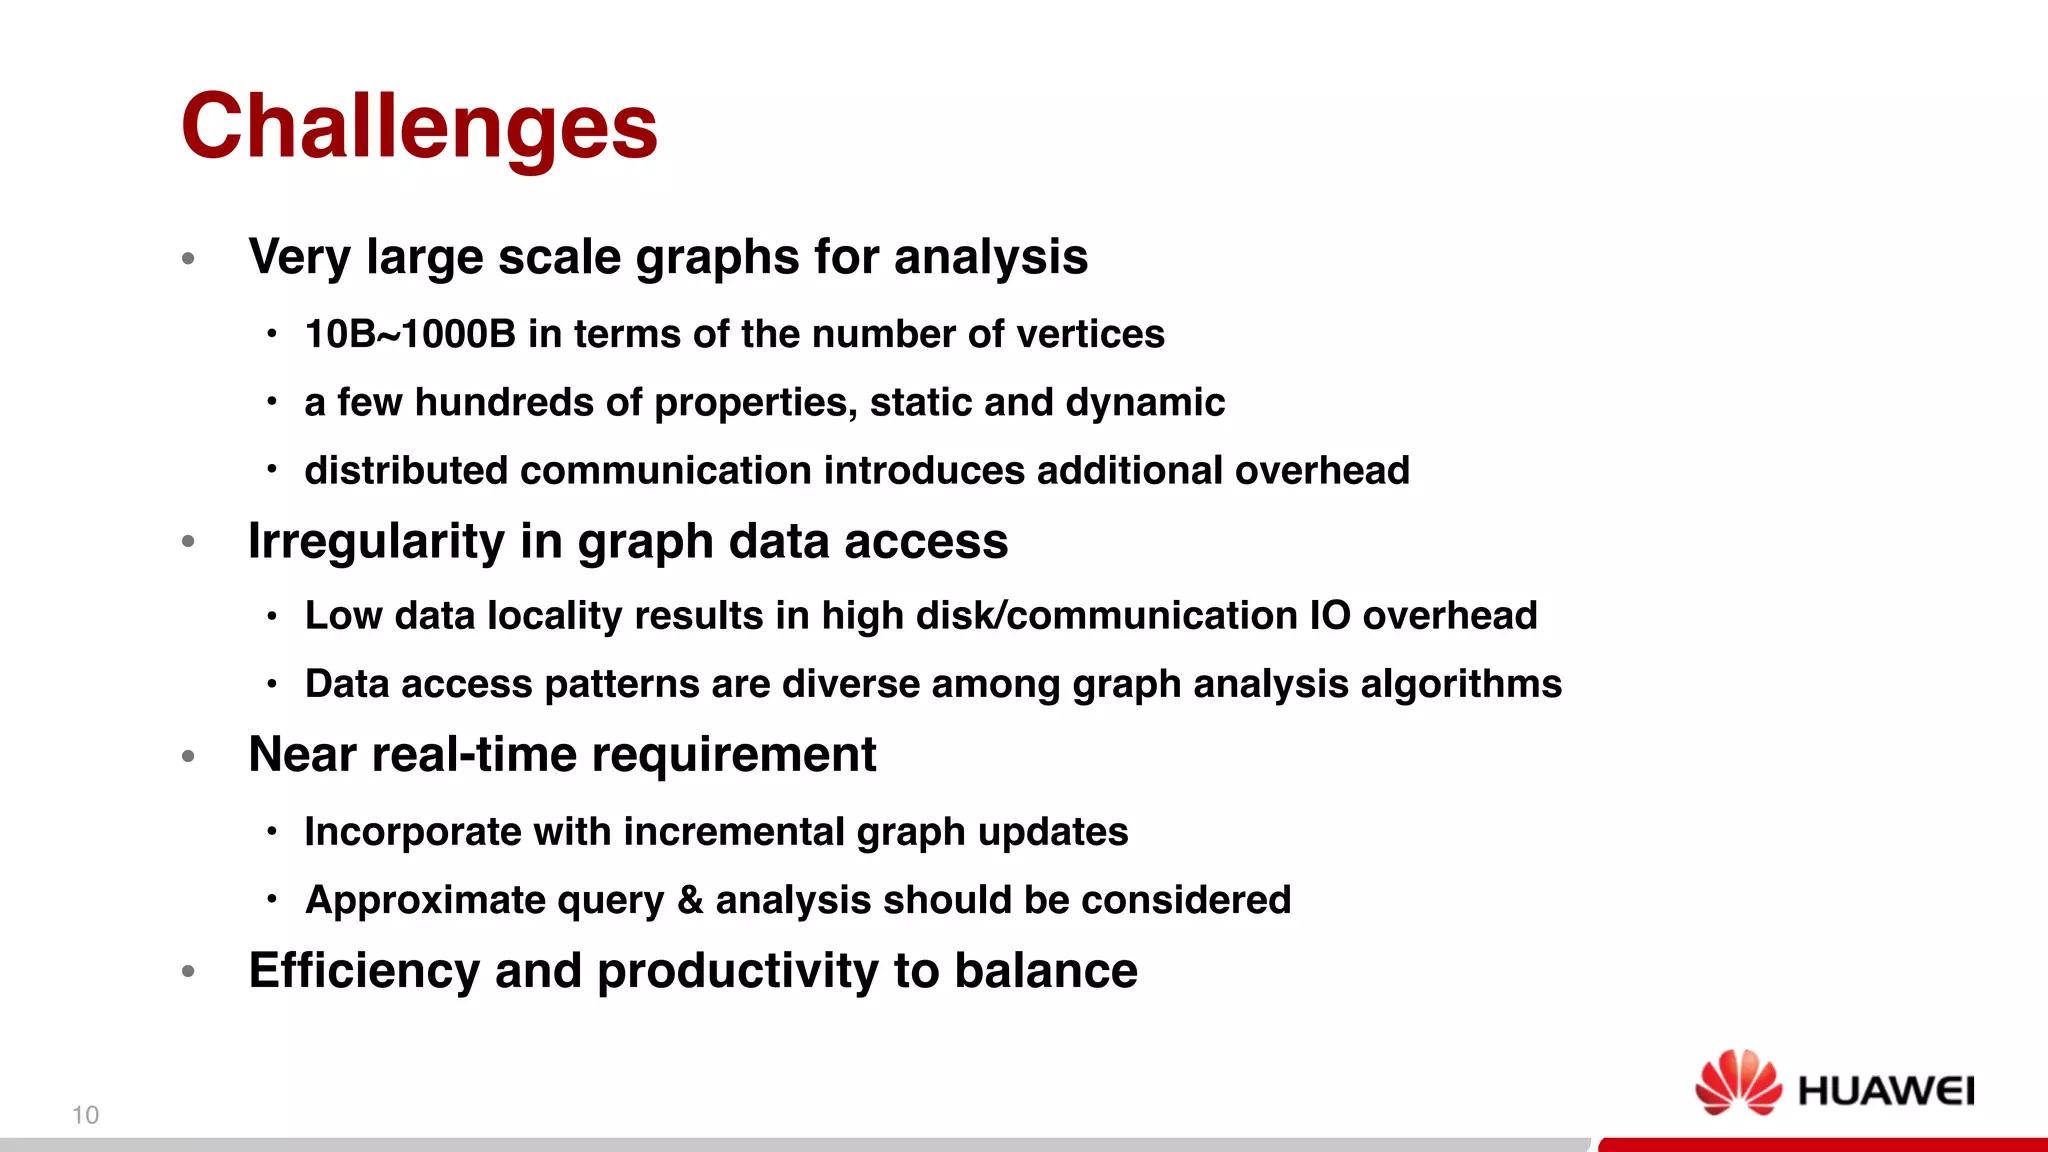


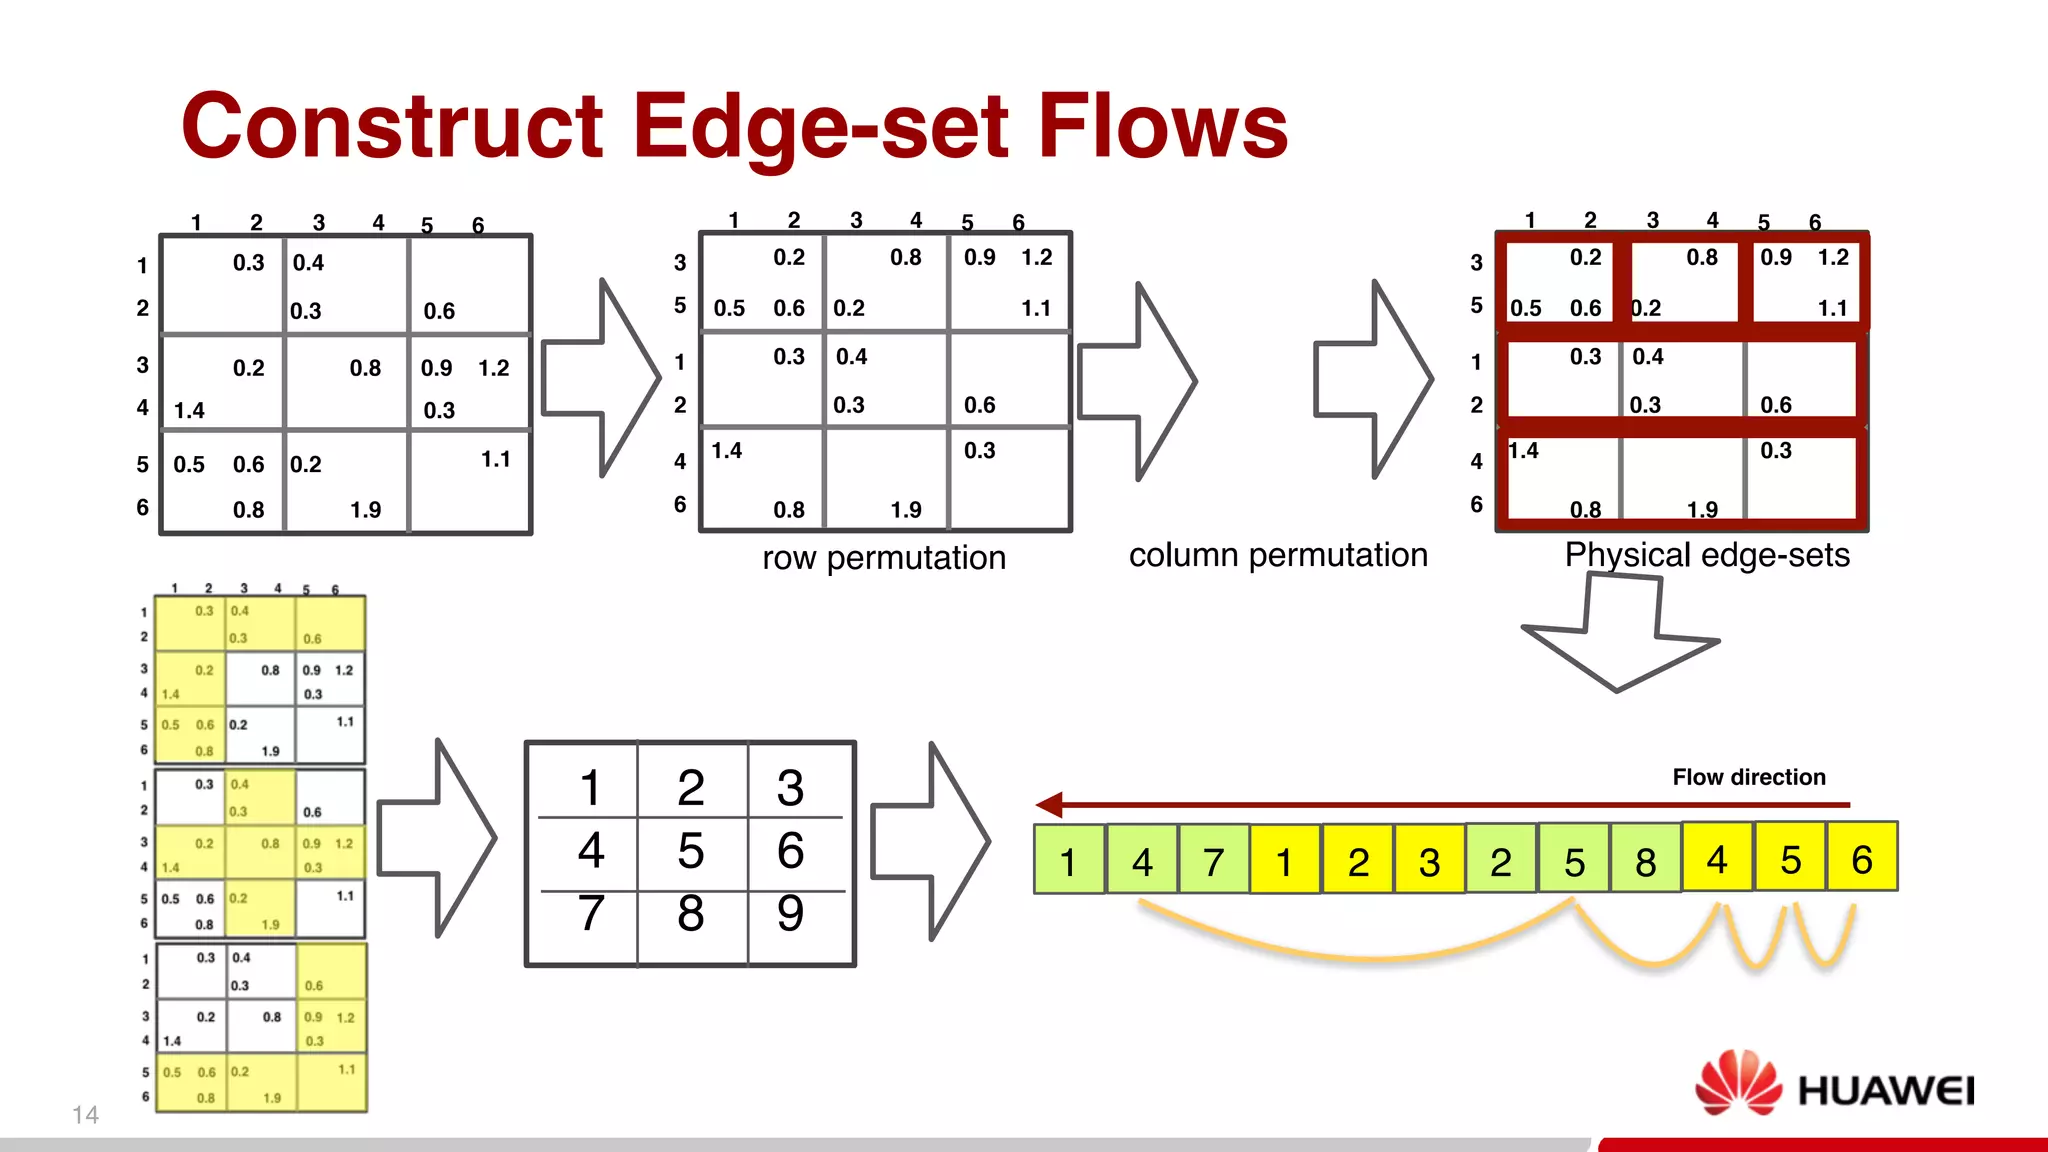

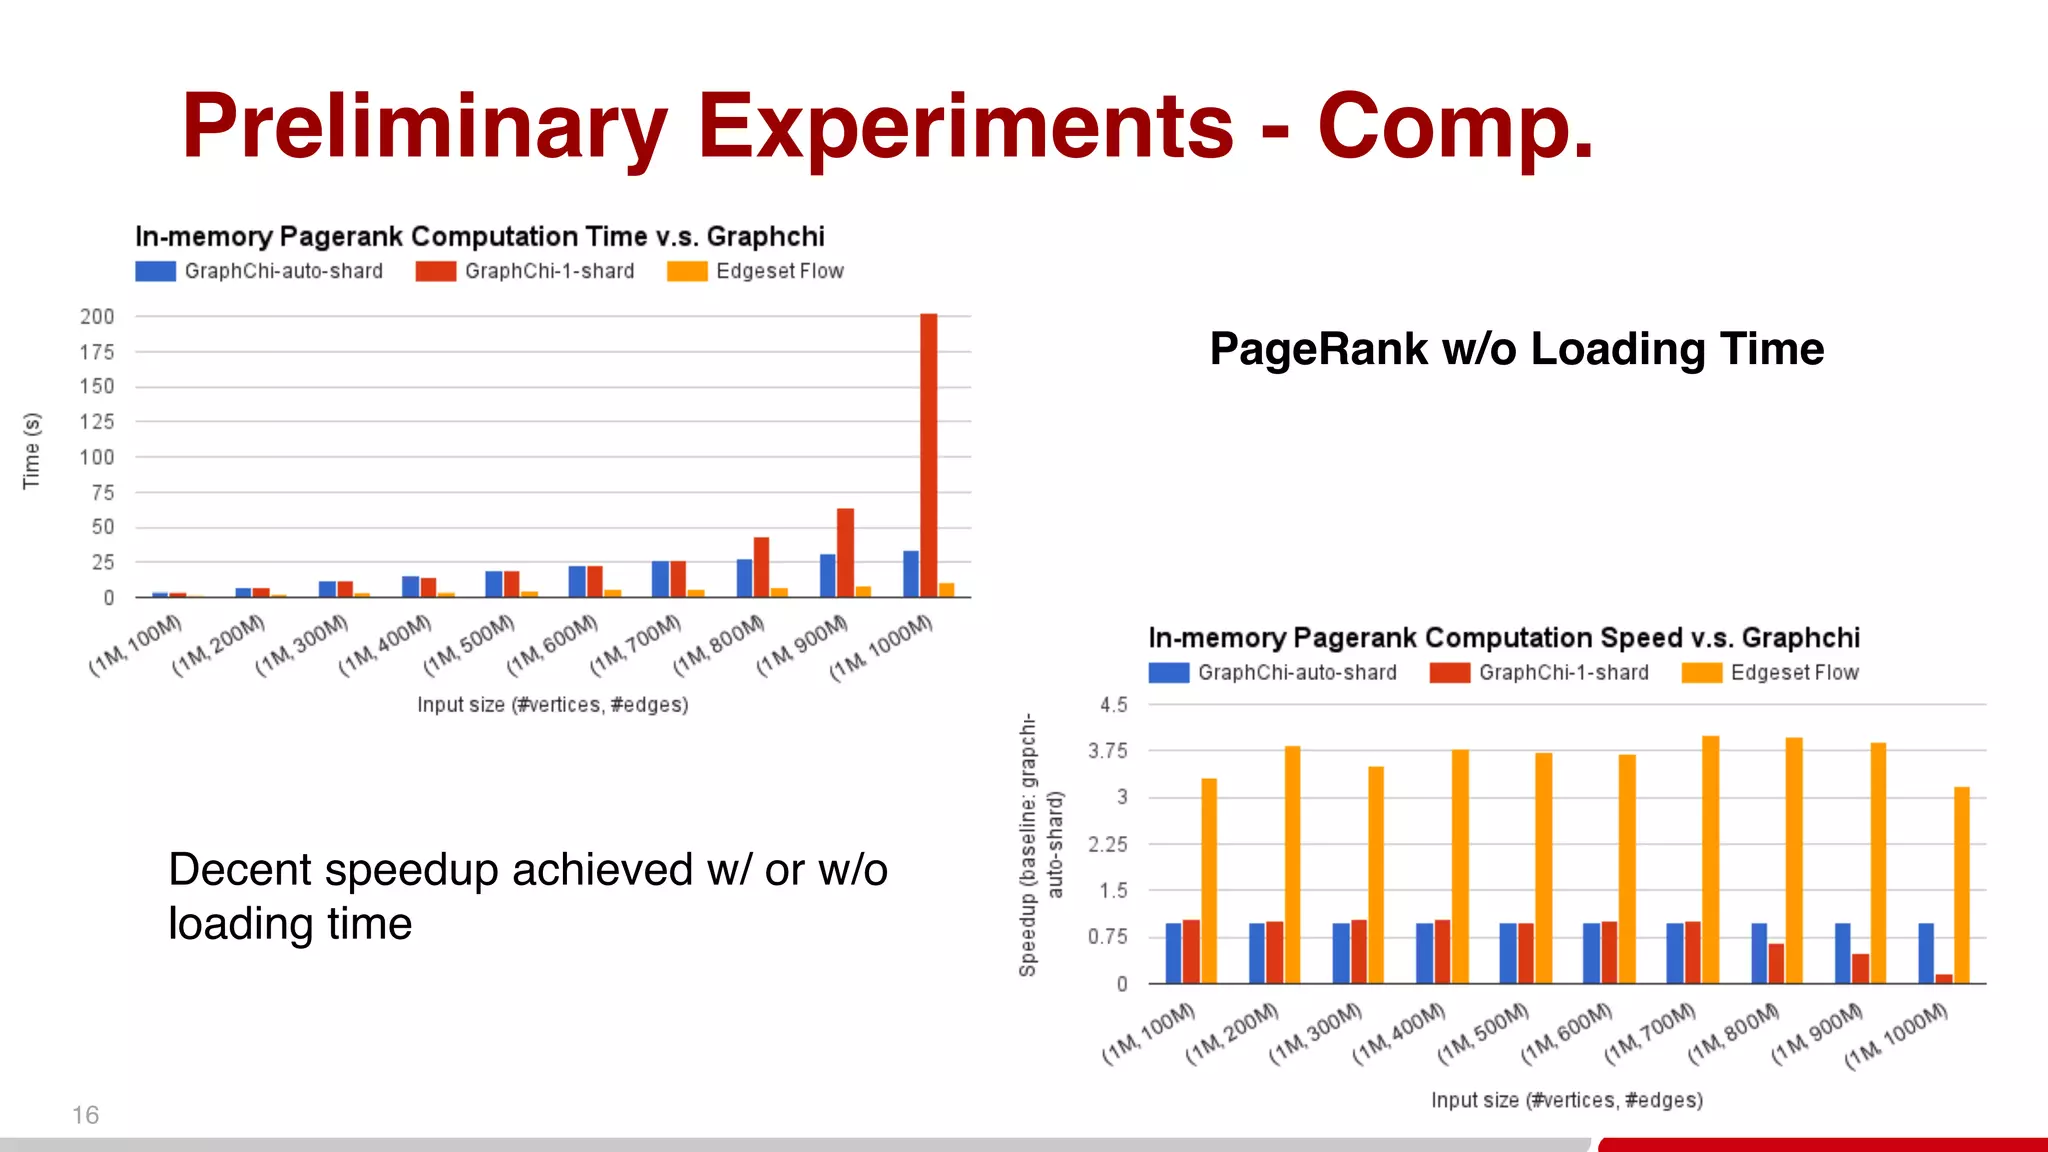


This document discusses big graph analytics engines and challenges in graph analysis. It describes Huawei's growth and collaboration efforts. Key challenges in graph analysis include very large graph sizes, irregular data access patterns, and real-time requirements. The document proposes a graph platform for smart big data that can manage graph topology and properties, provide basic graph algorithms and analytics, and support streaming graph updates and knowledge graph inference. Preliminary experiments show decent speedup for graph preprocessing and PageRank computation using the proposed graph data sharding and edge-set representation.


![Coded Agents – with UiPath SDK + LangGraph [Virtual Hands-on Workshop]](https://cdn.slidesharecdn.com/ss_thumbnails/codedagentsdeck-251215155422-5497c599-thumbnail.jpg?width=640&height=640&fit=bounds)


![Vibe Coding vs. Spec-Driven Development [Free Meetup]](https://cdn.slidesharecdn.com/ss_thumbnails/vibecodingvsspecdrivendevelopment-251209105622-43f455e7-thumbnail.jpg?width=640&height=640&fit=bounds)


