Download as PDF, PPTX


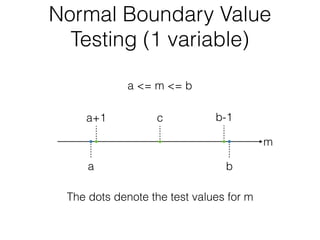
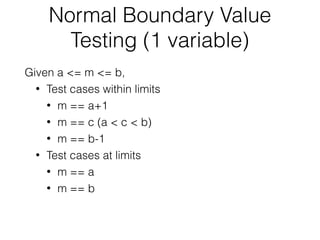
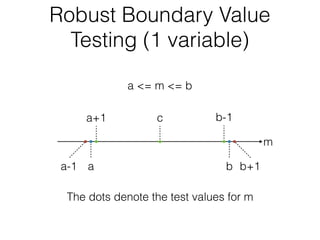
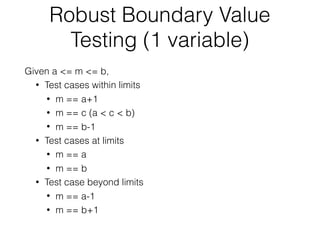
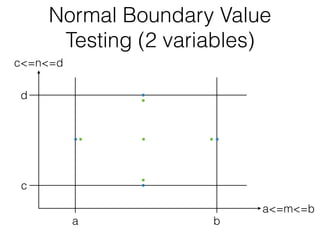
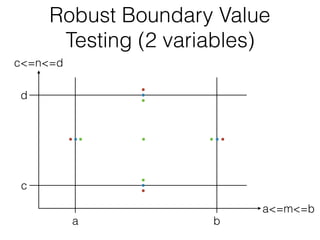
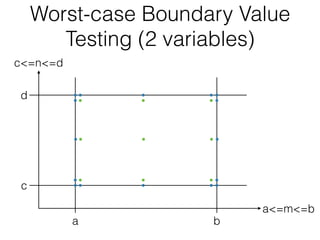
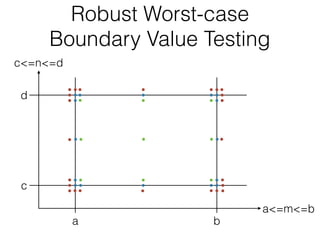
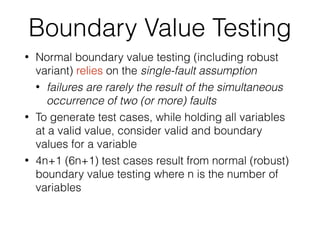
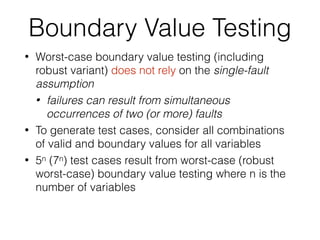
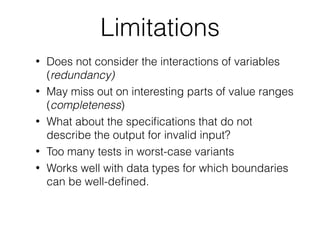

The document discusses boundary value testing, focusing on both normal and robust variants for one and two variables, outlining test cases within and at limits, as well as beyond limits. It highlights the differences between normal boundary value testing, which assumes single-fault conditions, and worst-case boundary value testing, which does not. Additionally, it notes limitations such as not accounting for variable interactions and potential oversaturation of tests in worst-case scenarios.


![Behavior Driven Development [10] - Software Testing Techniques (CIS640)](https://cdn.slidesharecdn.com/ss_thumbnails/bdd-170926180601-thumbnail.jpg?width=640&height=640&fit=bounds)
![Code Coverage [9] - Software Testing Techniques (CIS640)](https://cdn.slidesharecdn.com/ss_thumbnails/code-coverage-170926180427-thumbnail.jpg?width=640&height=640&fit=bounds)
![Equivalence Class Testing [8] - Software Testing Techniques (CIS640)](https://cdn.slidesharecdn.com/ss_thumbnails/equivalence-class-testing-170926175813-thumbnail.jpg?width=640&height=640&fit=bounds)
![Property Based Testing [5] - Software Testing Techniques (CIS640)](https://cdn.slidesharecdn.com/ss_thumbnails/property-based-testing-170926175312-thumbnail.jpg?width=640&height=640&fit=bounds)
![Intro to Python3 [2] - Software Testing Techniques (CIS640)](https://cdn.slidesharecdn.com/ss_thumbnails/intro-to-python3-170926175135-thumbnail.jpg?width=640&height=640&fit=bounds)
![Unit testing [4] - Software Testing Techniques (CIS640)](https://cdn.slidesharecdn.com/ss_thumbnails/unit-testing-170926175035-thumbnail.jpg?width=640&height=640&fit=bounds)
![Testing concepts [3] - Software Testing Techniques (CIS640)](https://cdn.slidesharecdn.com/ss_thumbnails/testing-concepts-170926174731-thumbnail.jpg?width=640&height=640&fit=bounds)
![Introduction [1] - Software Testing Techniques (CIS640)](https://cdn.slidesharecdn.com/ss_thumbnails/introduction-170926174323-thumbnail.jpg?width=640&height=640&fit=bounds)


