Download as PDF, PPTX


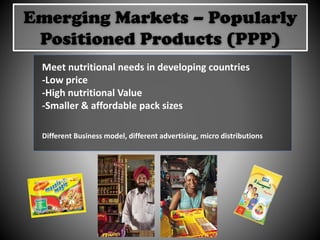
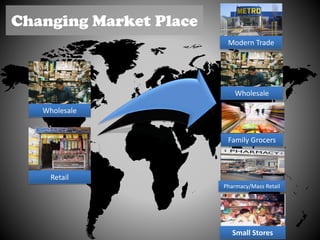
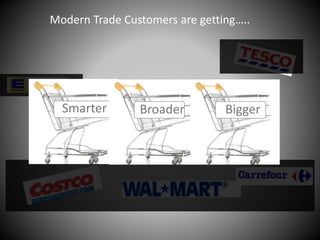
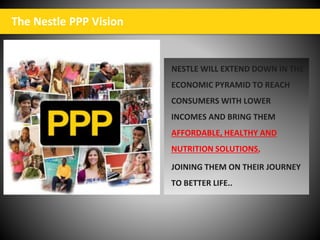


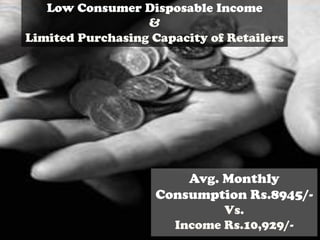

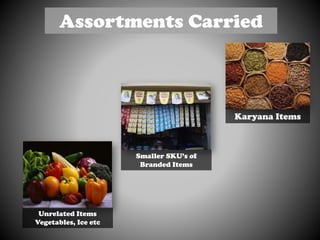


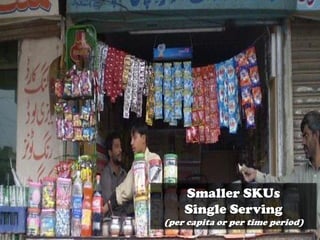


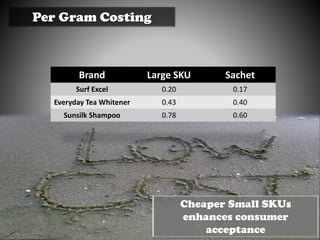

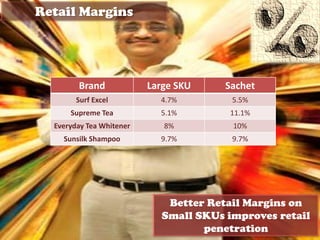


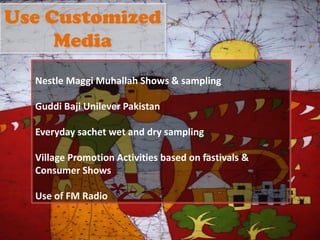
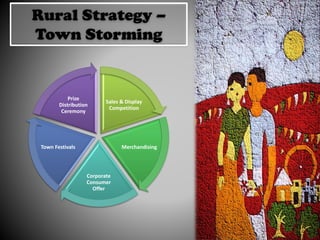
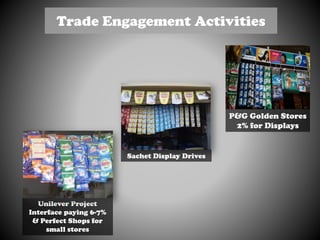


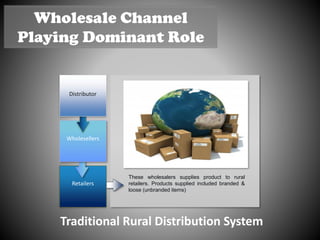
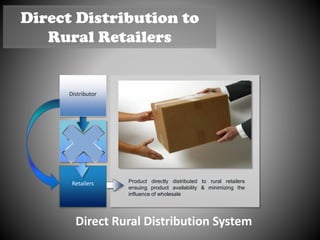
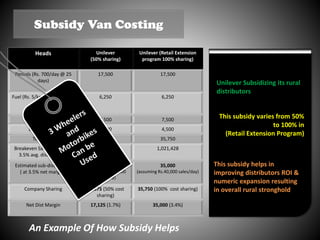

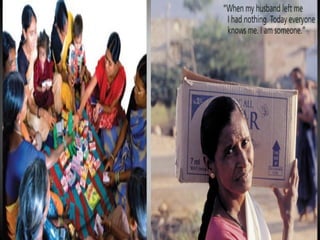
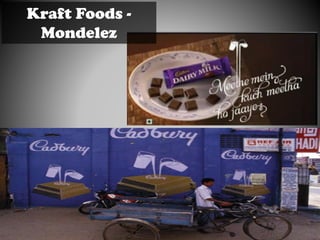
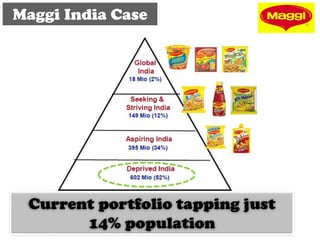
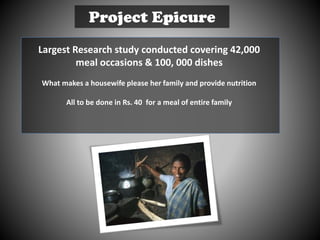

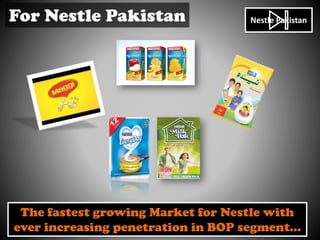

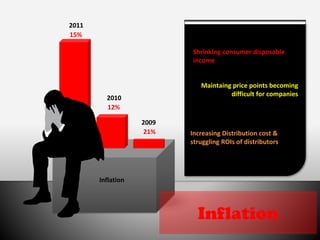
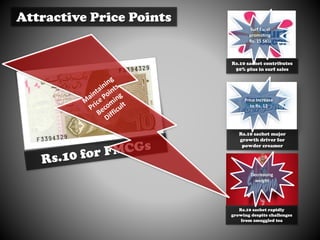


This document discusses Nestle's business strategies for reaching rural and bottom of the pyramid (BOP) consumers. It outlines Nestle's product portfolio, distribution models, and marketing approaches for tapping into this large consumer segment. Specifically, it describes Nestle's focus on (1) small and affordable product sizes, (2) subsidizing rural distribution costs, and (3) culturally relevant local promotions and engagement activities. Case studies of other FMCG companies' rural strategies are also provided. The challenges of inflation and decreasing consumer purchasing power in Pakistan are raised as important factors for companies to address.


