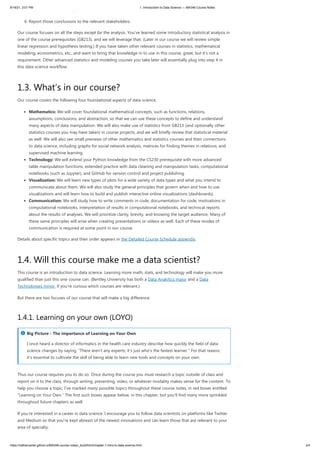
This document provides an introduction to the concepts of data science. It defines data science as an interdisciplinary field drawing from computer science, statistics, and application domains. The document outlines the typical workflow of a data scientist, including obtaining data, exploring it, cleaning it, performing analysis, drawing conclusions, and reporting results. It describes the focus areas of the course as mathematics, technology, visualization, and communication skills. The document emphasizes the importance of learning new skills independently and communicating results effectively to non-technical audiences.
What Is Data Science? Data Science Course - Data Science Tutorial For Beginne...Edureka!
This Edureka Data Science course slides will take you through the basics of Data Science - why Data Science, what is Data Science, use cases, BI vs Data Science, Data Science tools and Data Science lifecycle process. This is ideal for beginners to get started with learning data science.
You can read the blog here: https://goo.gl/OoDCxz
You can also take a complete structured training, check out the details here: https://goo.gl/AfxwBc
A Practical-ish Introduction to Data ScienceMark West
In this talk I will share insights and knowledge that I have gained from building up a Data Science department from scratch. This talk will be split into three sections:
1. I'll begin by defining what Data Science is, how it is related to Machine Learning and share some tips for introducing Data Science to your organisation.
2. Next up well run through some commonly used Machine Learning algorithms used by Data Scientists, along with examples for use cases where these algorithms can be applied.
3. The final third of the talk will be a demonstration of how you can quickly get started with Data Science and Machine Learning using Python and the Open Source scikit-learn Library.
Data Science Tutorial | Introduction To Data Science | Data Science Training ...Edureka!
This Edureka Data Science tutorial will help you understand in and out of Data Science with examples. This tutorial is ideal for both beginners as well as professionals who want to learn or brush up their Data Science concepts. Below are the topics covered in this tutorial:
1. Why Data Science?
2. What is Data Science?
3. Who is a Data Scientist?
4. How a Problem is Solved in Data Science?
5. Data Science Components
Data Science Tutorial | What is Data Science? | Data Science For Beginners | ...Edureka!
** Data Science Certification using R: https://www.edureka.co/data-science **
In this PPT on Data Science Tutorial, you’ll get an in-depth understanding of Data Science and you’ll also learn how it is used in the real world to solve data-driven problems. It’ll cover the following topics in this session:
Need for Data Science
Walmart Use case
What is Data Science?
Who is a Data Scientist?
Data Science – Skill set
Data Science Job roles
Data Life cycle
Introduction to Machine Learning
K- Means Use case
K- Means Algorithm
Hands-On
Data Science certification
Blog Series: http://bit.ly/data-science-blogs
Data Science Training Playlist: http://bit.ly/data-science-playlist
Follow us to never miss an update in the future.
Instagram: https://www.instagram.com/edureka_learning/
Facebook: https://www.facebook.com/edurekaIN/
Twitter: https://twitter.com/edurekain
LinkedIn: https://www.linkedin.com/company/edureka
Big data architectures and the data lakeJames Serra
With so many new technologies it can get confusing on the best approach to building a big data architecture. The data lake is a great new concept, usually built in Hadoop, but what exactly is it and how does it fit in? In this presentation I'll discuss the four most common patterns in big data production implementations, the top-down vs bottoms-up approach to analytics, and how you can use a data lake and a RDBMS data warehouse together. We will go into detail on the characteristics of a data lake and its benefits, and how you still need to perform the same data governance tasks in a data lake as you do in a data warehouse. Come to this presentation to make sure your data lake does not turn into a data swamp!
The process of data warehousing is undergoing rapidtransformation, giving rise to various new terminologies, especially due to theshift from the traditional ETL to the new ELT. Forsomeone new to the process, these additional terminologies and abbreviationsmight seem overwhelming, some may even ask, “Why does it matter if the L comesbefore the T?”
The answer lies in the infrastructure and the setup. Here iswhat the fuss is all about, the sequencing of the words and more importantly,why you should be shifting from ETL to ELT.
Data Science Training | Data Science Tutorial for Beginners | Data Science wi...Edureka!
***** Data Science Training - https://www.edureka.co/data-science *****
This Edureka tutorial on "Data Science Training" will provide you with a detailed and comprehensive training on Data Science, the real-life use cases and the various paths one can take to become a data scientist. It will also help you understand the various phases of Data Science.
Data Science Blog Series: https://goo.gl/1CKTyN
http://www.edureka.co/data-science
What Is Data Science? | Introduction to Data Science | Data Science For Begin...Simplilearn
This Data Science Presentation will help you in understanding what is Data Science, why we need Data Science, prerequisites for learning Data Science, what does a Data Scientist do, Data Science lifecycle with an example and career opportunities in Data Science domain. You will also learn the differences between Data Science and Business intelligence. The role of a data scientist is one of the sexiest jobs of the century. The demand for data scientists is high, and the number of opportunities for certified data scientists is increasing. Every day, companies are looking out for more and more skilled data scientists and studies show that there is expected to be a continued shortfall in qualified candidates to fill the roles. So, let us dive deep into Data Science and understand what is Data Science all about.
This Data Science Presentation will cover the following topics:
1. Need for Data Science?
2. What is Data Science?
3. Data Science vs Business intelligence
4. Prerequisites for learning Data Science
5. What does a Data scientist do?
6. Data Science life cycle with use case
7. Demand for Data scientists
This Data Science with Python course will establish your mastery of data science and analytics techniques using Python. With this Python for Data Science Course, you’ll learn the essential concepts of Python programming and become an expert in data analytics, machine learning, data visualization, web scraping and natural language processing. Python is a required skill for many data science positions, so jumpstart your career with this interactive, hands-on course.
Why learn Data Science?
Data Scientists are being deployed in all kinds of industries, creating a huge demand for skilled professionals. Data scientist is the pinnacle rank in an analytics organization. Glassdoor has ranked data scientist first in the 25 Best Jobs for 2016, and good data scientists are scarce and in great demand. As a data you will be required to understand the business problem, design the analysis, collect and format the required data, apply algorithms or techniques using the correct tools, and finally make recommendations backed by data.
The Data Science with python is recommended for:
1. Analytics professionals who want to work with Python
2. Software professionals looking to get into the field of analytics
3. IT professionals interested in pursuing a career in analytics
4. Graduates looking to build a career in analytics and data science
5. Experienced professionals who would like to harness data science in their fields
The presentation is about the career path in the field of Data Science. Data Science is a multi-disciplinary field that uses scientific methods, processes, algorithms, and systems to extract knowledge and insights from structured and unstructured data.
Tomer Shiran est le fondateur et chef de produit (CPO) de Dremio. Tomer était le 4e employé et vice-président produit de MapR, un pionnier de l'analyse du Big Data. Il a également occupé de nombreux postes de gestion de produits et d'ingénierie chez IBM Research et Microsoft, et a fondé plusieurs sites Web qui ont servi des millions d'utilisateurs. Il est titulaire d'un Master en génie informatique de l'Université Carnegie Mellon et d'un Bachelor of Science en informatique du Technion - Israel Institute of Technology.
Le Modern Data Stack meetup est ravi d'accueillir Tomer Shiran. Depuis Apache Drill, Apache Arrow maintenant Apache Iceberg, il ancre avec ses équipes des choix pour Dremio avec une vision de la plateforme de données “ouverte” basée sur des technologies open source. En plus, de ces valeurs qui évitent le verrouillage de clients dans des formats propriétaires, il a aussi le souci des coûts qu’engendrent de telles plateformes. Il sait aussi proposer un certain nombre de fonctionnalités qui transforment la gestion de données grâce à des initiatives telles Nessie qui ouvre la route du Data As Code et du transactionnel multi-processus.
Le Modern Data Stack Meetup laisse “carte blanche” à Tomer Shiran afin qu’il nous partage son expérience et sa vision quant à l’Open Data Lakehouse.
YouTube Link: https://youtu.be/aGu0fbkHhek
** Data Science Master Program: https://www.edureka.co/masters-program/data-scientist-certification **
This Edureka PPT on "Data Science Full Course" provides an end to end, detailed and comprehensive knowledge on Data Science. This Data Science PPT will start with basics of Statistics and Probability and then moves to Machine Learning and Finally ends the journey with Deep Learning and AI. For Data-sets and Codes discussed in this PPT, drop a comment.
Follow us to never miss an update in the future.
YouTube: https://www.youtube.com/user/edurekaIN
Instagram: https://www.instagram.com/edureka_learning/
Facebook: https://www.facebook.com/edurekaIN/
Twitter: https://twitter.com/edurekain
LinkedIn: https://www.linkedin.com/company/edureka
Data Analyst vs Data Engineer vs Data Scientist | Data Analytics Masters Prog...Edureka!
** Data Analytics Masters' Program: https://www.edureka.co/masters-program/data-analyst-certification **
** Data Scientist Masters' Program: https://www.edureka.co/masters-program/data-scientist-certification **
This Edureka PPT on "Data Analyst vs Data Engineer vs Data Scientist" will help you understand the various similarities and differences between them. Also, you will get a complete roadmap along with the skills required to get into a data-related career. Below topics are covered in this tutorial:
Who is data analyst, data engineer and data scientist?
Roadmap
Required skill-sets
Roles and Responsibilities
Salary Perspective
Follow us to never miss an update in the future.
Instagram: https://www.instagram.com/edureka_learning/
Facebook: https://www.facebook.com/edurekaIN/
Twitter: https://twitter.com/edurekain
LinkedIn: https://www.linkedin.com/company/edureka
Most Common Data Governance Challenges in the Digital EconomyRobyn Bollhorst
Todays’ increasing emphasis on differentiation in the digital economy further complicates the data governance challenge. Learn about today’s common challenges and about the new adaptations that are required to support the digital era. Avoid the pitfalls and follow along on Johnson & Johnson’s journey to:
- Establish and scale a best in class enterprise data governance program
- Identify and focus on the most critical data and information to bolster incremental wins and garner executive support
- Ensure readiness for automation with SAP MDG on HANA
The data lake has become extremely popular, but there is still confusion on how it should be used. In this presentation I will cover common big data architectures that use the data lake, the characteristics and benefits of a data lake, and how it works in conjunction with a relational data warehouse. Then I’ll go into details on using Azure Data Lake Store Gen2 as your data lake, and various typical use cases of the data lake. As a bonus I’ll talk about how to organize a data lake and discuss the various products that can be used in a modern data warehouse.
Data science is different from Data Analytics,Data Engineering,Big Data.
Presentation about Data Science.
What is Data Science its process future and scope.
Data Science Presentation By Amit Singh.
"Sexiest job of 21st century"
Architect’s Open-Source Guide for a Data Mesh ArchitectureDatabricks
Data Mesh is an innovative concept addressing many data challenges from an architectural, cultural, and organizational perspective. But is the world ready to implement Data Mesh?
In this session, we will review the importance of core Data Mesh principles, what they can offer, and when it is a good idea to try a Data Mesh architecture. We will discuss common challenges with implementation of Data Mesh systems and focus on the role of open-source projects for it. Projects like Apache Spark can play a key part in standardized infrastructure platform implementation of Data Mesh. We will examine the landscape of useful data engineering open-source projects to utilize in several areas of a Data Mesh system in practice, along with an architectural example. We will touch on what work (culture, tools, mindset) needs to be done to ensure Data Mesh is more accessible for engineers in the industry.
The audience will leave with a good understanding of the benefits of Data Mesh architecture, common challenges, and the role of Apache Spark and other open-source projects for its implementation in real systems.
This session is targeted for architects, decision-makers, data-engineers, and system designers.
In this presentation, I have talked about Big Data and its importance in brief. I have included the very basics of Data Science and its importance in the present day, through a case study. You can also get an idea about who a data scientist is and what all tasks he performs. A few applications of data science have been illustrated in the end.
Data Architecture Strategies: Building an Enterprise Data Strategy – Where to...DATAVERSITY
The majority of successful organizations in today’s economy are data-driven, and innovative companies are looking at new ways to leverage data and information for strategic advantage. While the opportunities are vast, and the value has clearly been shown across a number of industries in using data to strategic advantage, the choices in technology can be overwhelming. From Big Data to Artificial Intelligence to Data Lakes and Warehouses, the industry is continually evolving to provide new and exciting technological solutions.
This webinar will help make sense of the various data architectures & technologies available, and how to leverage them for business value and success. A practical framework will be provided to generate “quick wins” for your organization, while at the same time building towards a longer-term sustainable architecture. Case studies will also be provided to show how successful organizations have successfully built a data strategies to support their business goals.
[DSC Europe 22] Lakehouse architecture with Delta Lake and Databricks - Draga...DataScienceConferenc1
Dragan Berić will take a deep dive into Lakehouse architecture, a game-changing concept bridging the best elements of data lake and data warehouse. The presentation will focus on the Delta Lake format as the foundation of the Lakehouse philosophy, and Databricks as the primary platform for its implementation.
Whether you are a beginner, a transient, or a data scientist, this plan addresses each individual's needs. You can learn data science in a year if you follow this process.
Cloudera Data Science Challenge 3 Solution by Doug NeedhamDoug Needham
This is my solution for the Cloudera Data Science Challenge 3. I use Spark MLLib for problem1, and Spark GraphX for problem3. Problem2 is "simple" streaming map-reduce.
presentation for a web-based seminar for the "Groupe de travail sur les normes en éducation" based in Québec, who are interested in interoperability for e-portfolio tools
Toward a System Building Agenda for Data Integration(and Dat.docxjuliennehar
Toward a System Building Agenda for Data Integration
(and Data Science)
AnHai Doan, Pradap Konda, Paul Suganthan G.C., Adel Ardalan, Jeffrey R. Ballard, Sanjib Das,
Yash Govind, Han Li, Philip Martinkus, Sidharth Mudgal, Erik Paulson, Haojun Zhang
University of Wisconsin-Madison
Abstract
We argue that the data integration (DI) community should devote far more effort to building systems,
in order to truly advance the field. We discuss the limitations of current DI systems, and point out that
there is already an existing popular DI “system” out there, which is PyData, the open-source ecosystem
of 138,000+ interoperable Python packages. We argue that rather than building isolated monolithic DI
systems, we should consider extending this PyData “system”, by developing more Python packages that
solve DI problems for the users of PyData. We discuss how extending PyData enables us to pursue an
integrated agenda of research, system development, education, and outreach in DI, which in turn can
position our community to become a key player in data science. Finally, we discuss ongoing work at
Wisconsin, which suggests that this agenda is highly promising and raises many interesting challenges.
1 Introduction
In this paper we focus on data integration (DI), broadly interpreted as covering all major data preparation steps
such as data extraction, exploration, profiling, cleaning, matching, and merging [10]. This topic is also known
as data wrangling, munging, curation, unification, fusion, preparation, and more. Over the past few decades, DI
has received much attention (e.g., [37, 29, 31, 20, 34, 33, 6, 17, 39, 22, 23, 5, 8, 36, 15, 35, 4, 25, 38, 26, 32, 19,
2, 12, 11, 16, 2, 3]). Today, as data science grows, DI is receiving even more attention. This is because many
data science applications must first perform DI to combine the raw data from multiple sources, before analysis
can be carried out to extract insights.
Yet despite all this attention, today we do not really know whether the field is making good progress. The
vast majority of DI works (with the exception of efforts such as Tamr and Trifacta [36, 15]) have focused on
developing algorithmic solutions. But we know very little about whether these (ever-more-complex) algorithms
are indeed useful in practice. The field has also built mostly isolated system prototypes, which are hard to use and
combine, and are often not powerful enough for real-world applications. This makes it difficult to decide what
to teach in DI classes. Teaching complex DI algorithms and asking students to do projects using our prototype
systems can train them well for doing DI research, but are not likely to train them well for solving real-world DI
problems in later jobs. Similarly, outreach to real users (e.g., domain scientists) is difficult. Given that we have
Copyright 0000 IEEE. Personal use of this material is permitted. However, permission to reprint/republish this material for
advertising or promotional purpose ...
Demonstration of core knowledgeThe following section demonstrate.docxruthannemcmullen
Demonstration of core knowledge
The following section demonstrates the core knowledge that I am qualified to graduate from Mechanical Engineering graduate program.
This section will focus on two different fields:
· Material properties and Selection
· Simulation of processes
In Material properties and Selection field, the main concept is to identify the different properties of material to meet the requirement of the design. This is the early step for mechanical engineer to select the material for manufacturing products, which means by obtaining this knowledge I am capable of implementing what I learn to help designing a product for a company. For example, the core knowledge that I obtained in one of my graduate classes can demonstrate this field. The final project of the class, shown in Fig 1., is the standard procedure of early design that will be used for manufacturing industries. The result of the project shows that I am capable of using the trade-off plot which include several factors density, Young’s modulus, yield strength, and cost to identify the material that meet constrains and objectives of the design. Moreover, understanding the definition of each material property and the corresponding limitation. Such as density will affect the mass and volume and yield strength indicates the limit if elastic behavior are the basic and also the requirement of being a master student of mechanical engineering.
Fig. 1 Material Selection Trade-off Plot
For the second field, Simulation of processes, before any complex or costly manufacturing process. It is indispensable to run the simulation before the actual process. Not only the error can be predicted in the result of the simulation but the overall result of the end product. For example, the casting process for an impeller, a rotor with blades used to increase the pressure and/or flow of a fluid, is challenging and also easy to fail. However, with the help of simulating the process, shown in Fig. 2 &3, the failure of the casting process is able to be predicted by identifying the location of maximum principle, which the growth of the crack will occur in direction perpendicular to, and maximum normal stress, which the failure will occur, to improve the actual casting process and prevent the failure of a process.
Fig. 2 Identidy the maximum principle stressFig. 3 Identify the maximun normal stress
Both two fields listed above, Material properties and Selection and Simulation of processes,
demonstrate the essential core knowledge that I obtained while studying master of mechanical engineering. The first enable me to determine which material is the most suitable for the product, which allow me to work as a design engineer. The latter help me simulate the manufacturing process which can also help me with my future to work as a process engineer.
1
A Guide for Writing a Technical Research Paper
Libby Shoop
Macalester College, Mathematics and Computer Science Department
1 Introduction
.
Organisering av digitale prosjekt: Hva har IT-bransjen lært om store prosjekter?Torgeir Dingsøyr
IT-bransjen har gjort store endringer i måten de gjennomfører prosjekter på gjennom bruk av smidige metoder. Disse metodene ble først brukt på små, samlokaliserte team men brukes nå også i store prosjekter med mange team og flere hundre utviklere. Hvordan jobber IT-bransjen for å sikre vellykkede store prosjekter?
Presentation for Harvard's ABCD Technology in Education group:
The Institute for Quantitative Social Science (IQSS) is a unique entity at Harvard - it combines research, software development, and specialized services to provide innovative solutions to research and scholarship problems at Harvard and beyond. I will talk about the software projects that IQSS is currently working on (Dataverse, Zelig, Consilience, and OpenScholar), including the research and development processes, the benefits provided to the Harvard community, and the impacts on research and scholarship.
MBA 5401, Management Information Systems 1 Course Lea.docxaryan532920
MBA 5401, Management Information Systems 1
Course Learning Outcomes for Unit III
Upon completion of this unit, students should be able to:
8. Analyze the importance of software, hardware, and telecommunications to the business.
8.1 Examine how technologies such as software, hardware, and telecommunications support
business operations.
8.2 Explain current technologies used in organizations.
8.3 Explain emerging technologies in business.
Reading Assignment
Chapter 5:
IT Infrastructure and Emerging Technologies
Chapter 7:
Telecommunications, the Internet, and Wireless Technology
Unit Lesson
IT Infrastructure and Technology
How are IT infrastructure and emerging technologies important to organizations? In the last unit, we
talked about the role that information technology (IT) plays in organizations and business strategy. In this unit,
we will discuss a natural continuation of that topic with a focus on emerging technologies and communication
technologies such as wireless technology, the Internet, and telecommunications.
What is IT infrastructure? If you remember from the textbook reading in Chapter 1, our IT infrastructure
includes the shared technology resources that provide the platform supporting our information systems
applications. IT infrastructure includes everything technical that supports the business. It supports both the
business and IT strategies.
Think of it this way: If our strategy is to offer our customer a specific service such as electronic invoicing
(EDI), how can we do that without the infrastructure in place to carry out that goal? The IT infrastructure in this
case is the EDI software, the hardware (a server, database, and the Internet), the personnel, educational
services, management services, and so on.
How has the IT infrastructure evolved over time? Most of us have a sense of the scope’s answer to this
question. It is enormous! Just look at computers—the first ones were huge. Businesses used mainframes the
size of trucks, and now servers are the size of a desktop.
Simple applications of the past have now become suites, or bundles of applications that can work together.
Now, there are enterprise-level applications that help improve an organization’s productivity and efficiency via
a collection of programs with common business applications. They are designed to be customizable to solve
enterprise-wide problems rather than personal or departmental problems.
In addition, there are newly emerging enterprise-level tools such as enterprise database management
software. Again, this concept of enterprise level takes the already existing tools to a different level to answer
the need for more storage and enterprise-wide sharing.
Years ago, dialing into the Internet meant using a slow modem. Now, businesses can use fiber-optic and
wireless technologies. In the past, for small to medium-sized organizations, many of the emerging
UNIT III STUDY GUIDE
Infrastru ...
The French Revolution, which began in 1789, was a period of radical social and political upheaval in France. It marked the decline of absolute monarchies, the rise of secular and democratic republics, and the eventual rise of Napoleon Bonaparte. This revolutionary period is crucial in understanding the transition from feudalism to modernity in Europe.
For more information, visit-www.vavaclasses.com
We all have good and bad thoughts from time to time and situation to situation. We are bombarded daily with spiraling thoughts(both negative and positive) creating all-consuming feel , making us difficult to manage with associated suffering. Good thoughts are like our Mob Signal (Positive thought) amidst noise(negative thought) in the atmosphere. Negative thoughts like noise outweigh positive thoughts. These thoughts often create unwanted confusion, trouble, stress and frustration in our mind as well as chaos in our physical world. Negative thoughts are also known as “distorted thinking”.
Ethnobotany and Ethnopharmacology:
Ethnobotany in herbal drug evaluation,
Impact of Ethnobotany in traditional medicine,
New development in herbals,
Bio-prospecting tools for drug discovery,
Role of Ethnopharmacology in drug evaluation,
Reverse Pharmacology.
Model Attribute Check Company Auto PropertyCeline George
In Odoo, the multi-company feature allows you to manage multiple companies within a single Odoo database instance. Each company can have its own configurations while still sharing common resources such as products, customers, and suppliers.
Synthetic Fiber Construction in lab .pptxPavel ( NSTU)
Synthetic fiber production is a fascinating and complex field that blends chemistry, engineering, and environmental science. By understanding these aspects, students can gain a comprehensive view of synthetic fiber production, its impact on society and the environment, and the potential for future innovations. Synthetic fibers play a crucial role in modern society, impacting various aspects of daily life, industry, and the environment. ynthetic fibers are integral to modern life, offering a range of benefits from cost-effectiveness and versatility to innovative applications and performance characteristics. While they pose environmental challenges, ongoing research and development aim to create more sustainable and eco-friendly alternatives. Understanding the importance of synthetic fibers helps in appreciating their role in the economy, industry, and daily life, while also emphasizing the need for sustainable practices and innovation.
How to Create Map Views in the Odoo 17 ERPCeline George
The map views are useful for providing a geographical representation of data. They allow users to visualize and analyze the data in a more intuitive manner.
2024.06.01 Introducing a competency framework for languag learning materials ...Sandy Millin
http://sandymillin.wordpress.com/iateflwebinar2024
Published classroom materials form the basis of syllabuses, drive teacher professional development, and have a potentially huge influence on learners, teachers and education systems. All teachers also create their own materials, whether a few sentences on a blackboard, a highly-structured fully-realised online course, or anything in between. Despite this, the knowledge and skills needed to create effective language learning materials are rarely part of teacher training, and are mostly learnt by trial and error.
Knowledge and skills frameworks, generally called competency frameworks, for ELT teachers, trainers and managers have existed for a few years now. However, until I created one for my MA dissertation, there wasn’t one drawing together what we need to know and do to be able to effectively produce language learning materials.
This webinar will introduce you to my framework, highlighting the key competencies I identified from my research. It will also show how anybody involved in language teaching (any language, not just English!), teacher training, managing schools or developing language learning materials can benefit from using the framework.
The Roman Empire A Historical Colossus.pdfkaushalkr1407
The Roman Empire, a vast and enduring power, stands as one of history's most remarkable civilizations, leaving an indelible imprint on the world. It emerged from the Roman Republic, transitioning into an imperial powerhouse under the leadership of Augustus Caesar in 27 BCE. This transformation marked the beginning of an era defined by unprecedented territorial expansion, architectural marvels, and profound cultural influence.
The empire's roots lie in the city of Rome, founded, according to legend, by Romulus in 753 BCE. Over centuries, Rome evolved from a small settlement to a formidable republic, characterized by a complex political system with elected officials and checks on power. However, internal strife, class conflicts, and military ambitions paved the way for the end of the Republic. Julius Caesar’s dictatorship and subsequent assassination in 44 BCE created a power vacuum, leading to a civil war. Octavian, later Augustus, emerged victorious, heralding the Roman Empire’s birth.
Under Augustus, the empire experienced the Pax Romana, a 200-year period of relative peace and stability. Augustus reformed the military, established efficient administrative systems, and initiated grand construction projects. The empire's borders expanded, encompassing territories from Britain to Egypt and from Spain to the Euphrates. Roman legions, renowned for their discipline and engineering prowess, secured and maintained these vast territories, building roads, fortifications, and cities that facilitated control and integration.
The Roman Empire’s society was hierarchical, with a rigid class system. At the top were the patricians, wealthy elites who held significant political power. Below them were the plebeians, free citizens with limited political influence, and the vast numbers of slaves who formed the backbone of the economy. The family unit was central, governed by the paterfamilias, the male head who held absolute authority.
Culturally, the Romans were eclectic, absorbing and adapting elements from the civilizations they encountered, particularly the Greeks. Roman art, literature, and philosophy reflected this synthesis, creating a rich cultural tapestry. Latin, the Roman language, became the lingua franca of the Western world, influencing numerous modern languages.
Roman architecture and engineering achievements were monumental. They perfected the arch, vault, and dome, constructing enduring structures like the Colosseum, Pantheon, and aqueducts. These engineering marvels not only showcased Roman ingenuity but also served practical purposes, from public entertainment to water supply.
Students, digital devices and success - Andreas Schleicher - 27 May 2024..pptxEduSkills OECD
Andreas Schleicher presents at the OECD webinar ‘Digital devices in schools: detrimental distraction or secret to success?’ on 27 May 2024. The presentation was based on findings from PISA 2022 results and the webinar helped launch the PISA in Focus ‘Managing screen time: How to protect and equip students against distraction’ https://www.oecd-ilibrary.org/education/managing-screen-time_7c225af4-en and the OECD Education Policy Perspective ‘Students, digital devices and success’ can be found here - https://oe.cd/il/5yV
How to Make a Field invisible in Odoo 17Celine George
It is possible to hide or invisible some fields in odoo. Commonly using “invisible” attribute in the field definition to invisible the fields. This slide will show how to make a field invisible in odoo 17.
1. 9/18/21, 3:01 PM 1. Introduction to Data Science — MA346 Course Notes
https://nathancarter.github.io/MA346-course-notes/_build/html/chapter-1-intro-to-data-science.html 1/4
1. Introduction to Data Science
See also the slides that summarize a portion of this content.
1.1. What is data science?
The term “data science” was coined in 2001, attempting to describe a new field. Some argue that it’s nothing
more than the natural evolution of statistics, and shouldn’t be called a new field at all. But others argue that it’s
more interdisciplinary. For example, in The Data Science Design Manual (2017), Steven Skiena says the following.
I think of data science as lying at the intersection of computer science, statistics, and substantive
application domains. From computer science comes machine learning and high-performance
computing technologies for dealing with scale. From statistics comes a long tradition of exploratory
data analysis, significance testing, and visualization. From application domains in business and the
sciences comes challenges worthy of battle, and evaluation standards to assess when they have been
adequately conquered.
This echoes a famous blog post by Drew Conway in 2013, called The Data Science Venn Diagram, in which he
drew the following diagram to indicate the various fields that come together to form what we call “data science.”
Regardless of whether data science is just a part of statistics, and regardless of the domain to which we’re
applying data science, the goal is the same: to turn data into actionable value. The professional society
INFORMS defines the related field of analytics as “the scientific process of transforming data into insight for
making better decisions.”
1.2. What do data scientists do?
Turning data into actionable value usually involves answering questions using data. Here’s a typical workflow for
how that plays out in practice.
1. Obtain data that you hope will help answer the question.
2. Explore the data to understand it.
3. Clean and prepare the data for analysis.
4. Perform analysis, model building, testing, etc.
(The analysis is the step most people think of as data science, but it’s just one step! Notice how much more
there is that surrounds it.)
5. Draw conclusions from your work.
Contents
1.1. What is data science?
1.2. What do data scientists do?
1.3. What’s in our course?
1.4. Will this course make me a data
scientist?
1.4.1. Learning on your own (LOYO)
1.4.2. Excellent communication
1.5. Where should I start?
2. 9/18/21, 3:01 PM 1. Introduction to Data Science — MA346 Course Notes
https://nathancarter.github.io/MA346-course-notes/_build/html/chapter-1-intro-to-data-science.html 2/4
y
6. Report those conclusions to the relevant stakeholders.
Our course focuses on all the steps except for the analysis. You’ve learned some introductory statistical analysis in
one of the course prerequisites (GB213), and we will leverage that. (Later in our course we will review simple
linear regression and hypothesis testing.) If you have taken other relevant courses in statistics, mathematical
modeling, econometrics, etc., and want to bring that knowledge in to use in this course, great, but it’s not a
requirement. Other advanced statistics and modeling courses you take later will essentially plug into step 4 in
this data science workflow.
1.3. What’s in our course?
Our course covers the following four foundational aspects of data science.
Mathematics: We will cover foundational mathematical concepts, such as functions, relations,
assumptions, conclusions, and abstraction, so that we can use these concepts to define and understand
many aspects of data manipulation. We will also make use of statistics from GB213 (and optionally other
statistics courses you may have taken) in course projects, and we will briefly review that statistical material
as well. We will also see small previews of other mathematics and statistics courses and their connections
to data science, including graphs for social network analysis, matrices for finding themes in relations, and
supervised machine learning.
Technology: We will extend your Python knowledge from the CS230 prerequisite with more advanced
table manipulation functions, extended practice with data cleaning and manipulation tasks, computational
notebooks (such as Jupyter), and GitHub for version control and project publishing.
Visualization: We will learn new types of plots for a wide variety of data types and what you intend to
communicate about them. We will also study the general principles that govern when and how to use
visualizations and will learn how to build and publish interactive online visualizations (dashboards).
Communication: We will study how to write comments in code, documentation for code, motivations in
computational notebooks, interpretation of results in computational notebooks, and technical reports
about the results of analyses. We will prioritize clarity, brevity, and knowing the target audience. Many of
these same principles will arise when creating presentations or videos as well. Each of these modes of
communication is required at some point in our course.
Details about specific topics and their order appears in the Detailed Course Schedule appendix.
1.4. Will this course make me a data scientist?
This course is an introduction to data science. Learning more math, stats, and technology will make you more
qualified than just this one course can. (Bentley University has both a Data Analytics major and a Data
Technologies minor, if you’re curious which courses are relevant.)
But there are two focuses of our course that will make a big difference:
1.4.1. Learning on your own (LOYO)
Thus our course requires you to do so. Once during the course you must research a topic outside of class and
report on it to the class, through writing, presenting, video, or whatever modality makes sense for the content. To
help you choose a topic, I’ve marked many possible topics throughout these course notes, in red boxes entitled
“Learning on Your Own.” The first such boxes appear below, in this chapter, but you’ll find many more sprinkled
throughout future chapters as well.
If you’re interested in a career in data science, I encourage you to follow data scientists on platforms like Twitter
and Medium so that you’re kept abreast of the newest innovations and can learn those that are relevant to your
area of specialty.
I once heard a director of informatics in the health care industry describe how quickly the field of data
science changes by saying, “There aren’t any experts; it’s just who’s the fastest learner.” For that reason,
it’s essential to cultivate the skill of being able to learn new tools and concepts on your own.
Big Picture - The importance of Learning on Your Own
3. 9/18/21, 3:01 PM 1. Introduction to Data Science — MA346 Course Notes
https://nathancarter.github.io/MA346-course-notes/_build/html/chapter-1-intro-to-data-science.html 3/4
1.4.2. Excellent communication
This was already mentioned earlier, but I will re-emphasize it here, because of its importance. In a meeting
between the Bentley University Career Services office and about a dozen employers of our graduates, the
employers were asked whether they preferred technical knowledge or what some call “soft skills” and others call
“power skills,” which include communication perhaps first and foremost. Unanimously every employer chose the
latter.
Consequently our course will contain several opportunities for you to exercise your communication skills and
receive feedback from the instructor on doing so. See the comments under the “communication” bullet above,
and the course outline in the appendix. The first such opportunities appear immediately below.
1.5. Where should I start?
There are several topics you can investigate on your own that will help you get a leg up in our course. None of
these topics is required for our course, but each is available for you to investigate outside of class and report
back, to fulfill the “Learning on Your Own” requirement mentioned above.
A report on file explorers and shell commands would address all of the following points.
What the folder tree/hierarchy is
What a file path is and how they are written differently on Windows and OS X
How to accomplish each of the following tasks from both the file explorer and the command prompt
Navigate to your home folder
Move one step up/down the folder hierarchy
Copy a file
Move a file
From the command prompt:
How to list all files in the current folder
How to view the contents of a text file
From the file explorer:
What happens when you double-click a file in a file explorer
What file extensions are used for
What are some of the dangers of changing a file extension
Data science is about turning data into actionable knowledge. If a data scientist cannot take the results
of their analysis and effectively communicate them to decision makers, they have not turned data into
actionable knowledge, and have therefore failed at their goal. Even if the insights are brilliant, if they
are never shared with those who need them, they achieve nothing. Good communication is essential for
data work.
Big Picture - The importance of communication
On Windows, the file explorer is called Windows Explorer; on Mac, it is called Finder. It is essential that
every computer-literate person knows how to use these tools. Most of the actions you can take with
your mouse in Windows Explorer or OS X Finder can also be taken using commands at a command
prompt. On Windows, this prompt can be found by running command.exe; on Mac, it can be found in
Terminal.app. It is very useful to know how to do at least basic file manipulation tools with the
command prompt, because it enables you to perform the same actions in cloud computing
evironments where a file explorer may not be available.
Learning on Your Own - File Explorers and Shell Commands