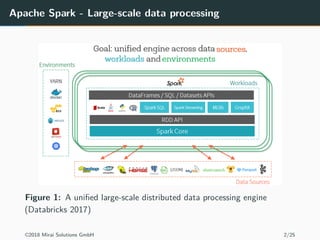
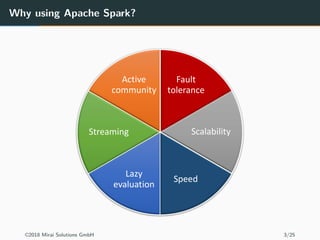
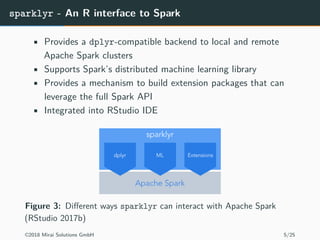
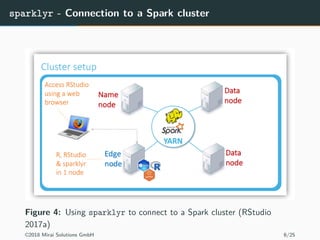
Big Data Analytics in R using sparklyr
Nicola Lambiase - Mirai Solutions
8th
January 2018
©2018 Mirai Solutions GmbH 1/25
Apache Spark - Large-scale data processing
Figure 1: A unified large-scale distributed data processing engine
(Databricks 2017)
©2018 Mirai Solutions GmbH 2/25
Why using Apache Spark?
©2018 Mirai Solutions GmbH 3/25
Spark cluster components
Figure 2: Overview of Spark cluster components (Apache Spark 2018)
©2018 Mirai Solutions GmbH 4/25
sparklyr - An R interface to Spark
• Provides a dplyr-compatible backend to local and remote
Apache Spark clusters
• Supports Spark’s distributed machine learning library
• Provides a mechanism to build extension packages that can
leverage the full Spark API
• Integrated into RStudio IDE
Figure 3: Different ways sparklyr can interact with Apache Spark
(RStudio 2017b)
©2018 Mirai Solutions GmbH 5/25
sparklyr - Connection to a Spark cluster
Figure 4: Using sparklyr to connect to a Spark cluster (RStudio
2017a)
©2018 Mirai Solutions GmbH 6/25
sparklyr - How does it work?
• S3 class tbl_spark provides a dplyr-compatible reference to a (remote)
Spark DataFrame
• dplyr verbs/commands are translated into Spark SQL statements which
are then executed on Spark
• dplyr operations are lazy
• data is never pulled into R unless you explicitly ask for it (e.g.
collect, count, etc.)
• it delays work until the last possible moment
• sparklyr’s sdf_* functions access the Spark DataFrame API directly
• these functions will generally force any pending SQL
operations in a dplyr pipeline
• sparklyr’s spark_connection implements a DBI interface for Spark
©2018 Mirai Solutions GmbH 7/25
sparklyr - Connecting to Spark and loading data
library(sparklyr)
library(dplyr)
library(nycflights13)
sc <- spark_connect(master = "local")
flights <- copy_to(sc, flights, "flights")
src_tbls(sc)
[1] "flights"
Figure 5: Spark integration in the RStudio IDE
©2018 Mirai Solutions GmbH 8/25
sparklyr - Using dplyr verbs in a pipeline
# Find the most delayed connections
most_delayed <- flights %>%
group_by(origin, dest) %>%
summarize(avg_dep_delay = mean(dep_delay)) %>%
arrange(desc(avg_dep_delay))
©2018 Mirai Solutions GmbH 9/25
sparklyr - Spark SQL
> dbplyr::sql_render(most_delayed)
SELECT * FROM (SELECT `origin`, `dest`,
AVG(`dep_delay`) AS `avg_dep_delay` FROM
`flights` GROUP BY `origin`, `dest`) `drurrvydlq`
ORDER BY `avg_dep_delay` DESC
©2018 Mirai Solutions GmbH 10/25
sparklyr - Retrieve data
# Collecting data into R's memory
most_delayed %>% head(10)
origin dest avg_dep_delay
EWR TYS 41.81847
EWR CAE 36.33684
EWR TUL 34.90635
LGA SBN 31.33333
EWR OKC 30.56881
LGA BHM 29.77860
LGA CAE 29.50000
EWR DSM 29.32824
EWR JAC 28.70000
EWR ROC 27.86122
©2018 Mirai Solutions GmbH 11/25
sparklyr - Spark connection as DBI interface
library(DBI)
dbGetQuery(sc, "SELECT origin, dest, dep_delay
FROM flights
WHERE dep_delay < 0
ORDER BY dep_delay
LIMIT 5")
origin dest dep_delay
JFK DEN -43
LGA MSY -33
LGA IAD -32
LGA TPA -30
LGA DEN -27
©2018 Mirai Solutions GmbH 12/25
Google BigQuery
A fast and highly scalable enterprise data warehouse for analytics
• Serverless and automatic high availability
• Petabyte scale
• High-speed streaming insertion API for real-time analytics
• Standard, ANSI:2011 compliant SQL dialect
• Free for up to 1TB of data analyzed each month and 10GB of
data stored
©2018 Mirai Solutions GmbH 13/25
sparkbq - Google BigQuery support for sparklyr
• sparklyr extension package for Google BigQuery
• Read/write BigQuery data directly into/from Spark (without
having to go through R - cf. bigrquery)
Figure 6: https://github.com/miraisolutions/sparkbq
©2018 Mirai Solutions GmbH 14/25
Example: Shakespeare public dataset (1)
library(sparklyr)
library(sparkbq)
library(dplyr)
config <- spark_config()
sc <- spark_connect(master = "local", config = config)
# Set Google BigQuery default settings
bigquery_defaults(
billingProjectId = "<your_billing_project_id>",
gcsBucket = "<your_gcs_bucket>",
datasetLocation = "US"
)
©2018 Mirai Solutions GmbH 15/25
Example: Shakespeare public dataset (2)
# Reading the public shakespeare data table
# https://cloud.google.com/bigquery/public-data/
# https://cloud.google.com/bigquery/sample-tables
hamlet <-
spark_read_bigquery(
sc,
name = "shakespeare",
projectId = "bigquery-public-data",
datasetId = "samples",
tableId = "shakespeare") %>%
# NOTE: predicate pushdown to BigQuery!
filter(corpus == "hamlet") %>%
collect()
©2018 Mirai Solutions GmbH 16/25
Example: NYC Taxi data (1)
• Dataset including records from all trips completed in Yellow
taxis in NYC from 2009 to 2016.
• Records include:
• pick-up and drop-off dates/times and locations
• trip distances
• fares, tips and payment types
• driver-reported passenger counts
• etc.
• R Markdown document: https://goo.gl/xM5NVC
• Knitted HTML document: https://goo.gl/SMrFXB
©2018 Mirai Solutions GmbH 17/25
Example: NYC Taxi data (2)
Querying and (lazily) binding together all the NYC TLC yellow trips
(2009-2016):
all_trips_spark_by_year <-
lapply(2009:2016, function(year) {
spark_read_bigquery(
sc = sc,
name = paste0("trips", year),
projectId = "bigquery-public-data",
datasetId = "new_york",
tableId = paste0("tlc_yellow_trips_", year),
repartition = 400
)
})
all_trips_spark <- Reduce(union_all, all_trips_spark_by_year)
©2018 Mirai Solutions GmbH 18/25
Example: NYC Taxi data (3)
Calculate average tip (as percentage of the fare amount) per NYC
neighborhood:
credit_trips_spark_1 <-
all_trips_spark %>%
filter(
# Trips paid by credit card
payment_type %in% c("CREDIT", "CRD", "1") &
# Filter out bad data points
fare_amount > 1 & tip_amount >= 0 &
trip_distance > 0 & passenger_count > 0
) %>%
select(
vendor_id, pickup_datetime, dropoff_datetime,
pickup_latitude, pickup_longitude, trip_distance,
passenger_count, fare_amount, tip_amount
)
©2018 Mirai Solutions GmbH 19/25
Example: NYC Taxi data (4)
credit_trips_spark_2 <- credit_trips_spark_1 %>%
# Join with NYC neighborhoods
sparkgeo::sdf_spatial_join(neighborhoods, pickup_latitude,
pickup_longitude) %>%
# NOTE: timestamps are currently returned as microseconds
# since the epoch
mutate(
trip_duration = (dropoff_datetime - pickup_datetime) / 1e6,
pickup_datetime = from_unixtime(pickup_datetime / 1e6)
) %>%
mutate(
pickup_month = month(pickup_datetime),
pickup_weekday = date_format(pickup_datetime, 'EEEE'),
pickup_hour = hour(pickup_datetime),
# Calculate tip percentage based on fare amount
tip_pct = tip_amount / fare_amount * 100
)
©2018 Mirai Solutions GmbH 20/25
Example: NYC Taxi data (5)
credit_trips_spark <- credit_trips_spark_2 %>%
select(
vendor_id, pickup_month,
pickup_weekday, pickup_hour,
neighborhood, trip_duration,
trip_distance, passenger_count,
fare_amount, tip_pct
) %>%
# Persist results to memory and/or disk
sdf_persist()
©2018 Mirai Solutions GmbH 21/25
Example: NYC Taxi data - Leaflet visualization
©2018 Mirai Solutions GmbH 22/25
Final remarks
• sparklyr / Spark:
• usually only relevant for big data
• requires a good understanding of Spark and its configuration
parameters and memory management
• cluster sizing: number of executors, cores & memory per
executor
• know how your data is partitioned
• cache/persist data to avoid recomputations
• SparkR offers functionality similar to sparklyr. However, sparklyr has
the following advantages:
• it offers native dplyr support
• a local version of Spark (for development) can be easily
installed via spark_install directly from R
• it is extensible
©2018 Mirai Solutions GmbH 23/25
Q & A
©2018 Mirai Solutions GmbH 24/25
References
Apache Spark. 2018. “Cluster Mode Overview.”
https://spark.apache.org/docs/latest/cluster-overview.html.
Databricks. 2017. “Introduction to Apache Spark for Data Engineers.” https://
docs.databricks.com/spark/latest/gentle-introduction/for-data-engineers.html.
RStudio. 2017a. “Deploying Sparklyr.” https://spark.rstudio.com/examples/.
———. 2017b. “Sparklyr.” https://spark.rstudio.com/index.html.
©2018 Mirai Solutions GmbH 25/25

Big Data Analytics in R using sparklyr

  • 1.
    Big Data Analyticsin R using sparklyr Nicola Lambiase - Mirai Solutions 8th January 2018 ©2018 Mirai Solutions GmbH 1/25
  • 2.
    Apache Spark -Large-scale data processing Figure 1: A unified large-scale distributed data processing engine (Databricks 2017) ©2018 Mirai Solutions GmbH 2/25
  • 3.
    Why using ApacheSpark? ©2018 Mirai Solutions GmbH 3/25
  • 4.
    Spark cluster components Figure2: Overview of Spark cluster components (Apache Spark 2018) ©2018 Mirai Solutions GmbH 4/25
  • 5.
    sparklyr - AnR interface to Spark • Provides a dplyr-compatible backend to local and remote Apache Spark clusters • Supports Spark’s distributed machine learning library • Provides a mechanism to build extension packages that can leverage the full Spark API • Integrated into RStudio IDE Figure 3: Different ways sparklyr can interact with Apache Spark (RStudio 2017b) ©2018 Mirai Solutions GmbH 5/25
  • 6.
    sparklyr - Connectionto a Spark cluster Figure 4: Using sparklyr to connect to a Spark cluster (RStudio 2017a) ©2018 Mirai Solutions GmbH 6/25
  • 7.
    sparklyr - Howdoes it work? • S3 class tbl_spark provides a dplyr-compatible reference to a (remote) Spark DataFrame • dplyr verbs/commands are translated into Spark SQL statements which are then executed on Spark • dplyr operations are lazy • data is never pulled into R unless you explicitly ask for it (e.g. collect, count, etc.) • it delays work until the last possible moment • sparklyr’s sdf_* functions access the Spark DataFrame API directly • these functions will generally force any pending SQL operations in a dplyr pipeline • sparklyr’s spark_connection implements a DBI interface for Spark ©2018 Mirai Solutions GmbH 7/25
  • 8.
    sparklyr - Connectingto Spark and loading data library(sparklyr) library(dplyr) library(nycflights13) sc <- spark_connect(master = "local") flights <- copy_to(sc, flights, "flights") src_tbls(sc) [1] "flights" Figure 5: Spark integration in the RStudio IDE ©2018 Mirai Solutions GmbH 8/25
  • 9.
    sparklyr - Usingdplyr verbs in a pipeline # Find the most delayed connections most_delayed <- flights %>% group_by(origin, dest) %>% summarize(avg_dep_delay = mean(dep_delay)) %>% arrange(desc(avg_dep_delay)) ©2018 Mirai Solutions GmbH 9/25
  • 10.
    sparklyr - SparkSQL > dbplyr::sql_render(most_delayed) SELECT * FROM (SELECT `origin`, `dest`, AVG(`dep_delay`) AS `avg_dep_delay` FROM `flights` GROUP BY `origin`, `dest`) `drurrvydlq` ORDER BY `avg_dep_delay` DESC ©2018 Mirai Solutions GmbH 10/25
  • 11.
    sparklyr - Retrievedata # Collecting data into R's memory most_delayed %>% head(10) origin dest avg_dep_delay EWR TYS 41.81847 EWR CAE 36.33684 EWR TUL 34.90635 LGA SBN 31.33333 EWR OKC 30.56881 LGA BHM 29.77860 LGA CAE 29.50000 EWR DSM 29.32824 EWR JAC 28.70000 EWR ROC 27.86122 ©2018 Mirai Solutions GmbH 11/25
  • 12.
    sparklyr - Sparkconnection as DBI interface library(DBI) dbGetQuery(sc, "SELECT origin, dest, dep_delay FROM flights WHERE dep_delay < 0 ORDER BY dep_delay LIMIT 5") origin dest dep_delay JFK DEN -43 LGA MSY -33 LGA IAD -32 LGA TPA -30 LGA DEN -27 ©2018 Mirai Solutions GmbH 12/25
  • 13.
    Google BigQuery A fastand highly scalable enterprise data warehouse for analytics • Serverless and automatic high availability • Petabyte scale • High-speed streaming insertion API for real-time analytics • Standard, ANSI:2011 compliant SQL dialect • Free for up to 1TB of data analyzed each month and 10GB of data stored ©2018 Mirai Solutions GmbH 13/25
  • 14.
    sparkbq - GoogleBigQuery support for sparklyr • sparklyr extension package for Google BigQuery • Read/write BigQuery data directly into/from Spark (without having to go through R - cf. bigrquery) Figure 6: https://github.com/miraisolutions/sparkbq ©2018 Mirai Solutions GmbH 14/25
  • 15.
    Example: Shakespeare publicdataset (1) library(sparklyr) library(sparkbq) library(dplyr) config <- spark_config() sc <- spark_connect(master = "local", config = config) # Set Google BigQuery default settings bigquery_defaults( billingProjectId = "<your_billing_project_id>", gcsBucket = "<your_gcs_bucket>", datasetLocation = "US" ) ©2018 Mirai Solutions GmbH 15/25
  • 16.
    Example: Shakespeare publicdataset (2) # Reading the public shakespeare data table # https://cloud.google.com/bigquery/public-data/ # https://cloud.google.com/bigquery/sample-tables hamlet <- spark_read_bigquery( sc, name = "shakespeare", projectId = "bigquery-public-data", datasetId = "samples", tableId = "shakespeare") %>% # NOTE: predicate pushdown to BigQuery! filter(corpus == "hamlet") %>% collect() ©2018 Mirai Solutions GmbH 16/25
  • 17.
    Example: NYC Taxidata (1) • Dataset including records from all trips completed in Yellow taxis in NYC from 2009 to 2016. • Records include: • pick-up and drop-off dates/times and locations • trip distances • fares, tips and payment types • driver-reported passenger counts • etc. • R Markdown document: https://goo.gl/xM5NVC • Knitted HTML document: https://goo.gl/SMrFXB ©2018 Mirai Solutions GmbH 17/25
  • 18.
    Example: NYC Taxidata (2) Querying and (lazily) binding together all the NYC TLC yellow trips (2009-2016): all_trips_spark_by_year <- lapply(2009:2016, function(year) { spark_read_bigquery( sc = sc, name = paste0("trips", year), projectId = "bigquery-public-data", datasetId = "new_york", tableId = paste0("tlc_yellow_trips_", year), repartition = 400 ) }) all_trips_spark <- Reduce(union_all, all_trips_spark_by_year) ©2018 Mirai Solutions GmbH 18/25
  • 19.
    Example: NYC Taxidata (3) Calculate average tip (as percentage of the fare amount) per NYC neighborhood: credit_trips_spark_1 <- all_trips_spark %>% filter( # Trips paid by credit card payment_type %in% c("CREDIT", "CRD", "1") & # Filter out bad data points fare_amount > 1 & tip_amount >= 0 & trip_distance > 0 & passenger_count > 0 ) %>% select( vendor_id, pickup_datetime, dropoff_datetime, pickup_latitude, pickup_longitude, trip_distance, passenger_count, fare_amount, tip_amount ) ©2018 Mirai Solutions GmbH 19/25
  • 20.
    Example: NYC Taxidata (4) credit_trips_spark_2 <- credit_trips_spark_1 %>% # Join with NYC neighborhoods sparkgeo::sdf_spatial_join(neighborhoods, pickup_latitude, pickup_longitude) %>% # NOTE: timestamps are currently returned as microseconds # since the epoch mutate( trip_duration = (dropoff_datetime - pickup_datetime) / 1e6, pickup_datetime = from_unixtime(pickup_datetime / 1e6) ) %>% mutate( pickup_month = month(pickup_datetime), pickup_weekday = date_format(pickup_datetime, 'EEEE'), pickup_hour = hour(pickup_datetime), # Calculate tip percentage based on fare amount tip_pct = tip_amount / fare_amount * 100 ) ©2018 Mirai Solutions GmbH 20/25
  • 21.
    Example: NYC Taxidata (5) credit_trips_spark <- credit_trips_spark_2 %>% select( vendor_id, pickup_month, pickup_weekday, pickup_hour, neighborhood, trip_duration, trip_distance, passenger_count, fare_amount, tip_pct ) %>% # Persist results to memory and/or disk sdf_persist() ©2018 Mirai Solutions GmbH 21/25
  • 22.
    Example: NYC Taxidata - Leaflet visualization ©2018 Mirai Solutions GmbH 22/25
  • 23.
    Final remarks • sparklyr/ Spark: • usually only relevant for big data • requires a good understanding of Spark and its configuration parameters and memory management • cluster sizing: number of executors, cores & memory per executor • know how your data is partitioned • cache/persist data to avoid recomputations • SparkR offers functionality similar to sparklyr. However, sparklyr has the following advantages: • it offers native dplyr support • a local version of Spark (for development) can be easily installed via spark_install directly from R • it is extensible ©2018 Mirai Solutions GmbH 23/25
  • 24.
    Q & A ©2018Mirai Solutions GmbH 24/25
  • 25.
    References Apache Spark. 2018.“Cluster Mode Overview.” https://spark.apache.org/docs/latest/cluster-overview.html. Databricks. 2017. “Introduction to Apache Spark for Data Engineers.” https:// docs.databricks.com/spark/latest/gentle-introduction/for-data-engineers.html. RStudio. 2017a. “Deploying Sparklyr.” https://spark.rstudio.com/examples/. ———. 2017b. “Sparklyr.” https://spark.rstudio.com/index.html. ©2018 Mirai Solutions GmbH 25/25