Download to read offline

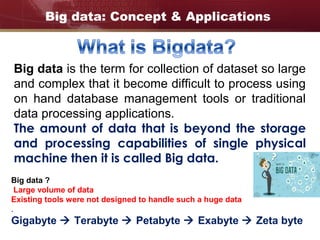
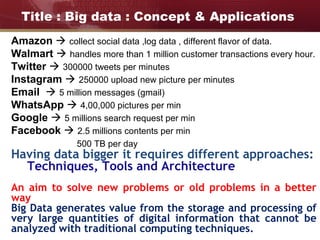
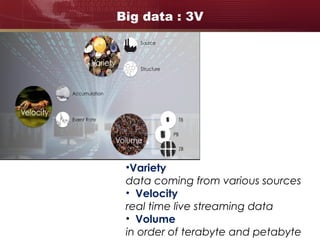
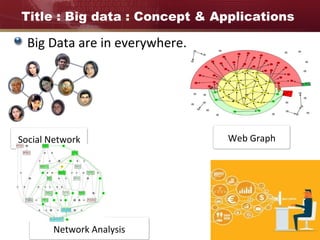
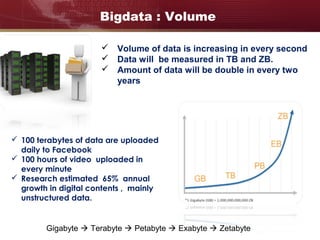
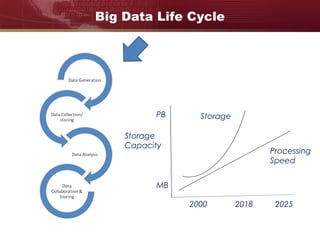
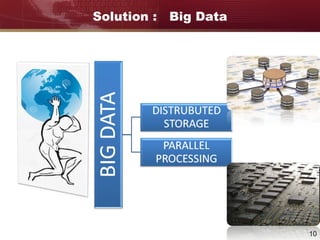
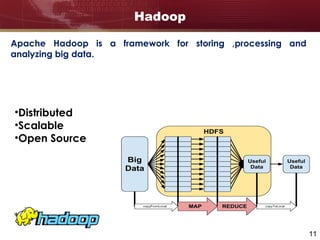
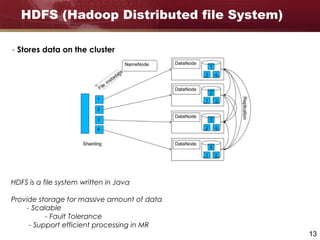
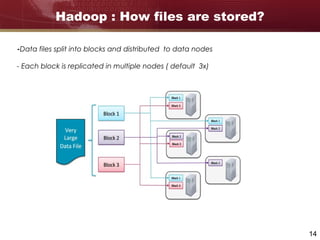
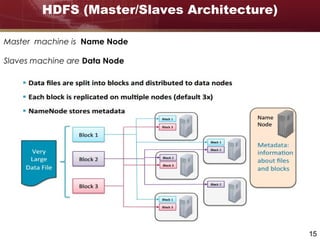
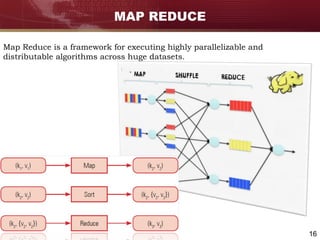
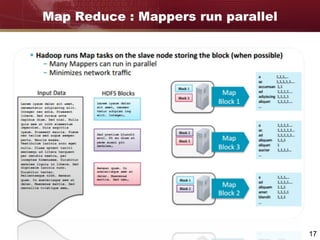
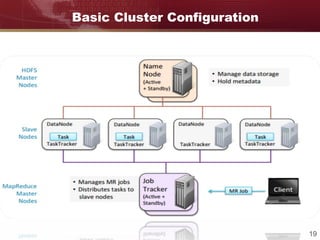
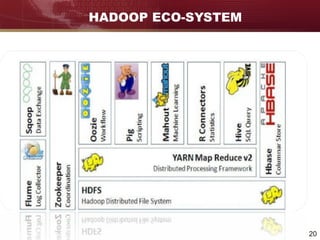
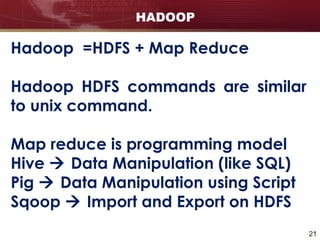


Big data refers to large and complex datasets that are difficult to process using traditional data management tools. As data grows from gigabytes to terabytes to petabytes, new techniques are needed to store, process, and analyze this data. Hadoop is an open-source framework that uses distributed storage and processing to handle big data across clusters of computers. It includes HDFS for storage and MapReduce as a programming model for distributed processing of large datasets in parallel.


![Getting Started with Apache Spark: Big Data Made Simple [Free Meetup]](https://cdn.slidesharecdn.com/ss_thumbnails/apachesparkgettingstarted-260203175547-8361bcc3-thumbnail.jpg?width=640&height=640&fit=bounds)


