Big Data
Big datarefers to the incredible volume of data being generated exponentially in today’s digital world. It
is being generated and captured across multiple sectors, including:
● Logistics
● Financial Services
● Healthcare
● Retail
● Startups
● Social Networks
● Internet of Things (IoT)
As IoT and social media platforms expand, they continuously generate or capture massive volumes of
data.
3.
Course Coverage
This courseoffers an in-depth understanding of the core concepts and technologies in the Big Data
Computing landscape. Here’s what we'll cover:
● Hadoop Ecosystem and Distributions
● MapReduce Programming Model
● Apache Spark Framework
● Large-Scale Data Storage Technologies
● Key-Value Stores and NoSQL Databases
○ Examples: Apache Cassandra, HBase
● Real-time Big Data Streaming Platforms
○ Examples: Apache Spark Streaming, Apache Kafka Streams
● Scalable Machine Learning with Spark MLlib
● Large-Scale Graph Processing using Spark GraphX
4.
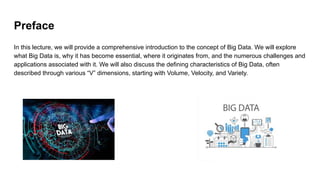
Preface
In this lecture,we will provide a comprehensive introduction to the concept of Big Data. We will explore
what Big Data is, why it has become essential, where it originates from, and the numerous challenges and
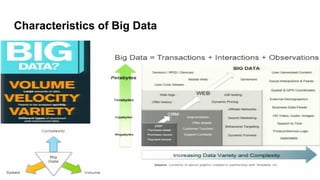
applications associated with it. We will also discuss the defining characteristics of Big Data, often
described through various “V” dimensions, starting with Volume, Velocity, and Variety.
5.
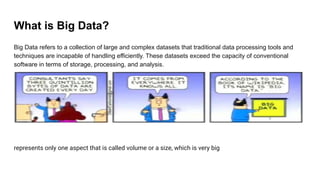
What is BigData?
Big Data refers to a collection of large and complex datasets that traditional data processing tools and
techniques are incapable of handling efficiently. These datasets exceed the capacity of conventional
software in terms of storage, processing, and analysis.
represents only one aspect that is called volume or a size, which is very big
6.
Challenges of BigData
With such a massive volume of data, several challenges arise:
● Capturing large datasets
● Curation and storage of information
● Searching and sharing data
● Transferring and analyzing it in real time
● Visualizing insights meaningfully
These challenges are driving the need for specialized systems, tools, and frameworks.
7.
Applications and Opportunities
BigData offers numerous opportunities across domains:
● Business: Spotting trends, improving research quality
● Healthcare: Preventing diseases
● Legal: Linking citations
● Public safety: Combating crimes
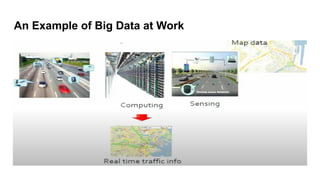
● Transport: Real-time traffic monitoring
8.
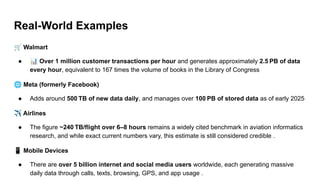
Real-World Examples
🛒 Walmart
●📊 Over 1 million customer transactions per hour and generates approximately 2.5 PB of data
every hour, equivalent to 167 times the volume of books in the Library of Congress
🌐 Meta (formerly Facebook)
● Adds around 500 TB of new data daily, and manages over 100 PB of stored data as of early 2025
✈ Airlines
● The figure ~240 TB/flight over 6–8 hours remains a widely cited benchmark in aviation informatics
research, and while exact current numbers vary, this estimate is still considered credible .
📱 Mobile Devices
● There are over 5 billion internet and social media users worldwide, each generating massive
daily data through calls, texts, browsing, GPS, and app usage .
9.
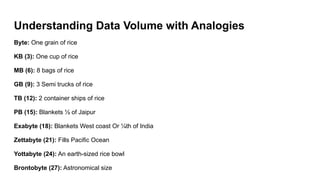
Understanding Data Volumewith Analogies
Byte: One grain of rice
KB (3): One cup of rice
MB (6): 8 bags of rice
GB (9): 3 Semi trucks of rice
TB (12): 2 container ships of rice
PB (15): Blankets ½ of Jaipur
Exabyte (18): Blankets West coast Or ¼th of India
Zettabyte (21): Fills Pacific Ocean
Yottabyte (24): An earth-sized rice bowl
Brontobyte (27): Astronomical size
10.
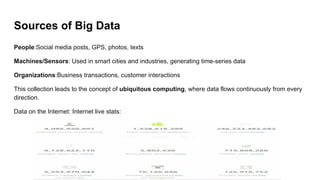
Sources of BigData
People:Social media posts, GPS, photos, texts
Machines/Sensors: Used in smart cities and industries, generating time-series data
Organizations:Business transactions, customer interactions
This collection leads to the concept of ubiquitous computing, where data flows continuously from every
direction.
Data on the Internet: Internet live stats:
11.
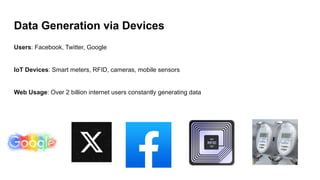
Data Generation viaDevices
Users: Facebook, Twitter, Google
IoT Devices: Smart meters, RFID, cameras, mobile sensors
Web Usage: Over 2 billion internet users constantly generating data
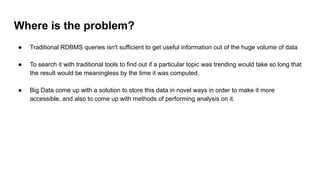
Where is theproblem?
● Traditional RDBMS queries isn't sufficient to get useful information out of the huge volume of data
● To search it with traditional tools to find out if a particular topic was trending would take so long that
the result would be meaningless by the time it was computed.
● Big Data come up with a solution to store this data in novel ways in order to make it more
accessible, and also to come up with methods of performing analysis on it.
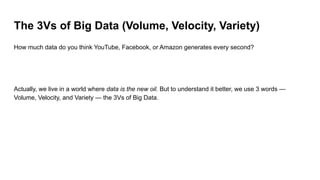
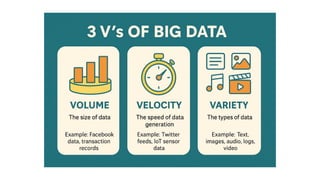
The 3Vs ofBig Data (Volume, Velocity, Variety)
How much data do you think YouTube, Facebook, or Amazon generates every second?
Actually, we live in a world where data is the new oil. But to understand it better, we use 3 words —
Volume, Velocity, and Variety — the 3Vs of Big Data.
16.
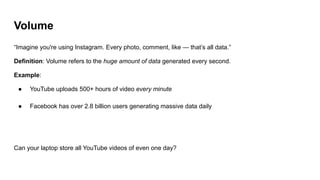
Volume
“Imagine you're usingInstagram. Every photo, comment, like — that’s all data.”
Definition: Volume refers to the huge amount of data generated every second.
Example:
● YouTube uploads 500+ hours of video every minute
● Facebook has over 2.8 billion users generating massive data daily
Can your laptop store all YouTube videos of even one day?
17.
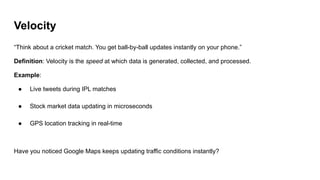
Velocity
“Think about acricket match. You get ball-by-ball updates instantly on your phone.”
Definition: Velocity is the speed at which data is generated, collected, and processed.
Example:
● Live tweets during IPL matches
● Stock market data updating in microseconds
● GPS location tracking in real-time
Have you noticed Google Maps keeps updating traffic conditions instantly?
18.
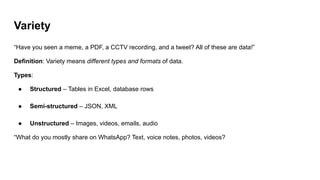
Variety
“Have you seena meme, a PDF, a CCTV recording, and a tweet? All of these are data!”
Definition: Variety means different types and formats of data.
Types:
● Structured – Tables in Excel, database rows
● Semi-structured – JSON, XML
● Unstructured – Images, videos, emails, audio
“What do you mostly share on WhatsApp? Text, voice notes, photos, videos?
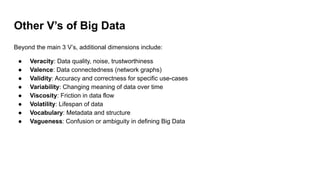
Other V’s ofBig Data
Beyond the main 3 V’s, additional dimensions include:
● Veracity: Data quality, noise, trustworthiness
● Valence: Data connectedness (network graphs)
● Validity: Accuracy and correctness for specific use-cases
● Variability: Changing meaning of data over time
● Viscosity: Friction in data flow
● Volatility: Lifespan of data
● Vocabulary: Metadata and structure
● Vagueness: Confusion or ambiguity in defining Big Data
22.
Types of BigData
How many of you use YouTube or Instagram daily?
Do you think you’re just watching videos? Or are you also generating data for them?
23.
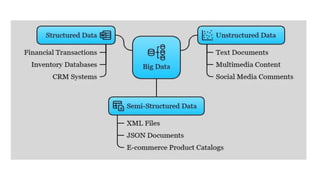
Big Data canbe divided into three types, based on the nature of data:
1. Structured Data
Data that is organized in rows and columns, like in Excel sheets or Databases.
Example:
● Student attendance records
● Online order receipts
● Bank transaction logs
“Can you tell me where else you’ve seen such structured data?”
24.
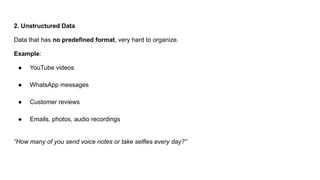
2. Unstructured Data
Datathat has no predefined format, very hard to organize.
Example:
● YouTube videos
● WhatsApp messages
● Customer reviews
● Emails, photos, audio recordings
“How many of you send voice notes or take selfies every day?”
25.
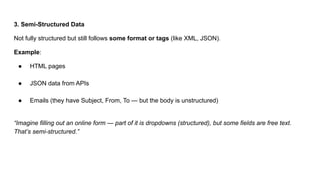
3. Semi-Structured Data
Notfully structured but still follows some format or tags (like XML, JSON).
Example:
● HTML pages
● JSON data from APIs
● Emails (they have Subject, From, To — but the body is unstructured)
“Imagine filling out an online form — part of it is dropdowns (structured), but some fields are free text.
That’s semi-structured.”
26.
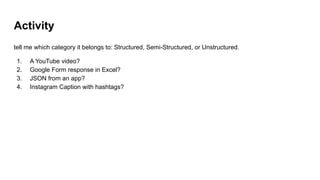
Activity
tell me whichcategory it belongs to: Structured, Semi-Structured, or Unstructured.
1. A YouTube video?
2. Google Form response in Excel?
3. JSON from an app?
4. Instagram Caption with hashtags?
28.
Intelligent Data Analysis(IDA)
Every time you search something on Google, do you know what happens behind the scenes?
“It’s not just data retrieval — it’s intelligent analysis to give you the best results!”
29.
What is IntelligentData Analysis?
IDA refers to applying advanced tools and algorithms (like AI, Machine Learning, and Statistics) to
extract meaningful patterns, trends, and insights from large and complex data.
Simple Analogy:
“Imagine a gold mine (big data). Traditional methods are like digging randomly.
IDA is like using a smart metal detector — it tells you where to dig, how deep, and what kind of gold you’ll
get.”
30.
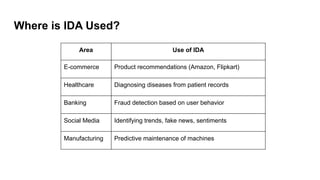
Where is IDAUsed?
Area Use of IDA
E-commerce Product recommendations (Amazon, Flipkart)
Healthcare Diagnosing diseases from patient records
Banking Fraud detection based on user behavior
Social Media Identifying trends, fake news, sentiments
Manufacturing Predictive maintenance of machines
31.
Traditional vs BigData Business Approach
How did businesses like Kirana shops or old banks work 20 years ago?
And how do companies like Amazon, Zomato, or Google run today?
32.
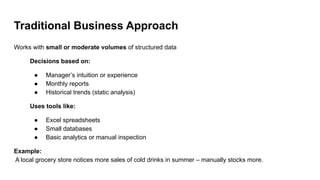
Traditional Business Approach
Workswith small or moderate volumes of structured data
Decisions based on:
● Manager’s intuition or experience
● Monthly reports
● Historical trends (static analysis)
Uses tools like:
● Excel spreadsheets
● Small databases
● Basic analytics or manual inspection
Example:
A local grocery store notices more sales of cold drinks in summer – manually stocks more.
33.
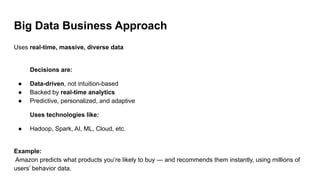
Big Data BusinessApproach
Uses real-time, massive, diverse data
Decisions are:
● Data-driven, not intuition-based
● Backed by real-time analytics
● Predictive, personalized, and adaptive
Uses technologies like:
● Hadoop, Spark, AI, ML, Cloud, etc.
Example:
Amazon predicts what products you’re likely to buy — and recommends them instantly, using millions of
users’ behavior data.
34.
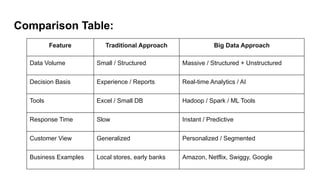
Comparison Table:
Feature TraditionalApproach Big Data Approach
Data Volume Small / Structured Massive / Structured + Unstructured
Decision Basis Experience / Reports Real-time Analytics / AI
Tools Excel / Small DB Hadoop / Spark / ML Tools
Response Time Slow Instant / Predictive
Customer View Generalized Personalized / Segmented
Business Examples Local stores, early banks Amazon, Netflix, Swiggy, Google
35.
Case Study ofBig Data Solutions
Can Big Data really change how companies work — or is it just a buzzword?
36.
Case Study 1:AmazonPersonalized Recommendations
Problem:
● Millions of users shop daily.
● How to show each customer what they want — and increase sales?
Big Data Solution:
● Amazon collects browsing history, cart activity, purchase patterns, reviews, etc.
● Uses Big Data + Machine Learning to recommend products in real-time.
Outcome:
35% of Amazon’s revenue comes from its recommendation engine.
37.
Case Study 2:Netflix – Content Recommendations &
Production
Problem:
● Viewers get lost in 1000s of shows.
● How to keep them engaged — and reduce churn?
Big Data Solution:
● Netflix tracks:
○ What you watch, pause, skip
○ Viewing time, device type, user feedback
● Uses this to:
○ Recommend shows (like “Because you watched…”)
○ Decide what content to produce next (e.g., House of Cards was based on data!)
Outcome:✅ Saved millions on market research, ✅ Boosted user retention and engagement
38.
Case Study 3:Uber – Dynamic Pricing & Route
Optimization
Problem:
● Demand changes by location and time.
● How to ensure rides are always available and profitable?
Big Data Solution:
● Uber uses real-time traffic, weather, user demand, driver location.
● Applies Big Data + Algorithms to:
○ Adjust prices dynamically (surge pricing)
○ Optimize driver routes
○ Reduce wait times
Outcome: ✅ Faster pickups
✅ Better driver earnings
✅ Maximized efficiency


![Big_Data_ppt[1] (1).pptx](https://cdn.slidesharecdn.com/ss_thumbnails/bigdatappt11-230720100552-10b674be-thumbnail.jpg?width=640&height=640&fit=bounds)


